
Last time we spoke, I told you about our (then) brand-spankin’-new OTel over HTTP implementation, in both our OpenTelemetry Source and Destination. That was a little over a year ago, also known as a lifetime in tech! I wanted to take another opportunity to speak to you and introduce some of our new OpenTelemetry features, and share how you can put them into practice!
New and Multiple Versions
Since our original OTel Source and Destination implementation, which supported OTLP version 0.10.0, the OpenTelemetry authors have been busy pumping out and stable-ifying new versions of the open protocol. We all know that staying current with the latest standards and protocols is crucial in the rapidly evolving world of observability. So, we took this opportunity to bring in the latest and greatest (at the time of development, of course) version 1.3.1.
Supporting multiple versions of OTLP within the same pipeline may sound complex, but Cribl Stream makes it easy. Our implementation ensures that your data flows smoothly without disruption, whether you’re using the older 0.10.0 version or the newer 1.3.1 version.
To support backward compatibility, we still support version 0.10.0 in both our Source and Destination. However, a new configuration option allows you to select your preferred version, defaulting to the new 1.3.1 version. And don’t worry; we don’t force-upgrade any existing configurations to the new version, ensuring a smooth transition whenever you would like to upgrade!
Log Support
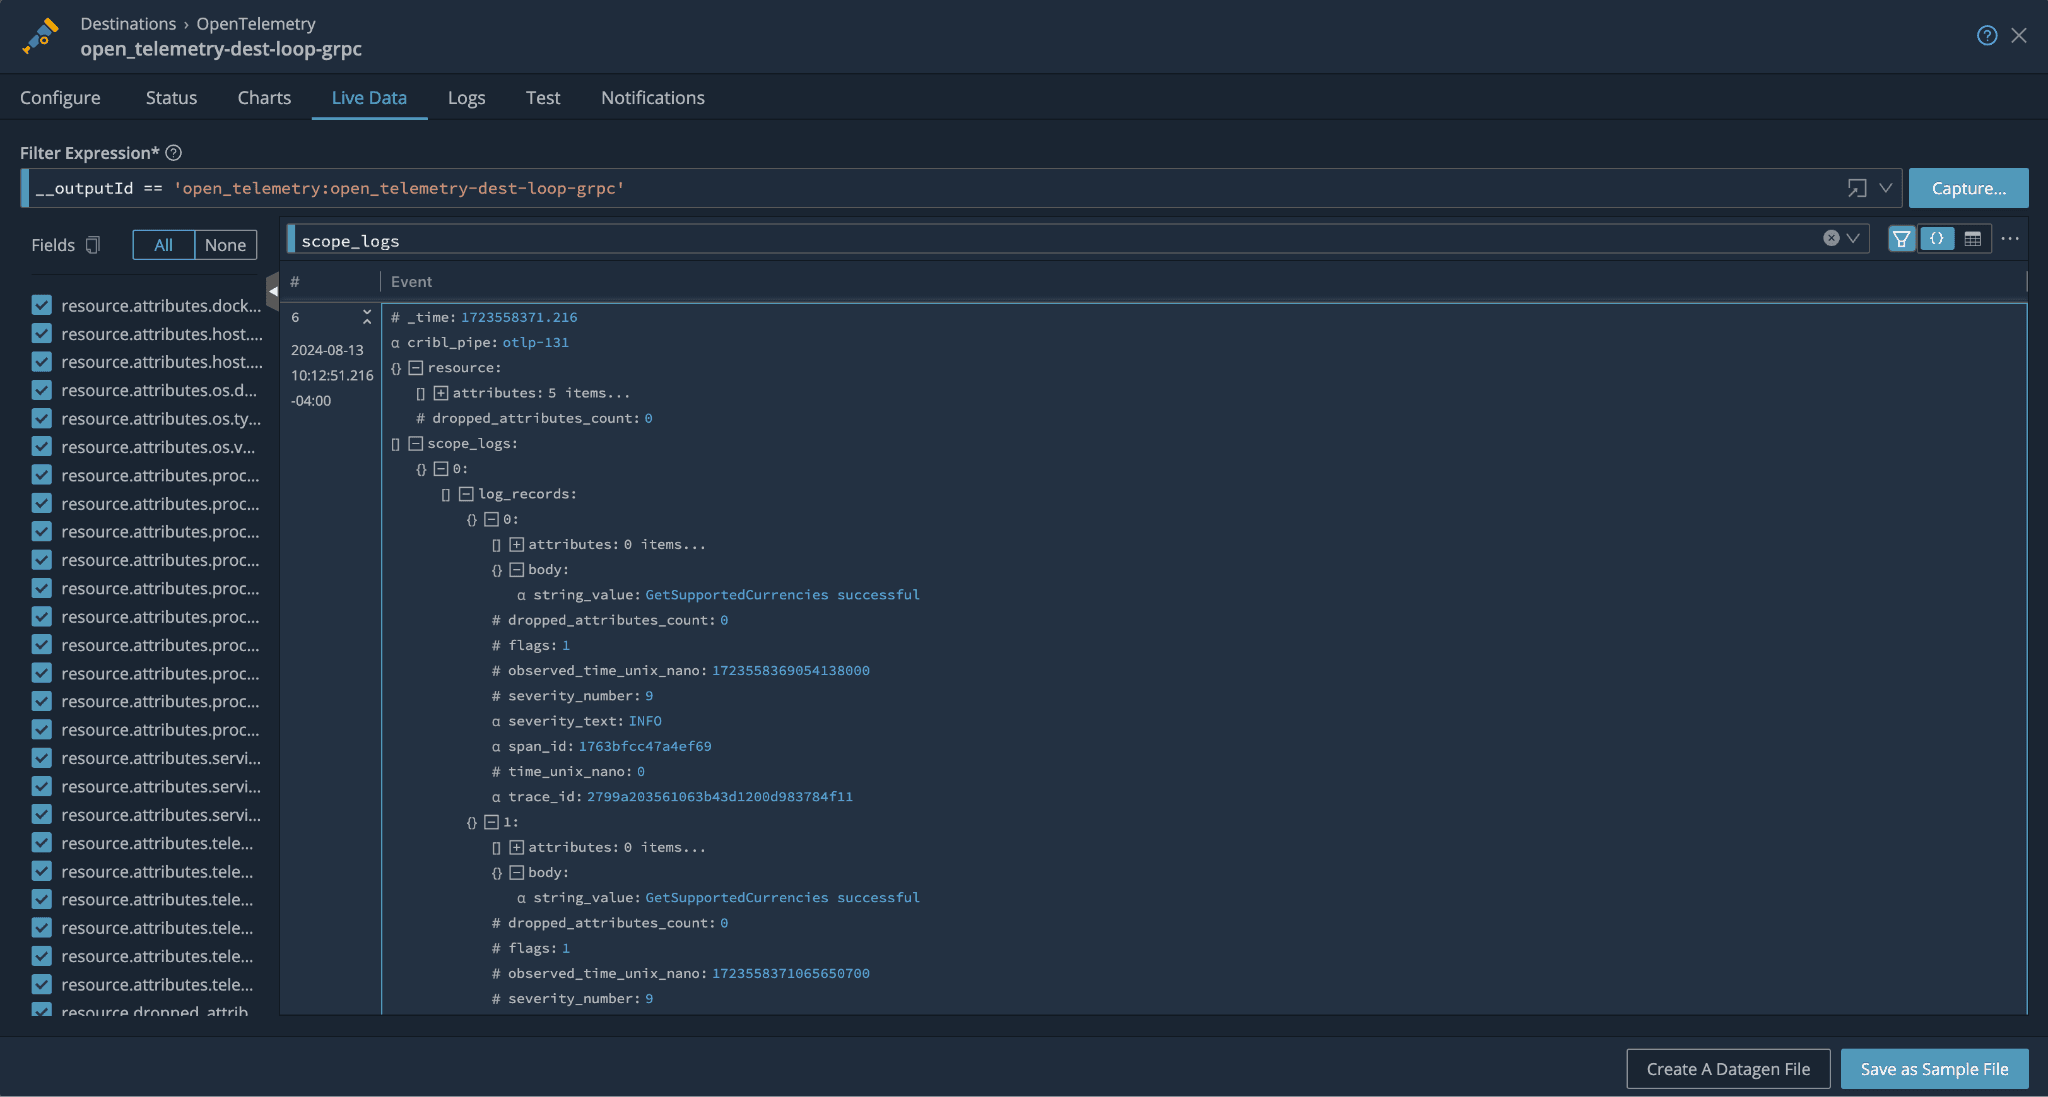
While metrics and traces provide valuable insights into your applications’ performance and flow, logs offer a different level of visibility—one that captures detailed, contextual information about events as they happen. Recognizing logs’ critical role in comprehensive observability, Cribl Stream now fully supports logs within its OpenTelemetry implementation.
When Stream introduced OpenTelemetry, OTel’s logs support was in its “experimental” phase. We decided then to hold off on its implementation until it got more stable, and until we saw more adoption of OTLP Logs in the wild.
Well, that time has come!
Whether it’s capturing application errors, user interactions, or security events, the ability to stream logs through the same pipeline as your metrics and traces means you can maintain a holistic view of your system’s health and behavior. This unification simplifies your observability stack, reduces the need for multiple tools, and ensures that all your data is available when needed. And, to keep things as simple as possible for our users, there’s no extra configuration required to enable Log support – it comes right out of the box with our OTel Source and Destination!
One might say it took us long enough to implement logs support for a product whose original name was LogStream. 😅
OTLP Batching Support
Batching is an integral concept of OTLP. It allows users to de-duplicate data by way of shared “resource attributes” to allow for smaller payloads across the wire. It’s built into OTel Collectors, and as of today, also into Stream! This is especially pertinent to Stream, since Stream’s OTel Source exposes the option of “Extracting Metrics/Traces/Logs” into individual events. This extracting is great for our users since it allows them to enhance/mask/sample their OTel events as they flow through Stream, treating these extracted events like any other event. This gives our users the familiar and powerful feeling of full control of their data!
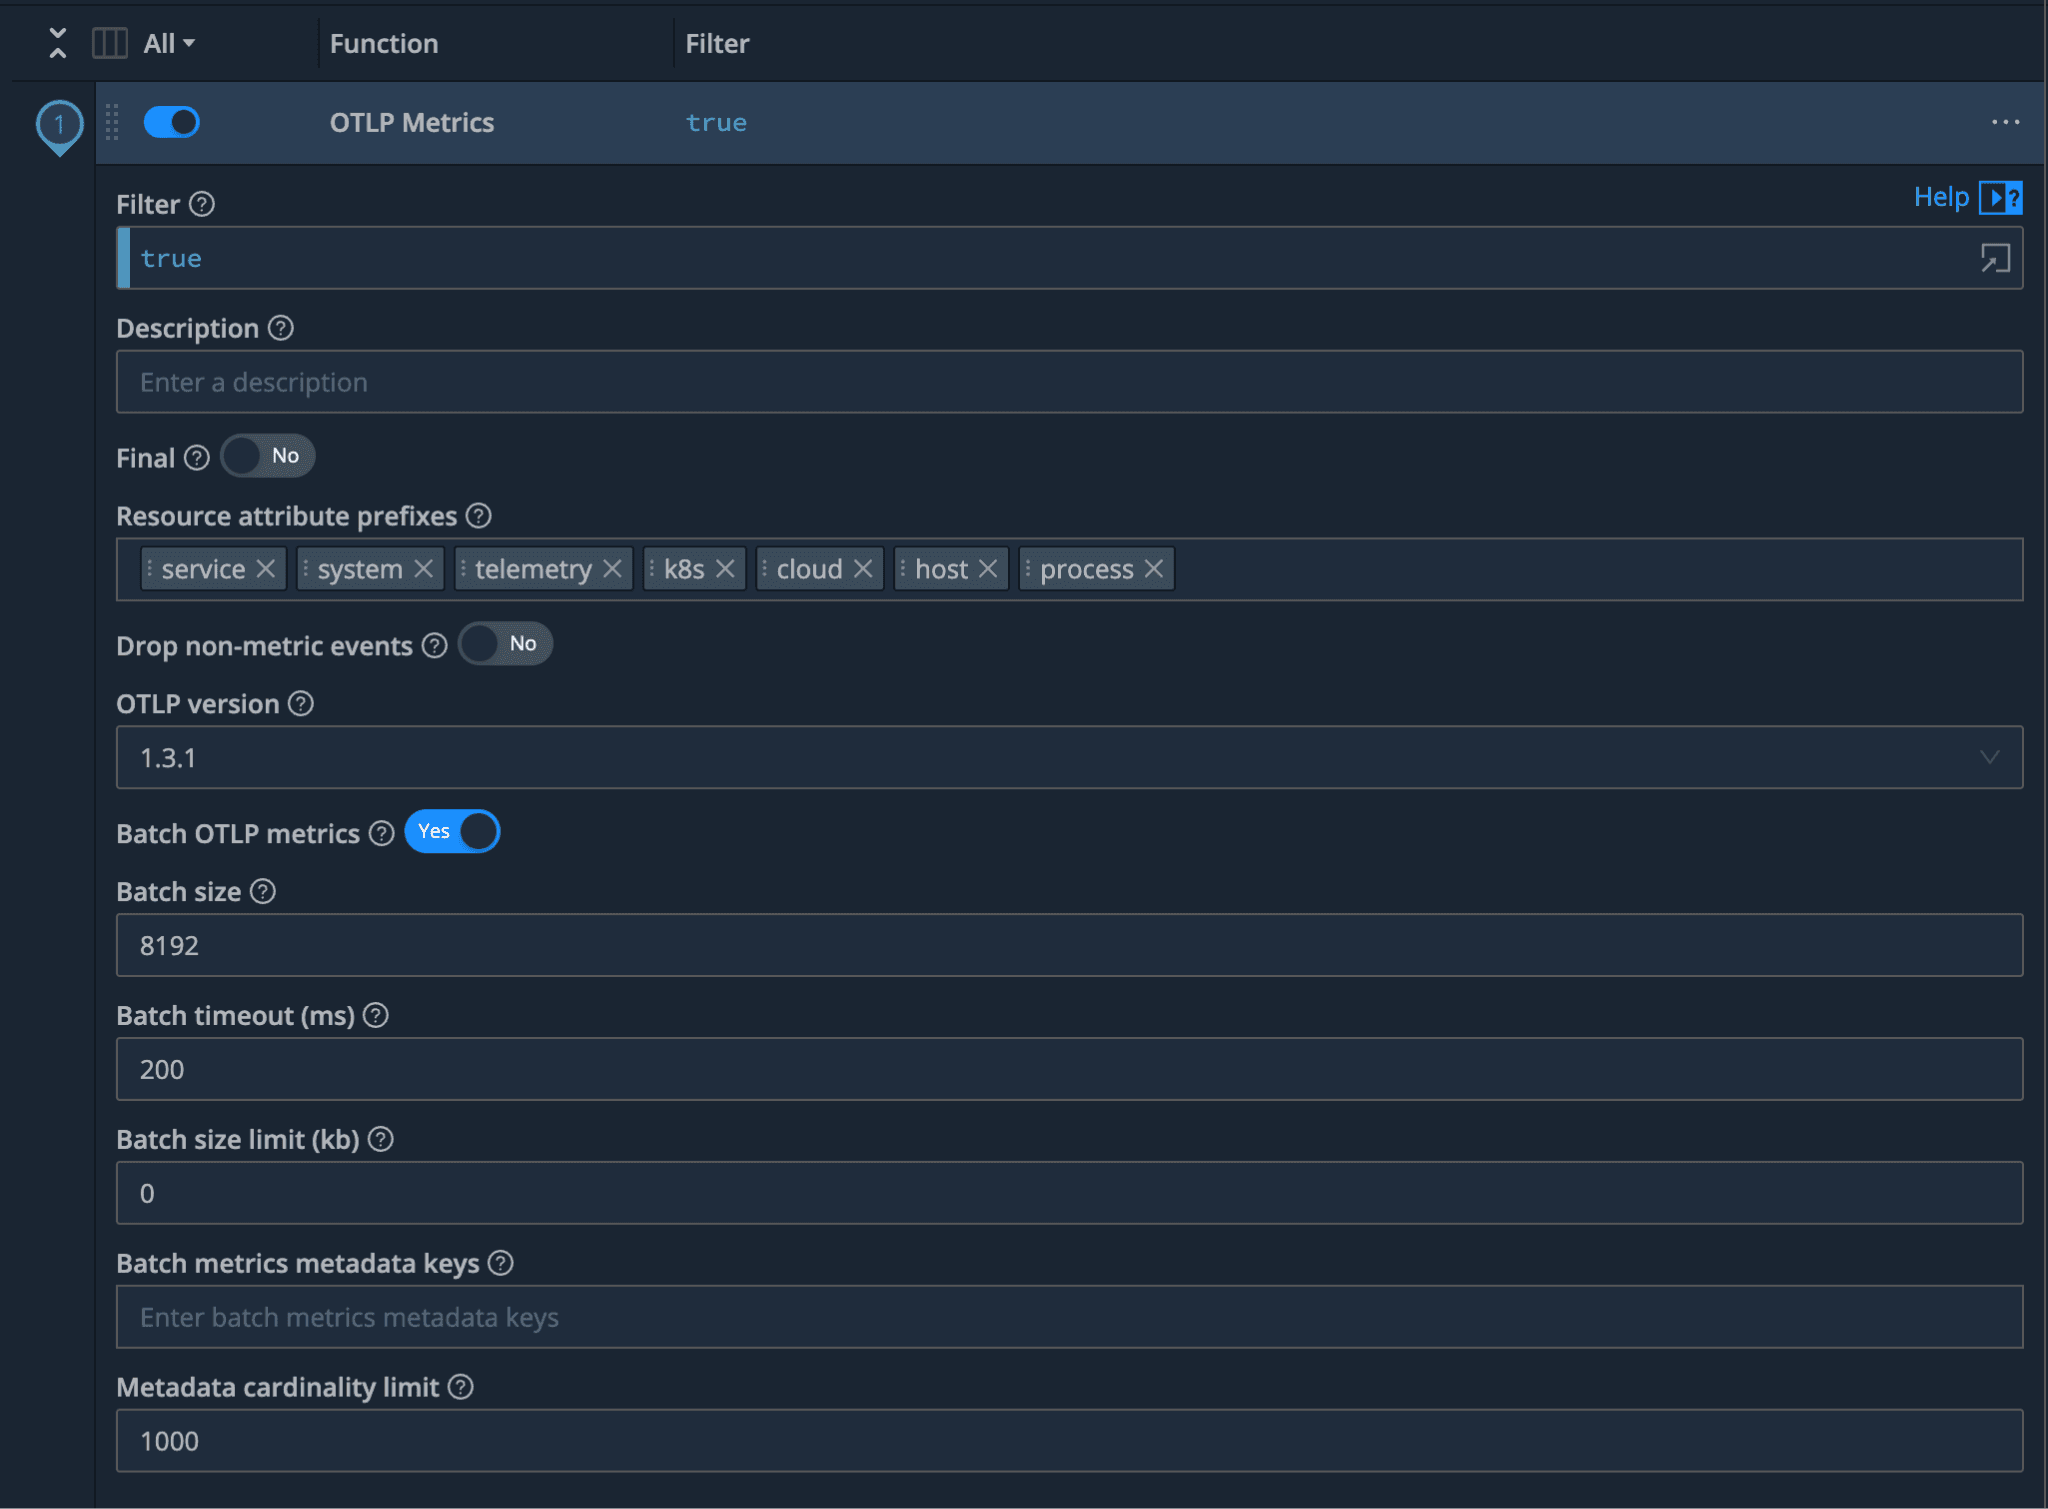
To leverage the new batching functionality across metrics, traces, and logs, one can use the OTLP Metrics, OTLP Traces, and OTLP Logs Pipeline Functions, respectively. Each of these Functions can be configured to batch by size (number of events), timeout (time-based), or batch size (number of kilobytes). Additionally, users can configure extra metadata keys and define a metadata cardinality limit. This brings our Functions up to parity with proper OTel Collectors, as defined by OTel’s Batch Processor documentation.
Note that while batching your OTLP data will lower the size of your egress payload data, we cannot speak for how other third-party observability vendors store the data on their end. Meaning that while batching will de-duplicate resource attributes on events flowing out of Stream, external providers might be re-duplicating these attributes, depending on how they choose to store this data. This is another reason why we recommend trying out our new product, Cribl Lake for long term, flexible storage. Store data the way you want (i.e., de-duplicated), and then replay it anytime you need to get it to where you need it.
More Metrics
As our journey with OpenTelemetry evolves, so does the scope of metrics that can be collected and analyzed. In our latest update, Cribl Stream has expanded its support to include a broader range of metrics, specifically adding histograms, sums, and summaries, empowering you to gain even deeper insights into your application’s performance and reliability.
With the growing complexity of modern applications, it’s not just about collecting more data – it’s about collecting the right data. In addition to the standard system and application metrics, Cribl Stream now supports an extended set of OpenTelemetry metrics.
The OTel Tail End: Where to Next?
And so, we reach the end of our latest chapter in the ongoing saga of OpenTelemetry and Cribl Stream. From embracing new OTLP versions to expanding our observability capabilities with log support and OTLP batching, it’s clear that the world of observability isn’t slowing down – and neither are we.
Integrating these new features into your Cribl ecosystem means you’re not just keeping up with the latest trends – you’re staying ahead of the curve. Whether you’re fine-tuning your system with more varied metrics, capturing critical log data, or ensuring seamless compatibility across multiple OTLP versions, you’re building an observability solution that’s as flexible as it is powerful.
But the story doesn’t end here. With each new version and feature, OpenTelemetry and Cribl Stream continue to evolve. So, keep experimenting, optimizing, and pushing the boundaries of what’s possible in observability. The next chapter is already in the works, and we can’t wait to see where it takes us.
Until then, happy monitoring – and remember, in observability, the story is never truly over.