
In today's complex security landscape, gaining visibility into Windows environments is crucial. However, collecting, processing, and analyzing the massive volume of Windows Event Logs is a well-known challenge for security teams—these logs are noisy, high-volume, and notoriously difficult to manage at scale. Whether you’re replacing an existing SIEM or augmenting your security stack with a data tiering strategy, Cribl Edge and Stream make it simple to get Windows Event data into Google SecOps without the usual friction. Cribl enables you to ingest logs directly from your environment—whether it’s raw data, syslog, or Windows Events—then seamlessly onboard them into Google SecOps through a centralized control plane in minutes. With no need for extra agents or infrastructure, you can cost-effectively support massive amounts of higher-quality data, unlocking more effective threat detection and response regardless of retention requirements. This blog explores how you can leverage Cribl Edge and Cribl Stream to streamline this process, while also gaining more control over your data.
The Source
To begin, let’s configure the source for our Windows Event Logs. For the purposes of this blog, we’ll use Cribl Edge to get our Windows Event Logs to Google SecOps by two different methods:
Edge → Google SecOps directly
Edge → Cribl Stream → Google SecOps
By sending data through Stream first, you can centralize data flows from multiple Edge nodes or optimize resources on the Edge Nodes themselves. In environments with limited Edge node resources, heavier, more advanced data processing can be offloaded to Stream.
Installing an Edge Node is made simple through Cribl’s bootstrapping process. Administrators can use the Edge UI to generate a Windows-specific script by selecting the desired Fleet, Leader connection details, and other configuration options. The script dynamically updates based on the inputs. Once copied and executed in a Windows command prompt or PowerShell (with administrative privileges), the Edge Node is automatically installed and configured.
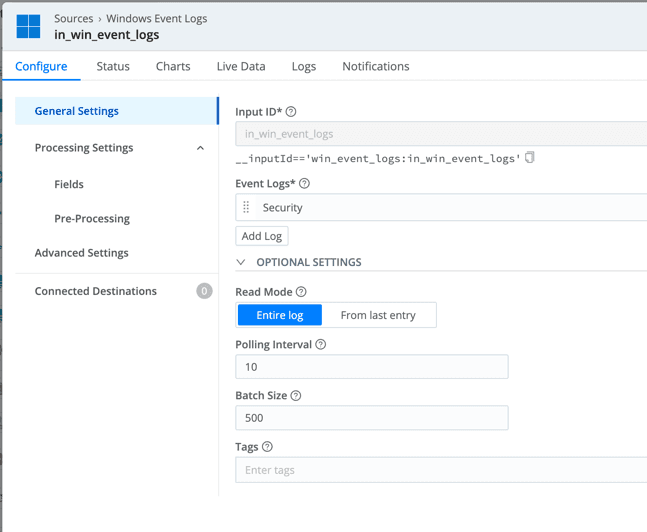
After an Edge Node is installed and appears in the assigned Fleet in your Leader Node, you can configure a Windows Event Logs source to collect the logs you are interested in (e.g. System, Application, Security, etc.). Be sure to change the Event format field to XML since the Google SecOps parser will be expecting the logs to be in this format.
The Destination
Now, let’s focus on configuring the Destination. I mentioned we would talk about two different approaches for sending data to Google SecOps. The first, sending directly from Edge to SecOps. And the second, sending from Edge to Stream, then to SecOps. The configuration of the Destination will be the same in both Edge and Stream for integrating with SecOps.
To guide you through configuring your Google SecOps Destination in Stream, I’ll explain each of the specific settings for our Windows Event Logs.
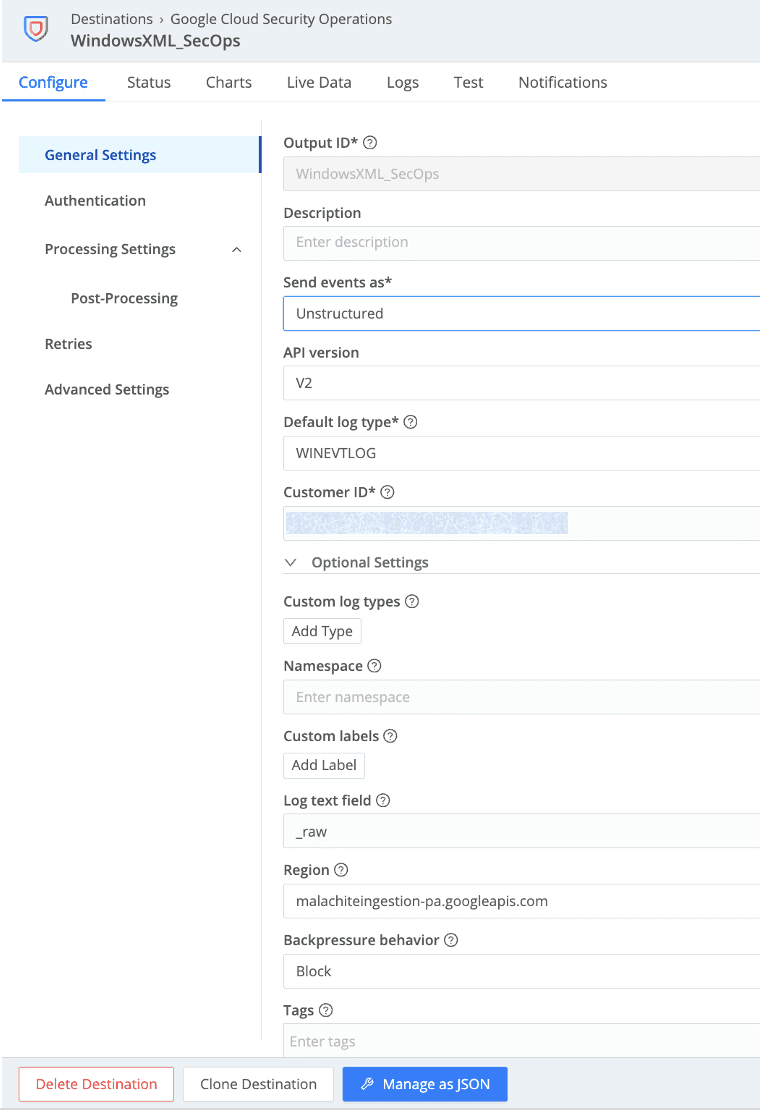
The following settings are under General Settings on the sidebar:
Output ID:
Obviously, we want to give the Destination a friendly name. An important thing to consider when naming your destination is your approach to sending the data to Google SecOps. There are two approaches you can take:
Create one Destination per data source.
Create a single Destination and utilize
__logTypefield in your pipeline to route to the proper parser. (see more on__logTypebelow)
If using the first approach, you will want to indicate the data source in the name of the Destination.
Send events as:
You have two options here: Unstructured or UDM. For Sources with an existing parser within Google SecOps (Google-provided or custom), send events as Unstructured and let the parsers do the work converting the logs to UDM format on the Google SecOps side.
UDM is typically used for custom sources that don’t have a parser. This requires you to format the logs in the proper UDM structure in a pipeline, which in turn requires some understanding of the UDM schema. For assistance with UDM, Cribl Copilot Editor, an interactive, AI-powered assistant within Cribl Stream, can help you build pipelines to transform your logs to UDM format.
API version:
This is the version of the Ingestion API, with two options for this Destination:
V1 (to be deprecated by Google)
Supports API key for authentication.
V2 (default for new configurations)
Supports only Service Account Credentials for authentication.
V1 Alpha (new, high performance)
Not directly supported by this Destination, though Stream can send here using a Webhook Destination.
Default log type:
This assigns a log type to events that don’t have __logType set. Remember when I mentioned the two approaches for sending data? If you create a Destination per data Source, set this to the appropriate log type, which will map to a parser in Google SecOps.
If you set __logType in your pipeline, it will override the value set in Default log type. This allows you to have a single Destination. Fields prefixed with __ are internal fields and serve as meta fields to assist in data handling and processing decisions. These fields are not part of the event itself but are accessible for use in functions and pipelines.
The dropdown will list parsers, and your selection will map to the Google SecOps parser’s actual name.
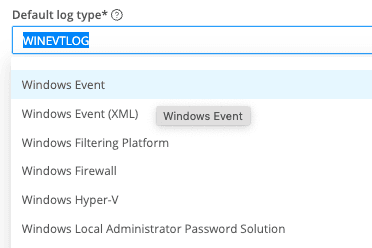
If you choose Custom log type in this field, you must add the log type in the Custom log types table.

Customer ID:
This is the ID corresponding to the customer’s Google SecOps instance, found in Google SecOps under Settings > Organization Details.
Log text field:
This is the name of the event field containing the log text to send (e.g.,_raw). If this isn’t specified, Stream will send a JSON representation of the entire event. We will be setting it to _raw for the Windows Event Logs.
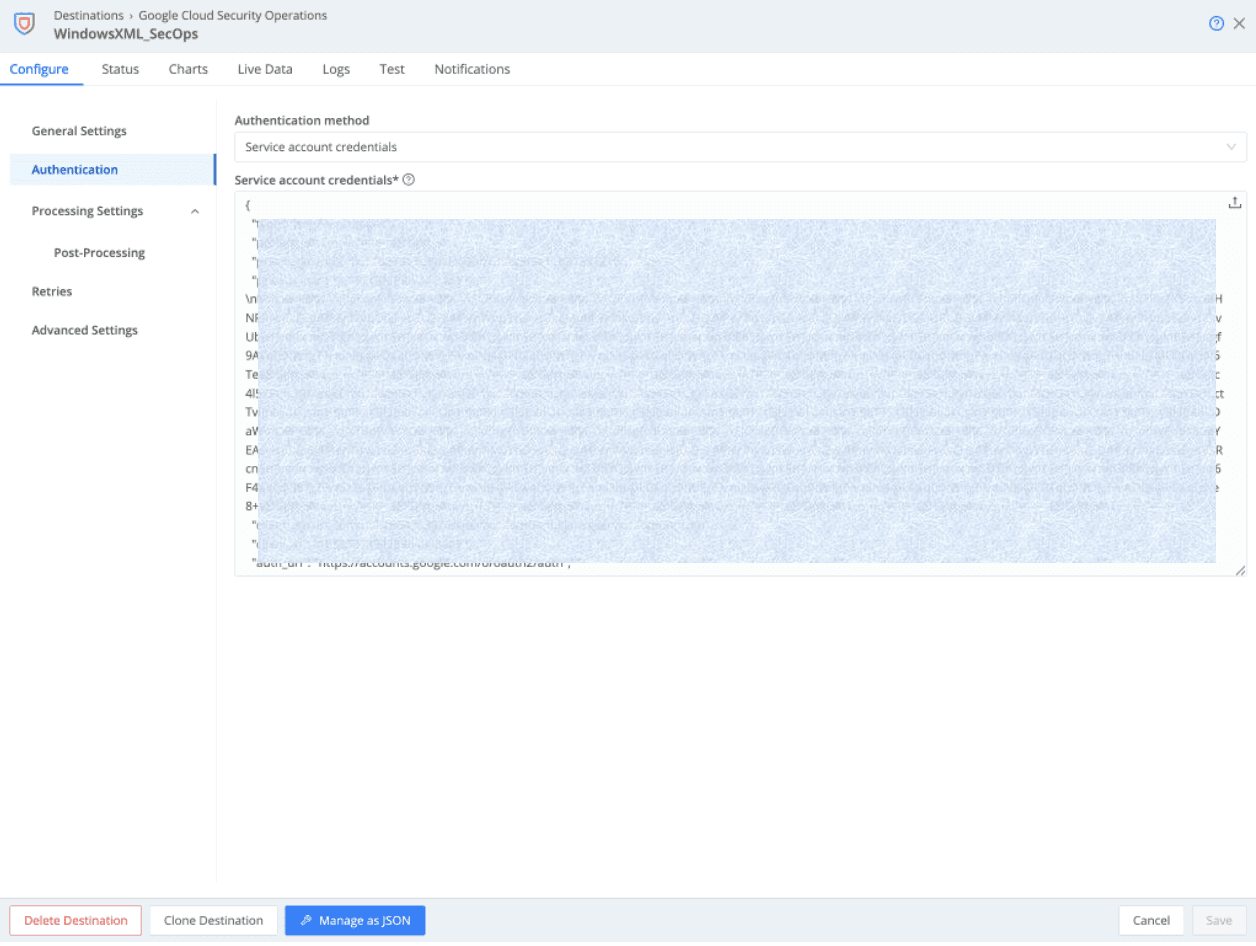
The following settings are under Authentication on the sidebar:
Authentication method:
When the API version is set to V2 in General Settings, your only option here is Service account credentials (or a secret that references the Service account credentials if you created one in Cribl Stream).
Service account credentials:
This field requires the content of the service account (JSON keys) credentials file, which can be downloaded from SecOps under Settings > Collection Agents, labeled INGESTION AUTHENTICATION FILE.
To summarize all of this and show you what the configuration looks like, here’s an image of my configuration. The blurred-out bits are none of your business. 😉
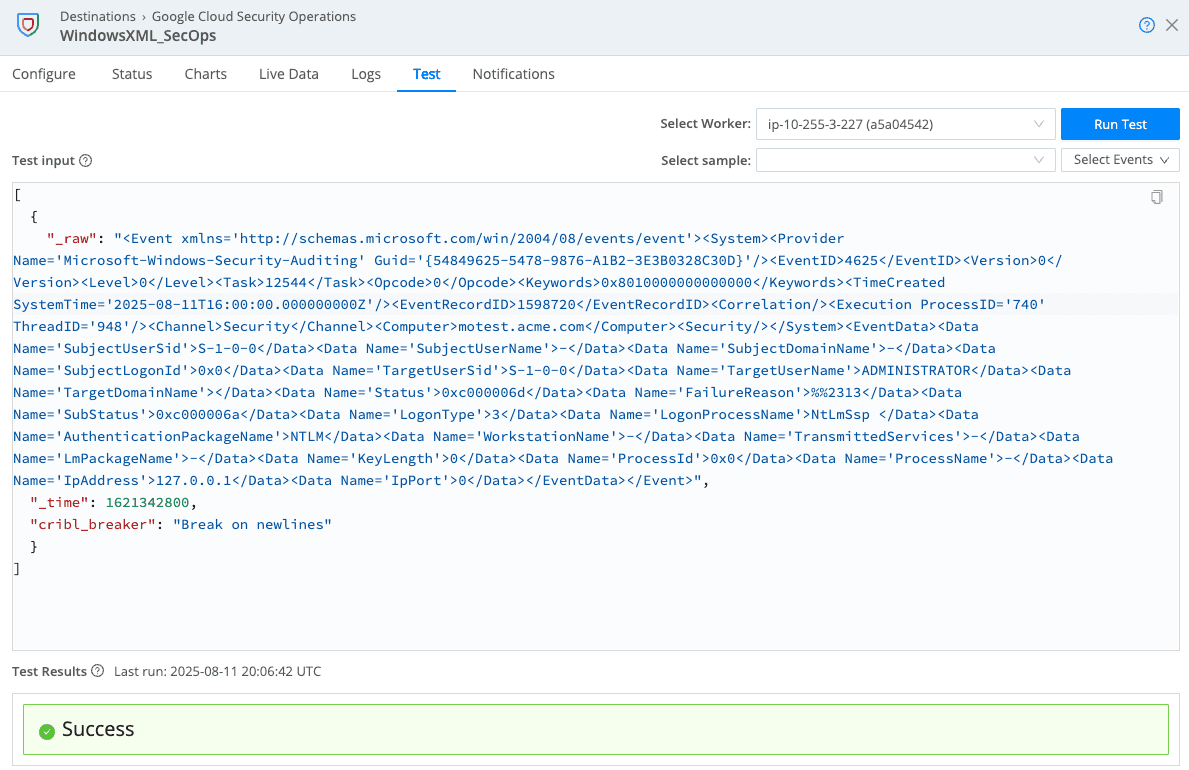
Once your Destination is configured, it’s a good idea to test it by sending a sample event to SecOps. You can do this by navigating to the “Test” tab in your Destination and paste a sample in the _raw field in the “Test input” window (see example below). Click “Run Test,” and you should see “Success” in the “Test Results” at the bottom of the modal. One thing to keep in mind when using a sample log is to update any timestamps so that you can find the data easily in SecOps.
The Pipeline
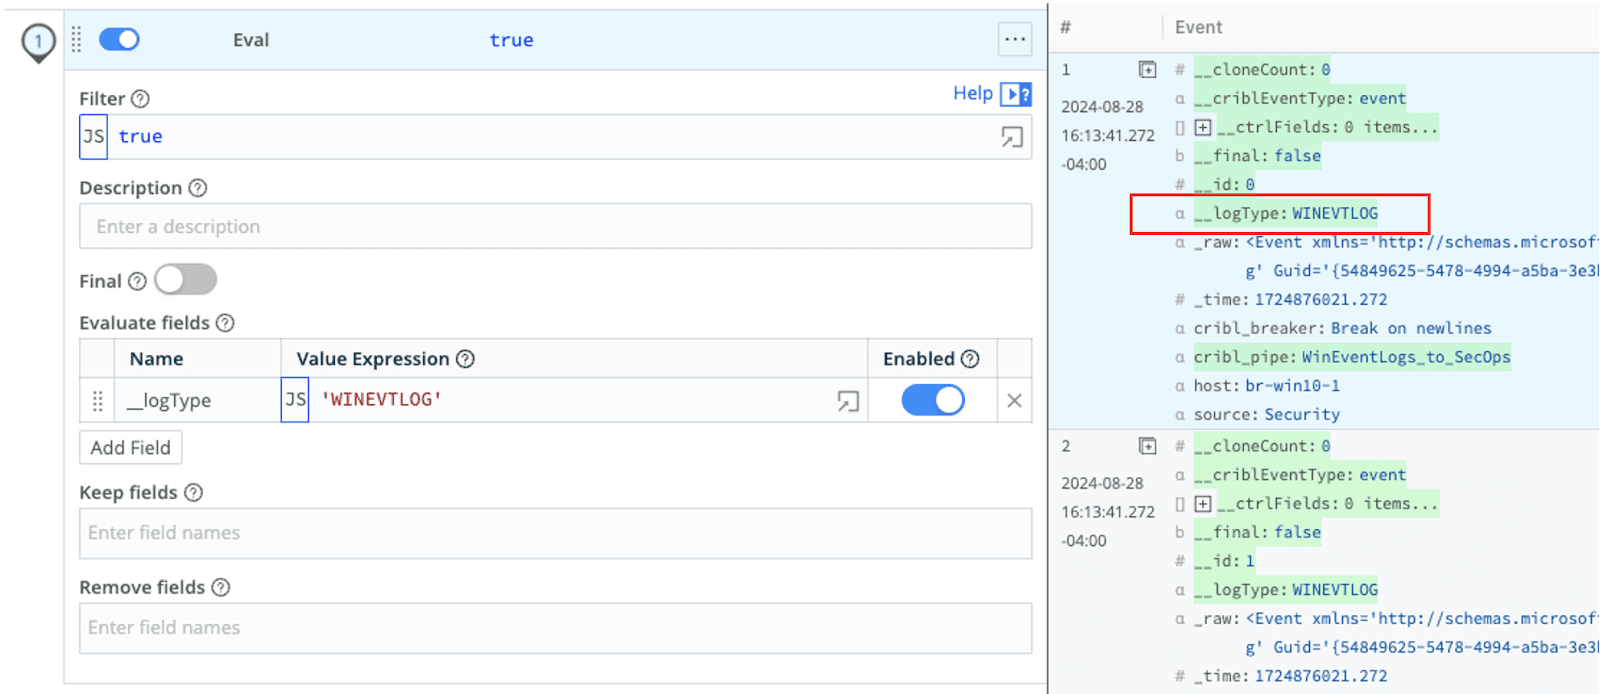
Since our Destination is set up for Windows Event Logs and we don’t plan on doing any optimization in this exercise, we could just use the Passthru pipeline in Stream. However, I’ll briefly discuss, at a minimum, setting __logType in a pipeline so you understand the approach where there is a single Destination and the parser is determined in the pipeline.
The Default log type setting determines the parser used in Google SecOps, unless the __logType field exists, in which case the value of that field will override what is in the Default log type setting.
To set the Default log type within a pipeline, simply add an Eval function and add the field under Evaluate fields. For our example, we’ll set __logType equal to WINEVTLOG, which maps to the appropriate parser for Windows Event Logs in Google SecOps.
The Route
At this point, we’ve created our Source and Destination, tested the Destination, and created a pipeline (if you are using one). Now, let’s route some data to Google SecOps, starting by sending logs directly from Edge to SecOps.
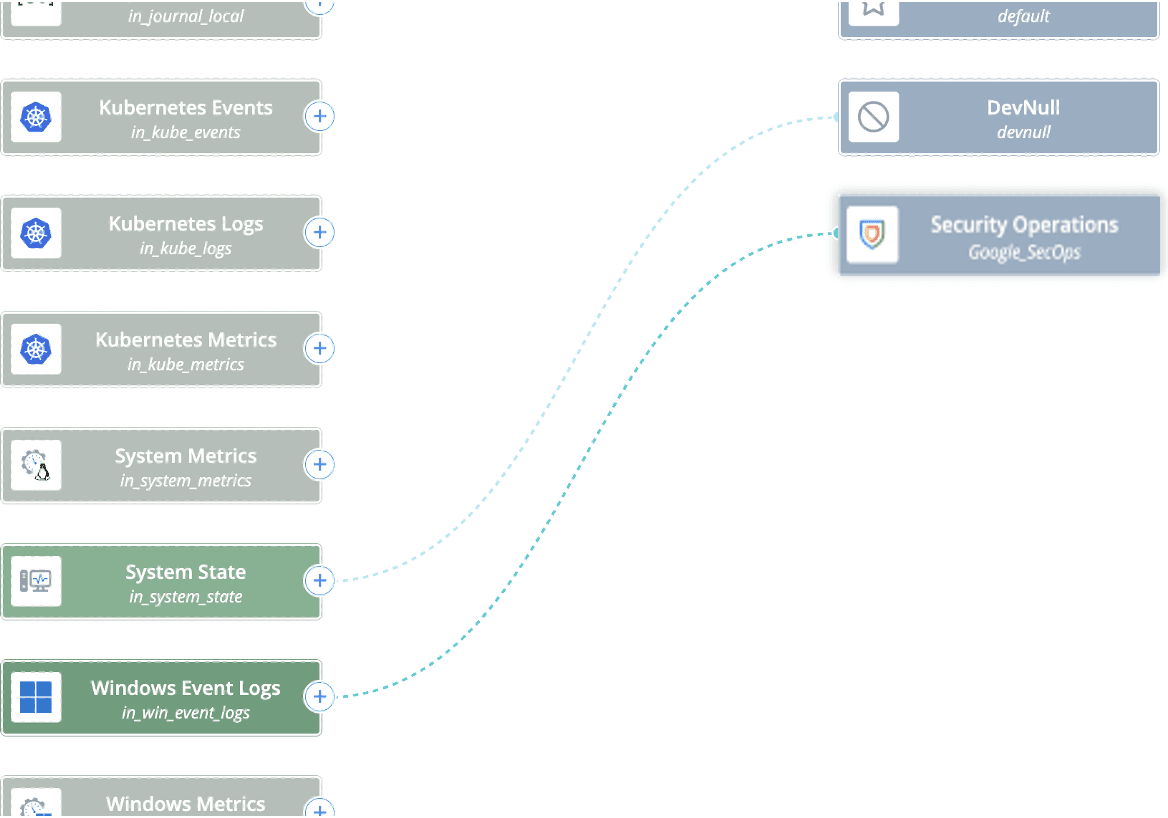
In Edge, navigate to the appropriate Fleet, and click Collect. This brings you to the QuickConnect interface, a simple, visual way to route data to one or more Destinations. While it allows you to utilize pipelines or packs, it doesn’t let you granularly filter on a subset of a Source. If you need to filter on a subset of the data coming into a Source, you need to navigate to More > Data Routes. For this blog, we’ll keep it simple and use QuickConnect.
In the QuickConnect interface, you may need to add your Source and Destination if they aren’t already listed. You can do this by clicking the Add Source or Add Destination buttons, then selecting the Source or Destination tile and clicking Select Existing.
Once you see your Windows Event Logs Source and Security Operations Destination, click and hold on the + on the right side of the Source and drag it to the Destination. This prompts you to configure the connection, allowing you to choose a Pipeline, Pack, or to send the data via Passthru. We will be using Passthru for this exercise. Your connection should now look like the image below.
If you plan to send data from Edge to a Stream Worker Group, then to Google SecOps, you’ll need to enable a Cribl_HTTP Source in the Worker Group you’ll be sending to. In Edge, configure a Cribl_HTTP Destination pointing to the Worker Nodes and Port where your Cribl HTTP Source is configured (if it is an on-prem Worker Group). If you are sending from Edge to a Cribl.Cloud Worker Group, configure the Destination with the FQDN and Port for your Cribl.Cloud Organization. Once both the Source and Destination are configured, use QuickConnect to make the connections as shown in the images below.
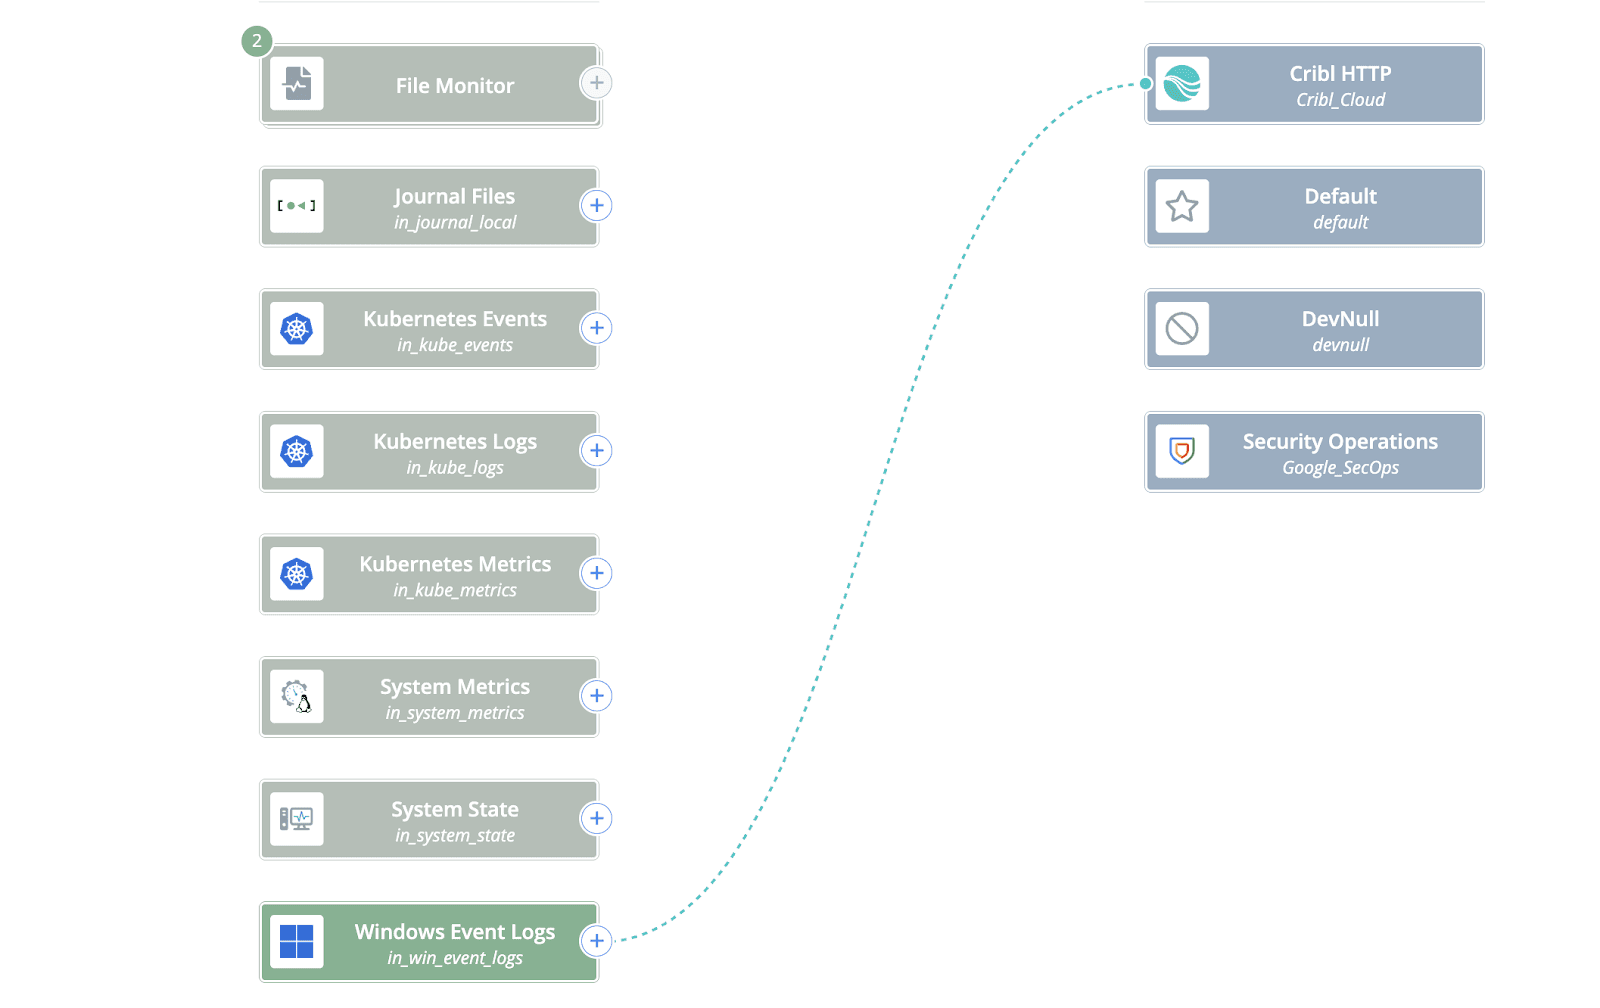
Edge to Stream Worker Group connection
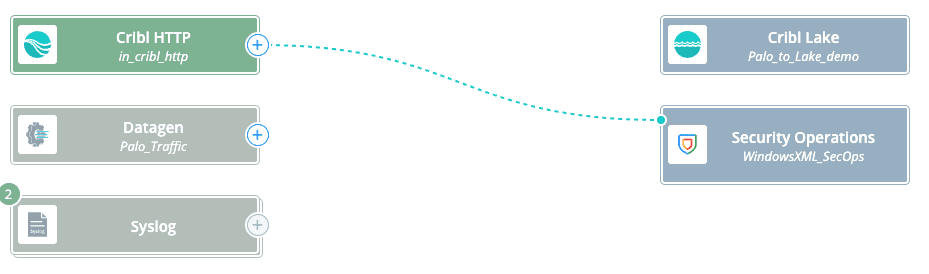
Stream to SecOps Connection
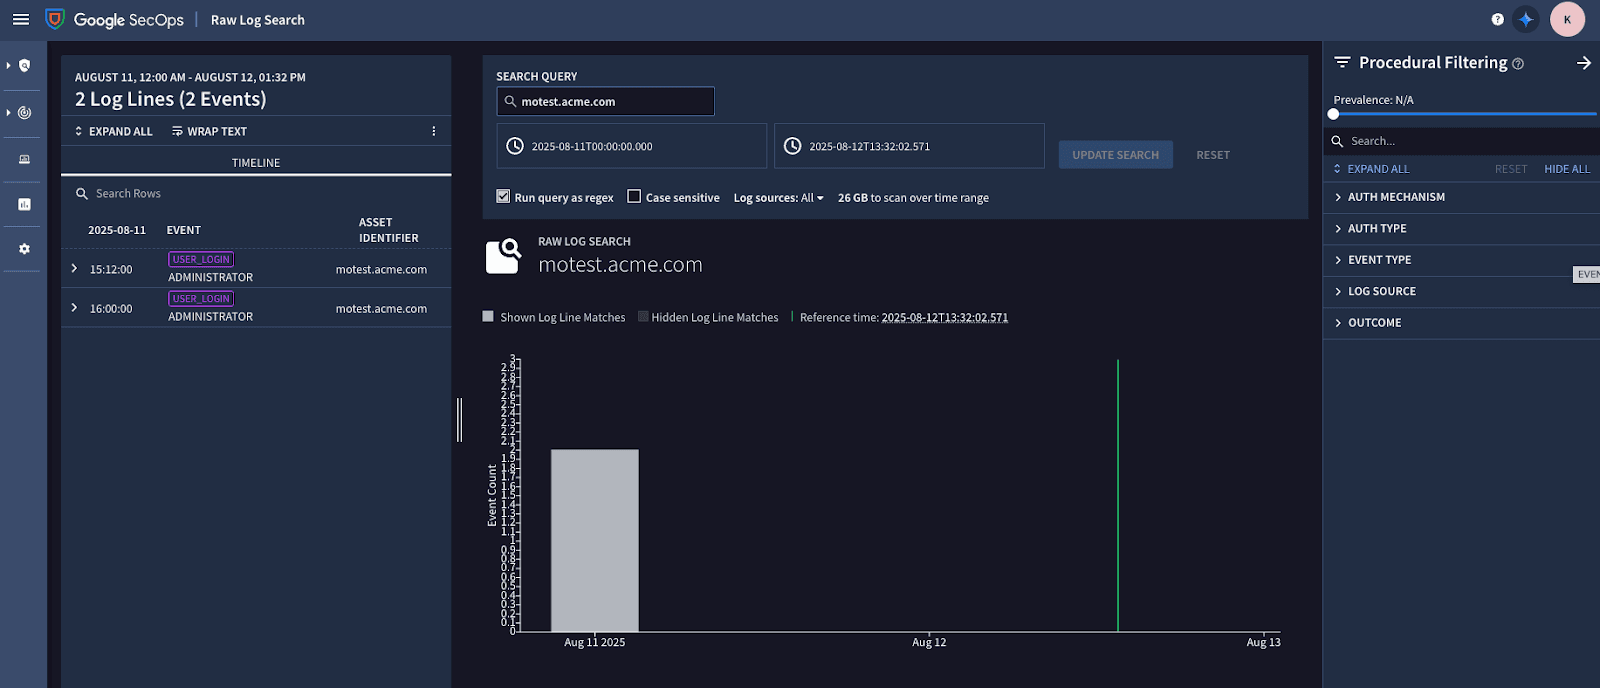
Checking Your Work
That’s it! The final step is to go to Google SecOps and search for your data. It’s always a good practice to identify something unique in your data to make it easy to find, like a hostname or an IP address. This is also helpful when you are testing the Destination with a sample.
Wrap Up
By leveraging Cribl Edge and Cribl Stream with Google SecOps, you gain unparalleled control, flexibility, and efficiency over your Windows Event data. Whether sending logs directly or routing them through Stream for advanced processing, Cribl empowers your security operations team to ingest, transform, and deliver the most relevant data, ultimately leading to faster threat detection and significant cost savings.
If you are interested in learning more about Cribl’s solutions, check out some of the resources below: