

If you’re running AI, ML, or data-intensive workloads on GPUs, monitoring their performance is critical. Overheating, under-utilization, or memory bottlenecks can cost you thousands in cloud bills and potential downtime.
This guide walks you through collecting real-time GPU telemetry using nvidia-smi, sending it to Cribl Edge, routing it through Cribl Stream, and using Cribl Search to analyze the data—step by step.
Why GPU Monitoring Matters
GPUs power AI inference, deep learning training, and high-performance data pipelines. Without visibility into:
GPU utilization
Temperature
Memory usage
Power draw
you risk inefficiencies, high costs, and unexpected failures.
Cribl Edge + Stream provides a flexible observability platform to capture and route this data easily.
Step 1: Spin Up an NVIDIA GPU Instance
For this tutorial:
AWS instance:
g5.xlarge(with NVIDIA A10G 24 GB GPU)AMI: Deep Learning Base OSS Nvidia Driver GPU AMI (Amazon Linux 2023)
AMI ID:
ami-00b530caaf8eee2c5(as of July 2025)
After launching your instance:
Connect via SSH from your terminal OR use the AWS Console's EC2 Instance Connect (browser-based shell).
Step 2: Install Cribl Edge
In your Cribl Cloud org, navigate to Edge → Add a Node. Copy the provided installation command. It should look similar to this:
curl
'https://your-org.cribl.cloud/init/install-edge.sh?group=default_fleet&token=xXxXx&user=cribl&user_group=cribl&install_dir=%2Fopt%2Fcribl' |
bash -
Run this in your GPU instance shell (either via SSH or AWS Console). Once installed, confirm that the node appears in Edge Leader → default_fleet.
Step 3: Capture GPU Metrics with Exec Source
In your Cribl Edge UI:
Navigate to Fleets → default_fleet → Collect.
Add a new Source of type Exec.
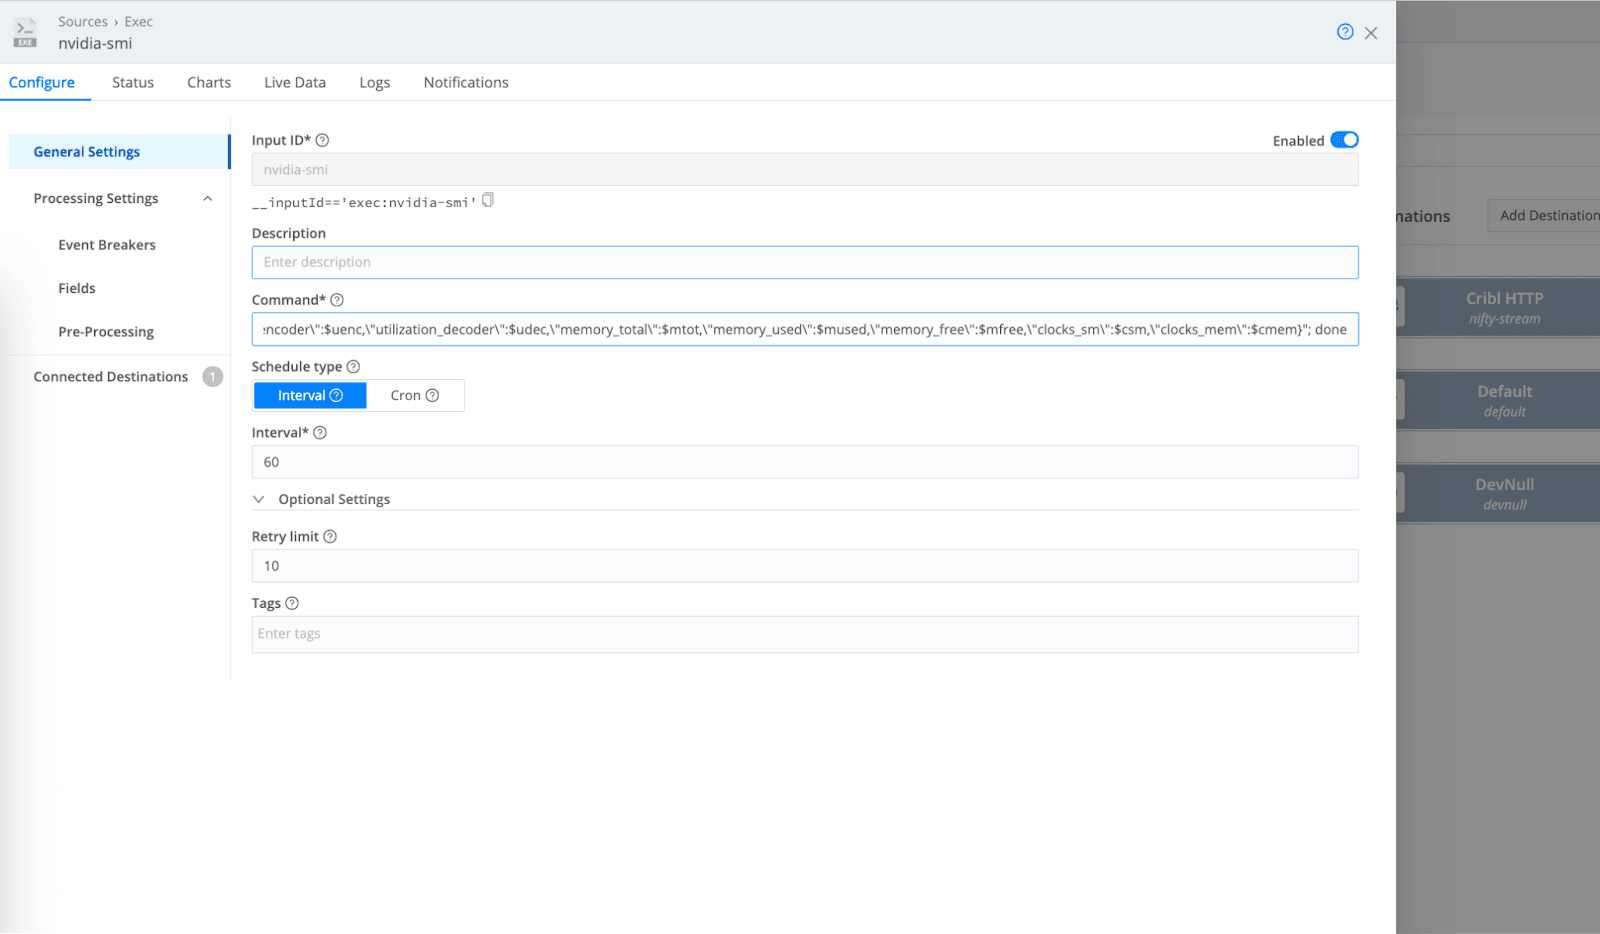
Use this command in the Command field:
nvidia-smi \
  --query-gpu=timestamp,index,name,uuid,driver_version,pci.bus_id,persistence_mode,power.draw,power.limit,temperature.gpu,fan.speed,utilization.gpu,utilization.memory,utilization.encoder,utilization.decoder,memory.total,memory.used,memory.free,clocks.sm,clocks.mem \
  --format=csv,noheader,nounits | \
while IFS=, read -r ts idx name uuid drv pci persist pdraw plimit temp fan ugpu umem uenc udec mtot mused mfree csm cmem; do
  iso_ts=$(date -d "$ts" --utc +%Y-%m-%dT%H:%M:%SZ)
  echo "{
    \"timestamp\":\"$iso_ts\",
    \"index\":$idx,
    \"name\":\"$name\",
    \"uuid\":\"$uuid\",
    \"driver_version\":\"$drv\",
    \"pci_bus_id\":\"$pci\",
    \"persistence_mode\":\"$persist\",
    \"power_draw\":$pdraw,
    \"power_limit\":$plimit,
    \"temperature_gpu\":$temp,
    \"fan_speed\":$fan,
    \"utilization_gpu\":$ugpu,
    \"utilization_memory\":$umem,
    \"utilization_encoder\":$uenc,
    \"utilization_decoder\":$udec,
    \"memory_total\":$mtot,
    \"memory_used\":$mused,
    \"memory_free\":$mfree,
    \"clocks_sm\":$csm,
    \"clocks_mem\":$cmem
  }"
done
What This Command Does
Runs
nvidia-smito pull GPU stats.Converts the timestamp to ISO 8601 UTC.
Outputs data as JSON for easy ingestion into Cribl.
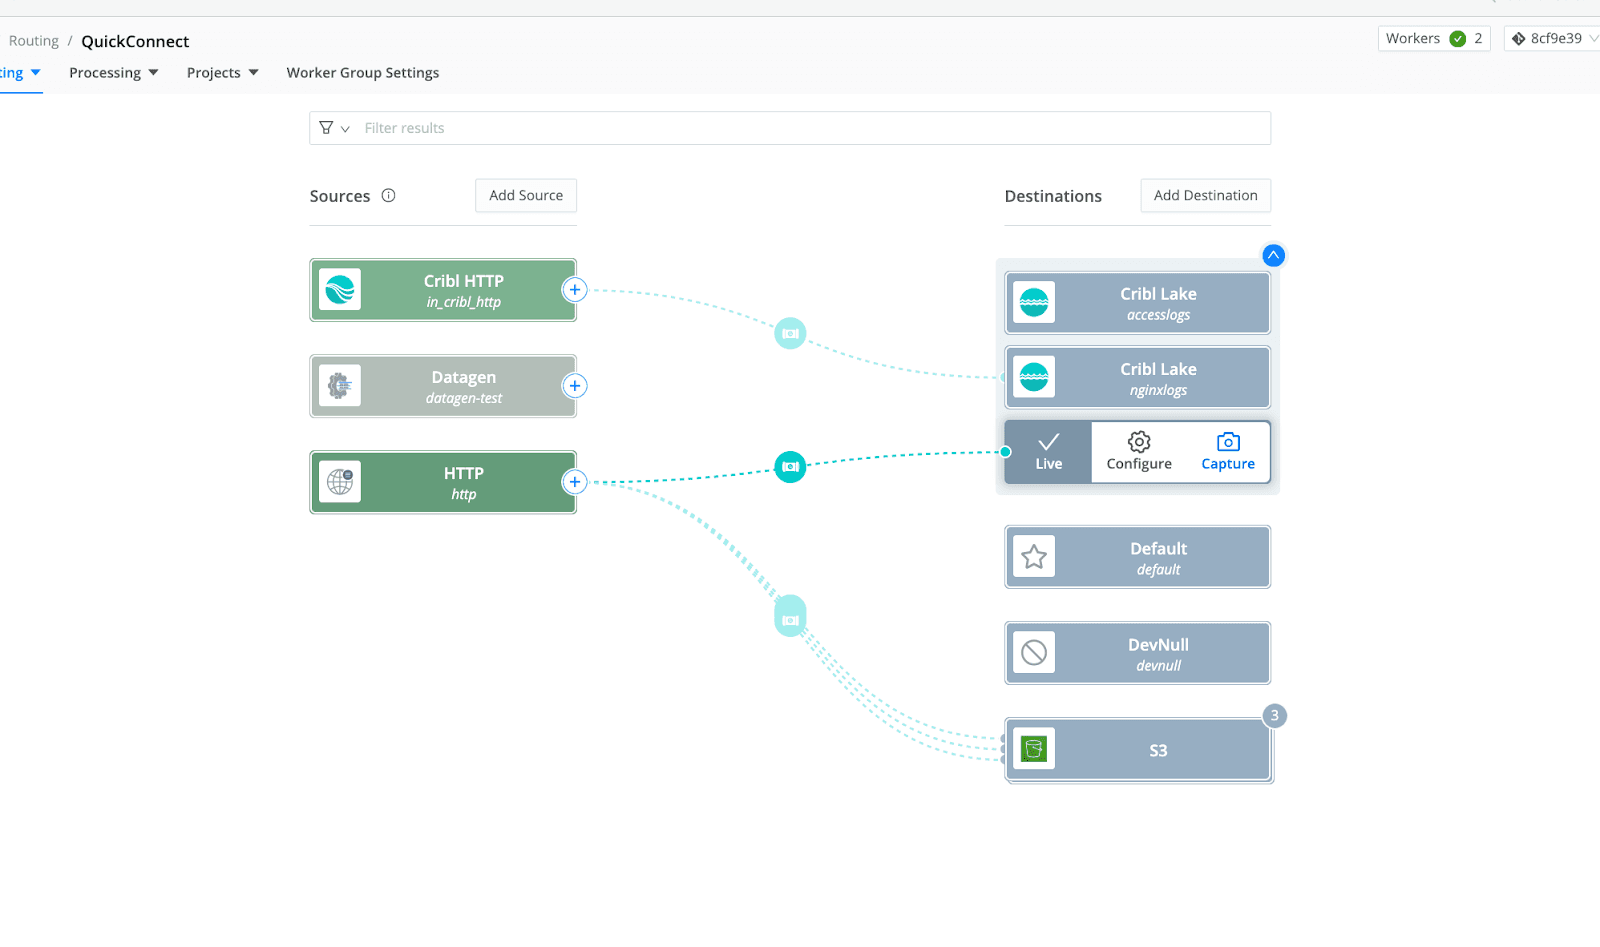
Step 4: Send Data to Cribl Stream and Lake
Connect your Exec Source to an HTTP destination that sends logs to port
10020on the Cribl Stream service.
Route this data to Cribl Lake for historical storage and easy searching.
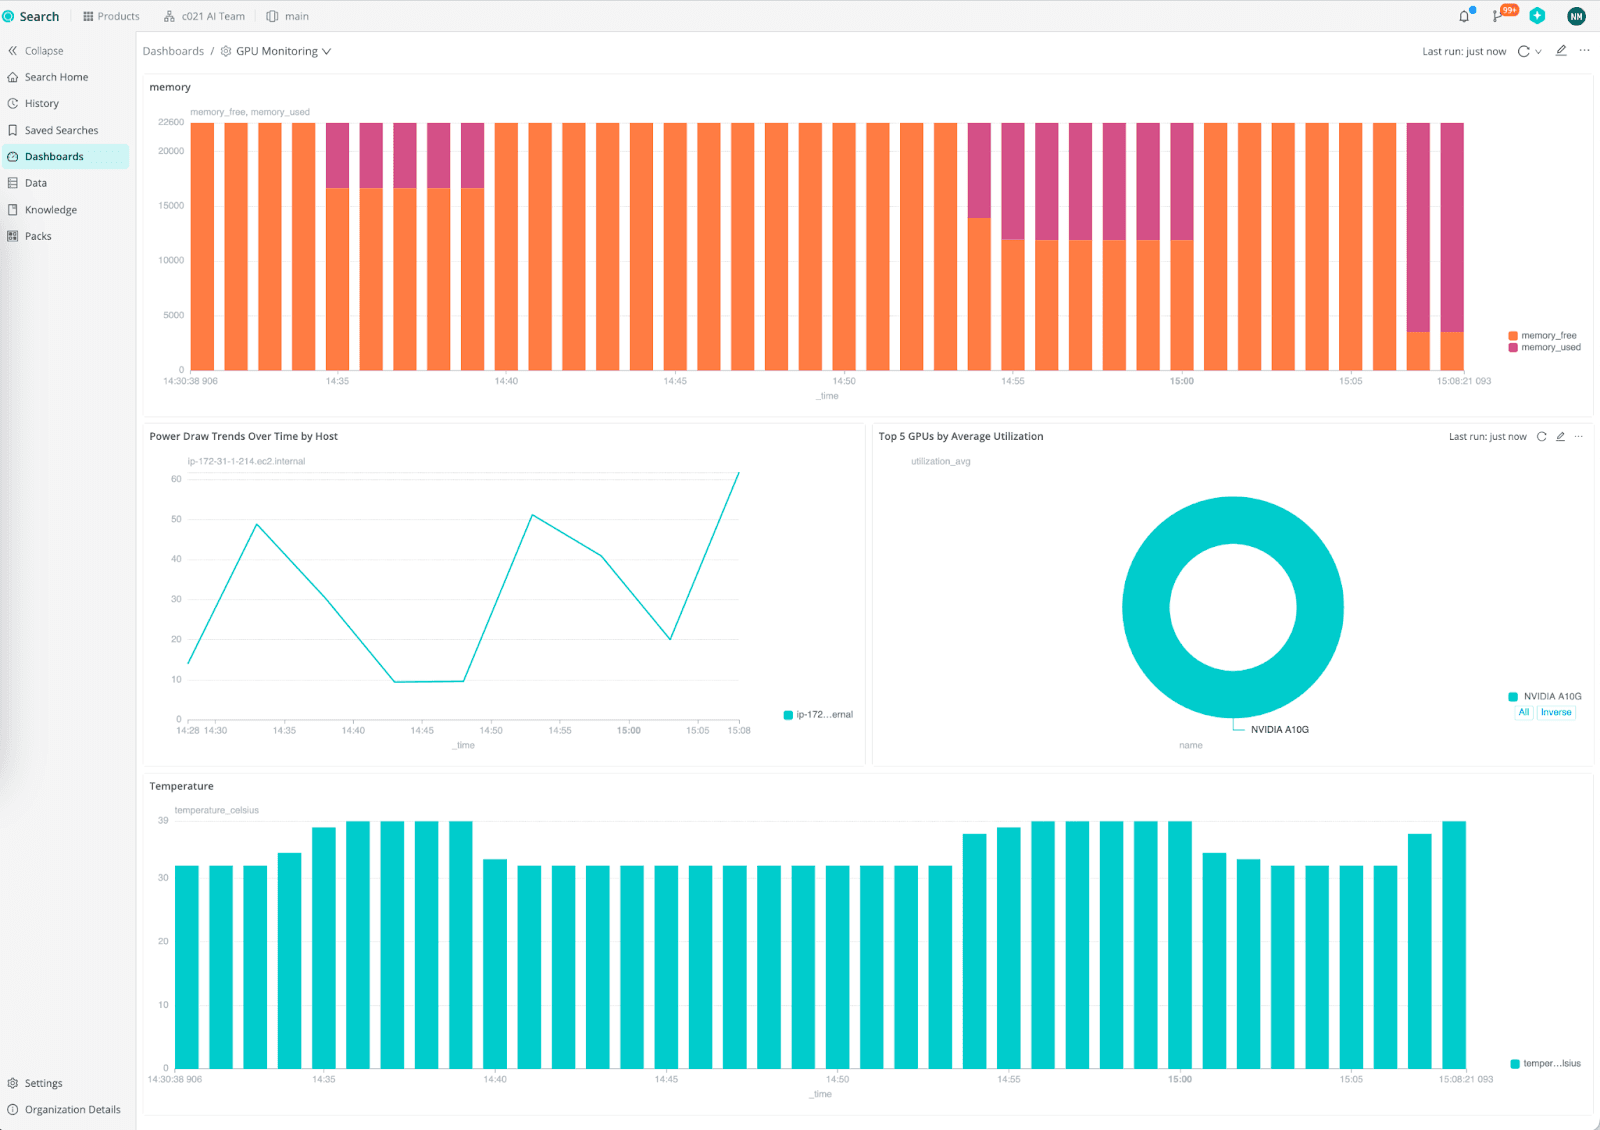
Step 5: Analyze and Visualize Metrics
Go to Cribl Search in your Cloud org. You can query GPU metrics like:
temperature_gpu(for overheating trends)power_drawvspower_limitmemory_usedandmemory_freeutilization_gpufor load analysis

From here, you can:
Build dashboards in your preferred tool.
Create alerts when temperatures exceed thresholds.
Final Thoughts
With Cribl Edge and Stream, you get:
✅ Real-time GPU observability
✅ Flexible routing & enrichment
✅ No vendor lock-in
Ready to monitor and optimize your NVIDIA GPUs?
👉 Sign up for Cribl Cloud and start today!
Or download the GitHub gist Here!