

Telemetry is only useful if you can trust it. Logs, events, and metrics need to arrive on time, in the right shape, and at the right volume—or downstream tools, investigations, and automations quickly fall apart.
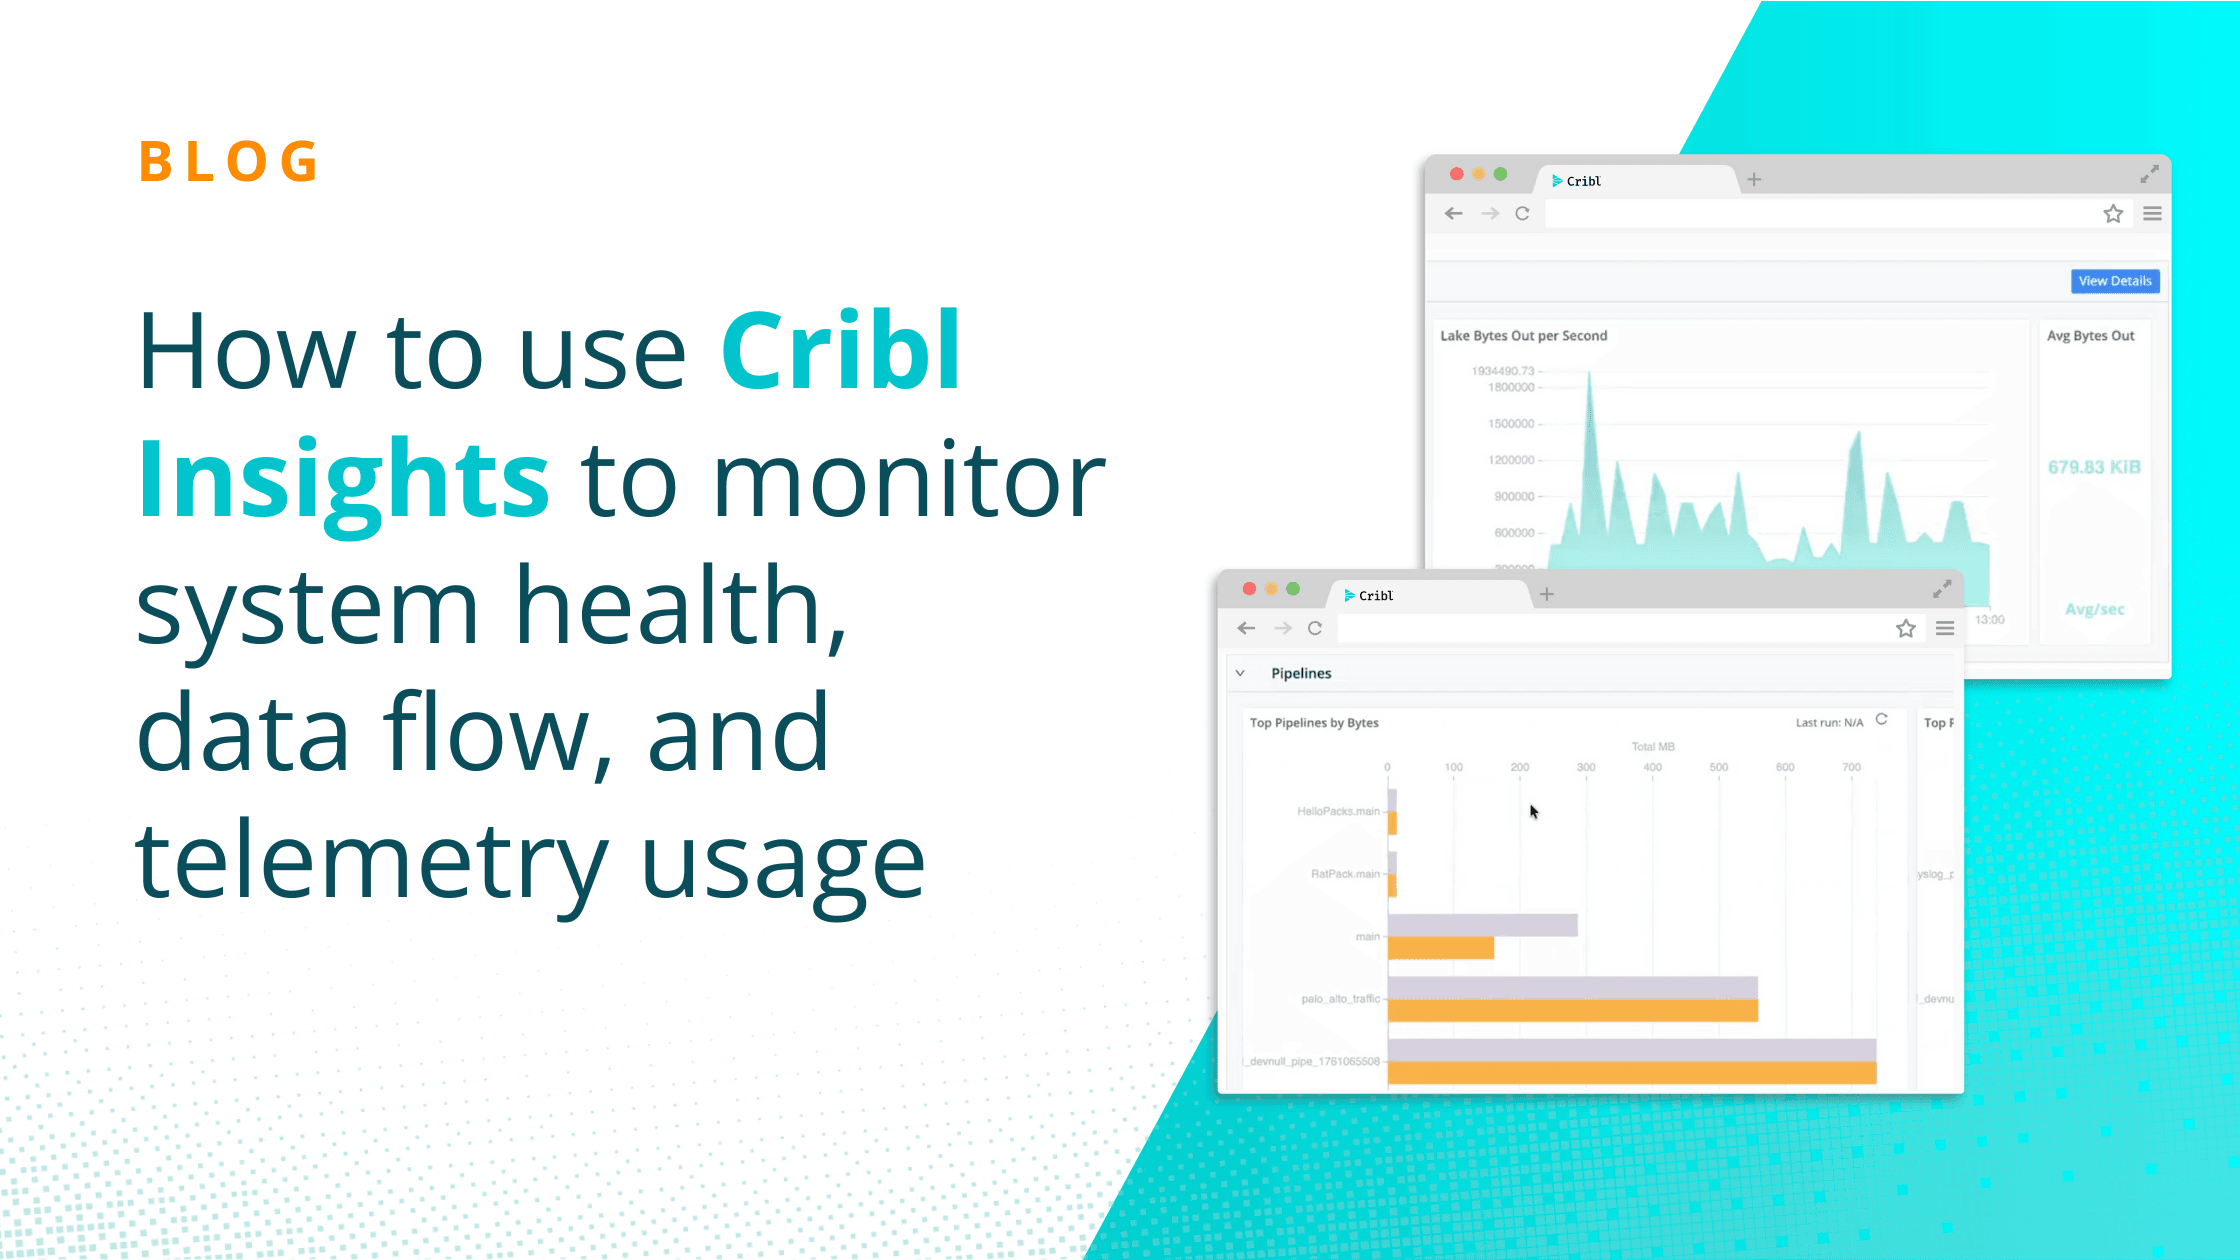
Cribl Insights gives IT and Security teams a centralized view into what’s happening across their entire Cribl environment. Instead of piecing together metrics, logs, and alerts from multiple tools, Insights brings system health, data flow visibility, and out-of-the-box alerting into a single operational view—built for environments that are increasingly automated and agent-driven.
This blog walks through what specifically is available with System Insights, Data Insights, and built-in Alerting so teams can stay ahead of issues before data slows, changes, or stops. If you don’t feel like reading everything, here’s a demo video that captures a lot of what this blog covers:
System Insights: Monitoring the Health of Your Cribl Environment
System Insights focuses on the operational health and performance of your Cribl products and infrastructure. This is where teams go to answer questions like: Is the system healthy? Are workers keeping up? Where is capacity being used?
Stream System Insights
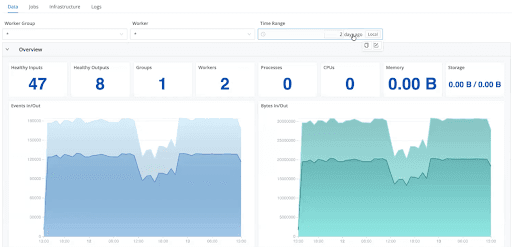
For Cribl Stream, System Insights provide deep, worker-level visibility into pipeline behavior:
Worker group and individual worker monitoring to quickly isolate performance issues
Throughput and health metrics, including events and bytes in/out, queue activity, dropped events, and processing errors
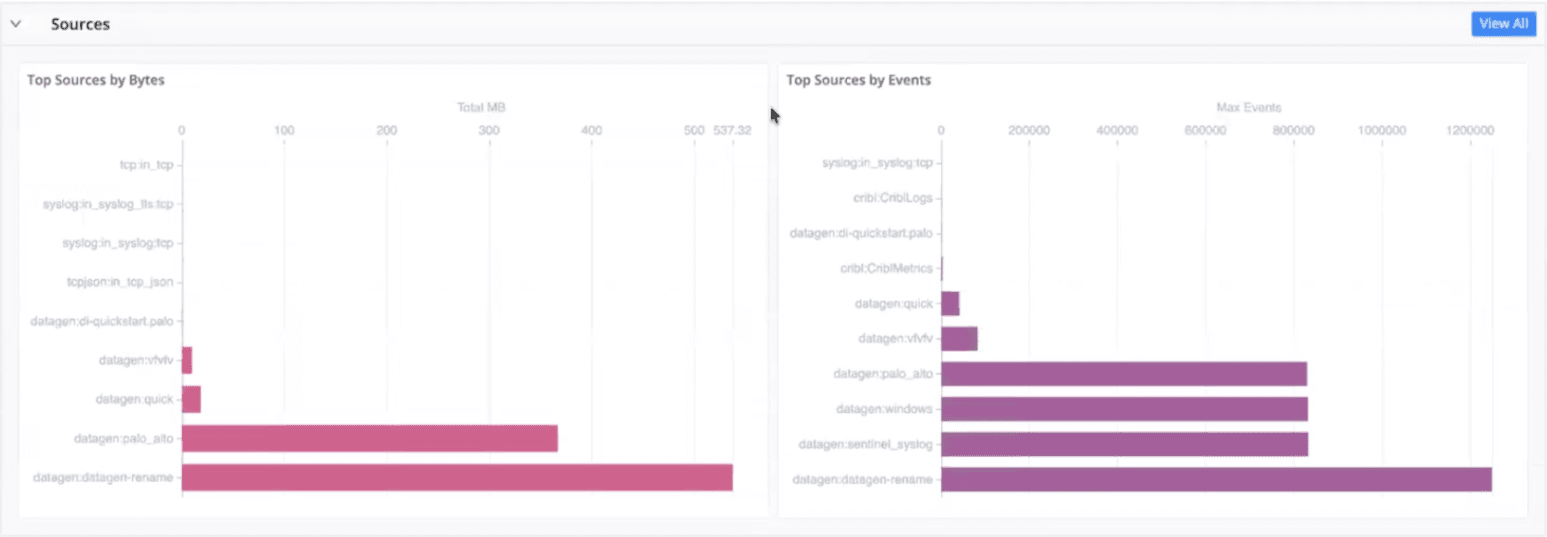
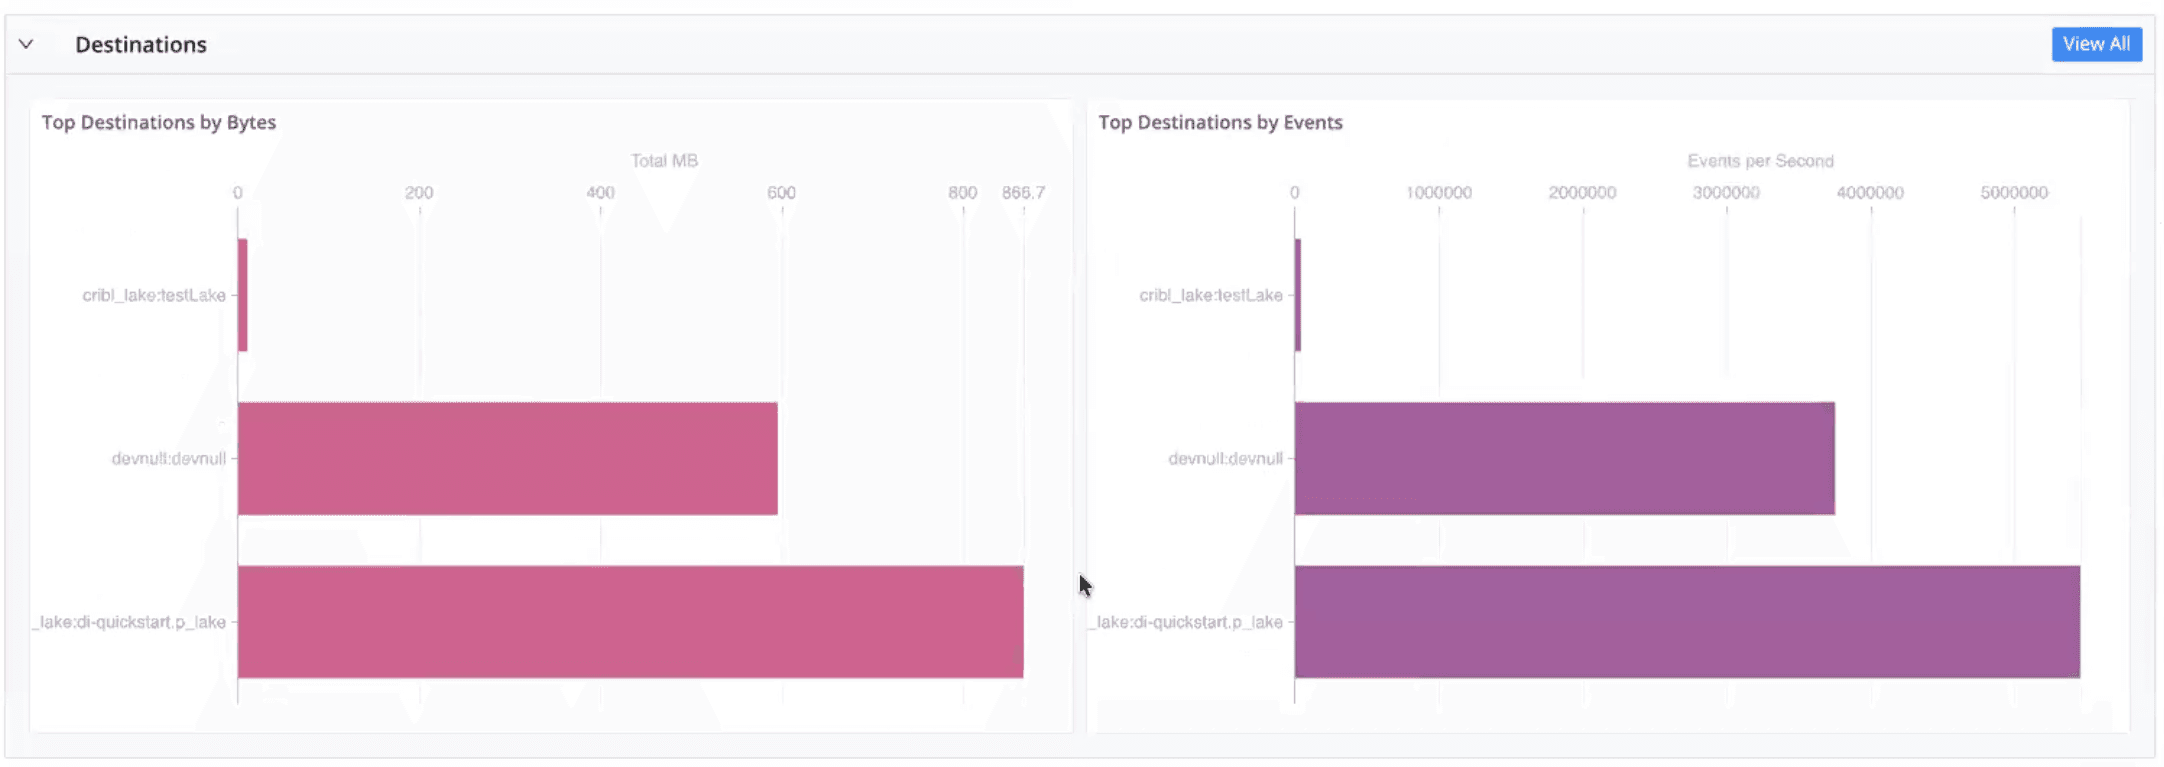
Sources, destinations, Packs, and routes visibility to identify top data producers and consumers driving bandwidth and cost
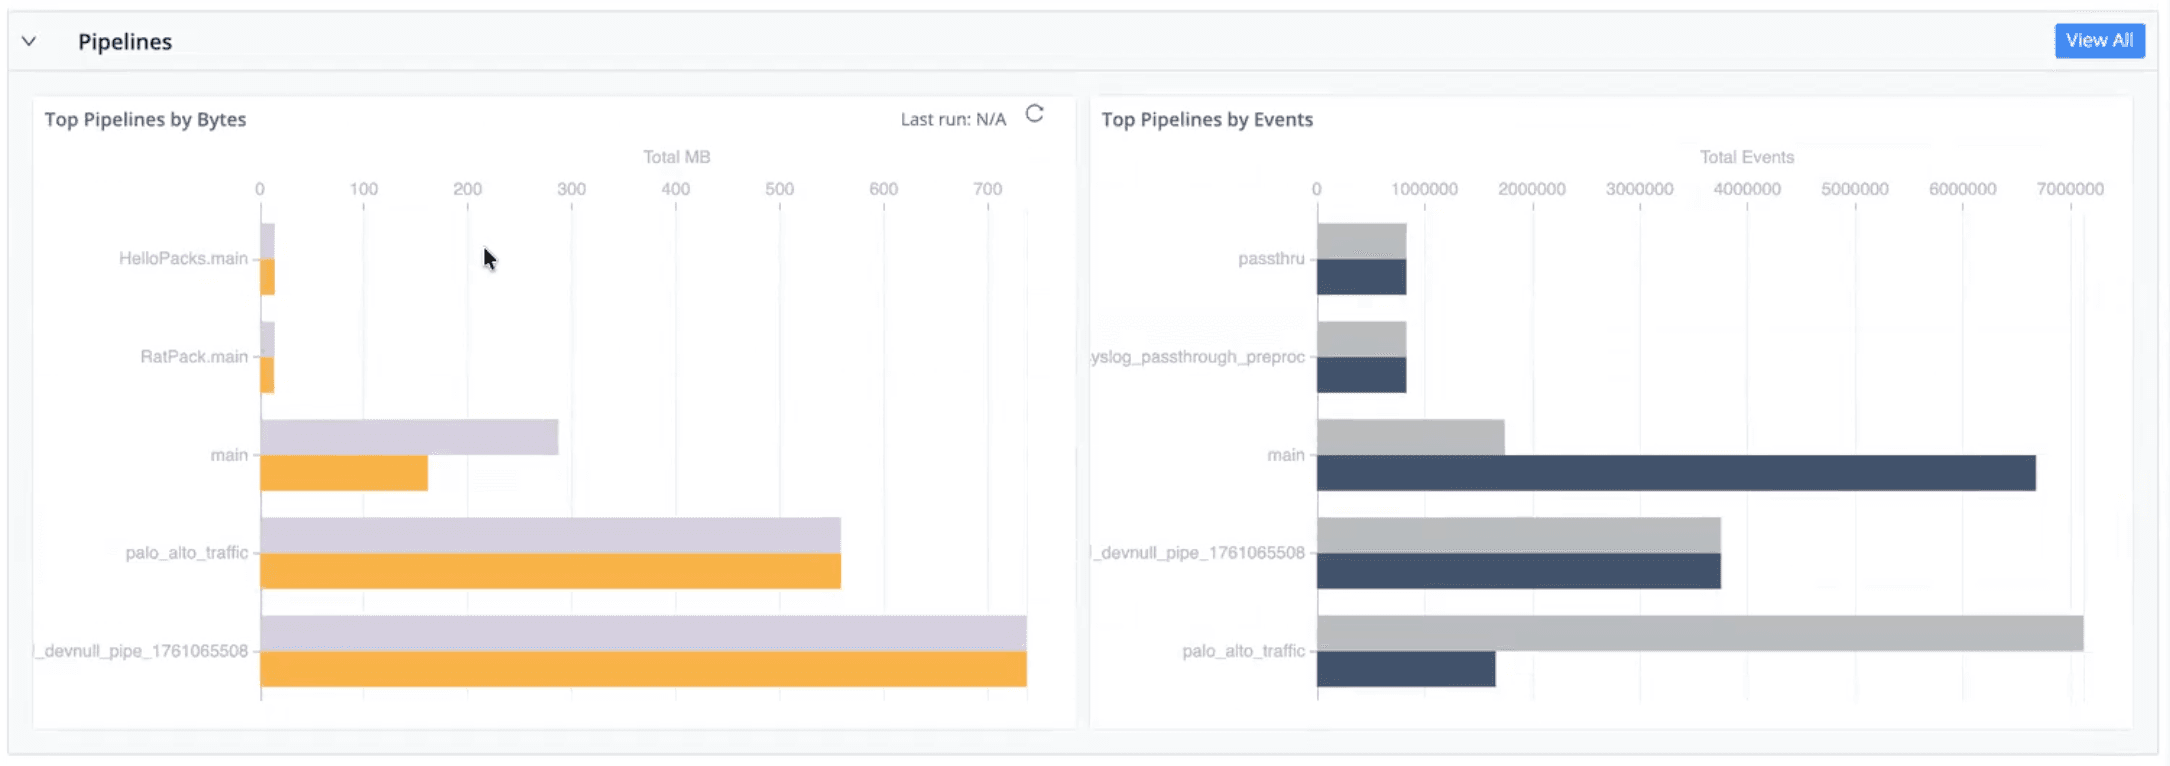
Pipeline, routing, and pack insights to understand which components contribute most to volume and throughput
Job execution tracking to see scheduled and running jobs and their operational impact
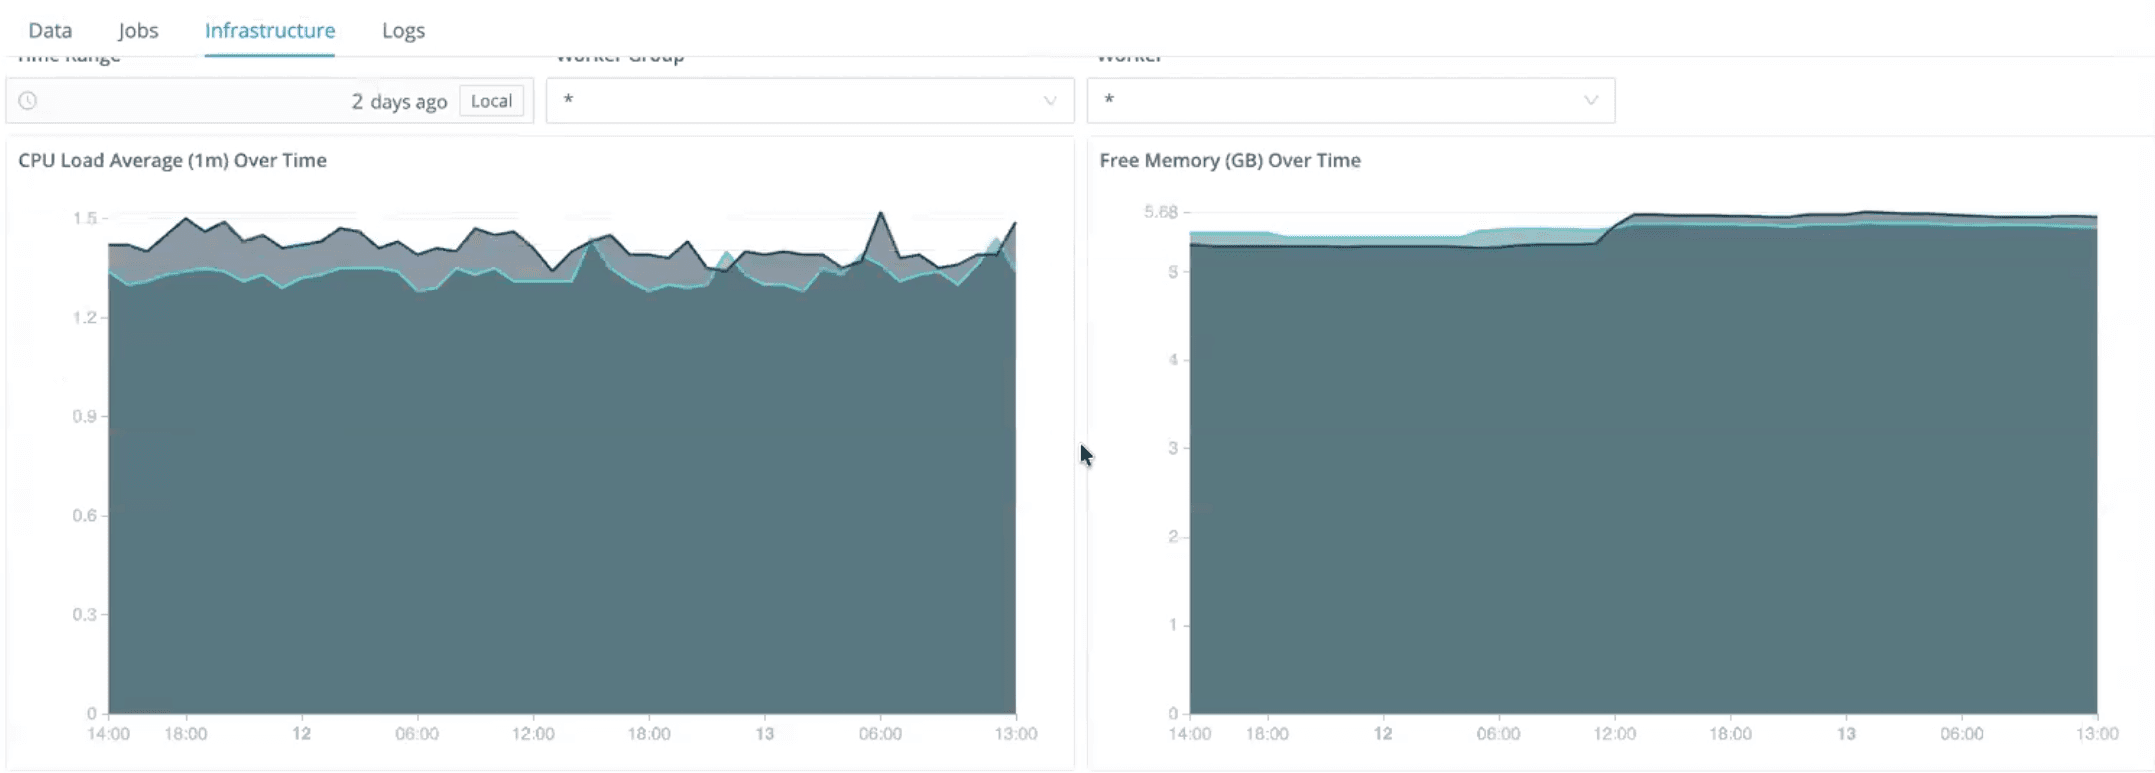
Infrastructure metrics such as CPU load, memory usage, storage utilization, and worker distribution for SRE-style troubleshooting
Log-level access for filtering and inspecting logs by time range to accelerate root cause analysis
This makes it easier to detect pipeline bottlenecks, overloaded workers, or misbehaving routes before they affect downstream systems.
Edge System Insights
For Cribl Edge environments, System Insights focus on fleet-wide and node-level visibility:
Events per second and bytes per second to track ingestion rate in real time
Top sources and destinations by volume to understand usage patterns
Top packs and pipelines driving the most processing
Fleet and node visibility to quickly assess scale, health, and distribution
Routing and pipeline views to visualize how data moves end to end
This is especially valuable for IT teams managing distributed agents at scale, where issues often surface first as subtle volume or routing changes.
Search and Lake System Insights
Cribl Insights also covers search and storage usage:
Search
Query volume and frequency
End-to-end search latency and responsiveness
I/O rates, throughput, and queue size
Overall search health and stability
Billable CPU hours for cost awareness
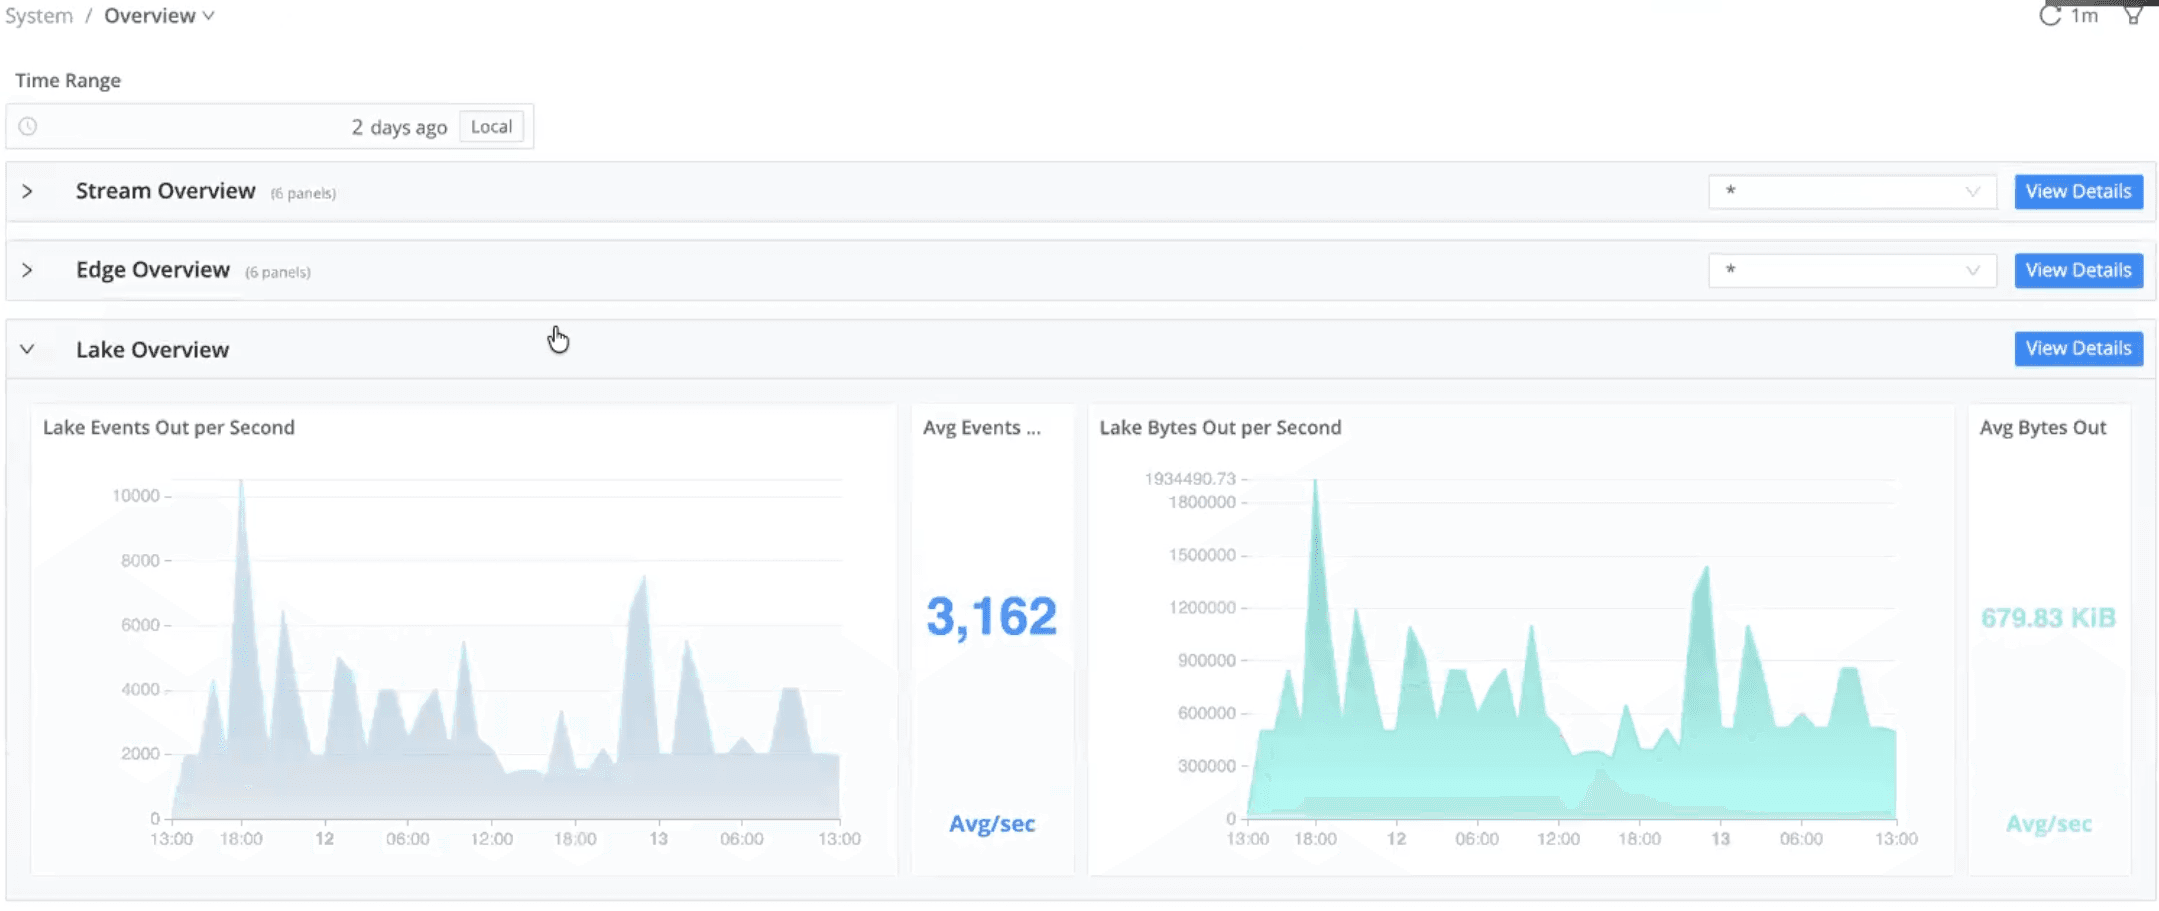
Lake
Storage utilization per day
Historical storage trends
Visibility into cost drivers to support retention and optimization decisions
Together, these views help IT teams balance performance, responsiveness, and cost as usage grows.
Data Insights: Understanding How Telemetry Flows End to End
While System Insights focus on how the system is behaving, Data Insights focus on what’s happening to the data itself.
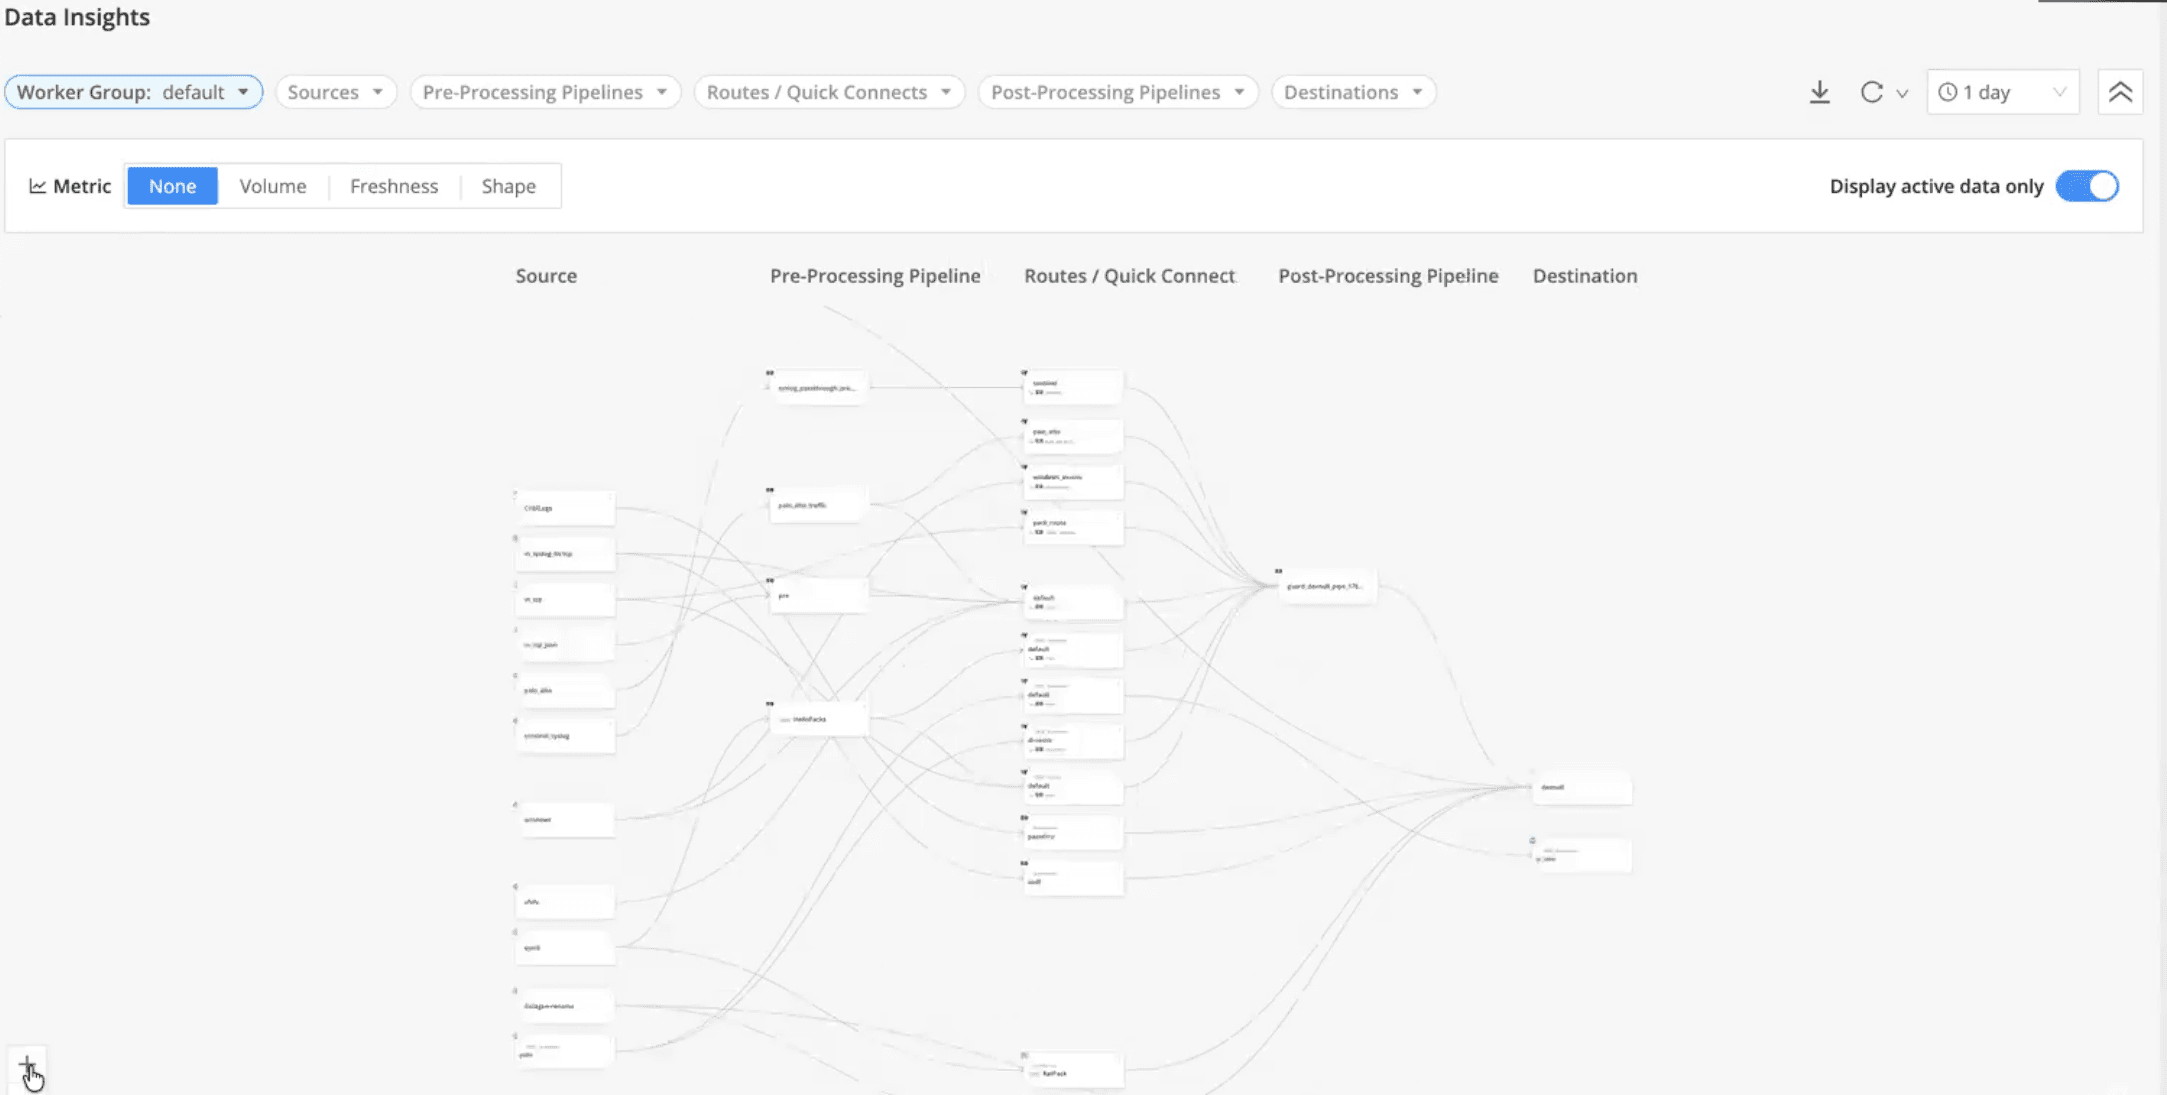
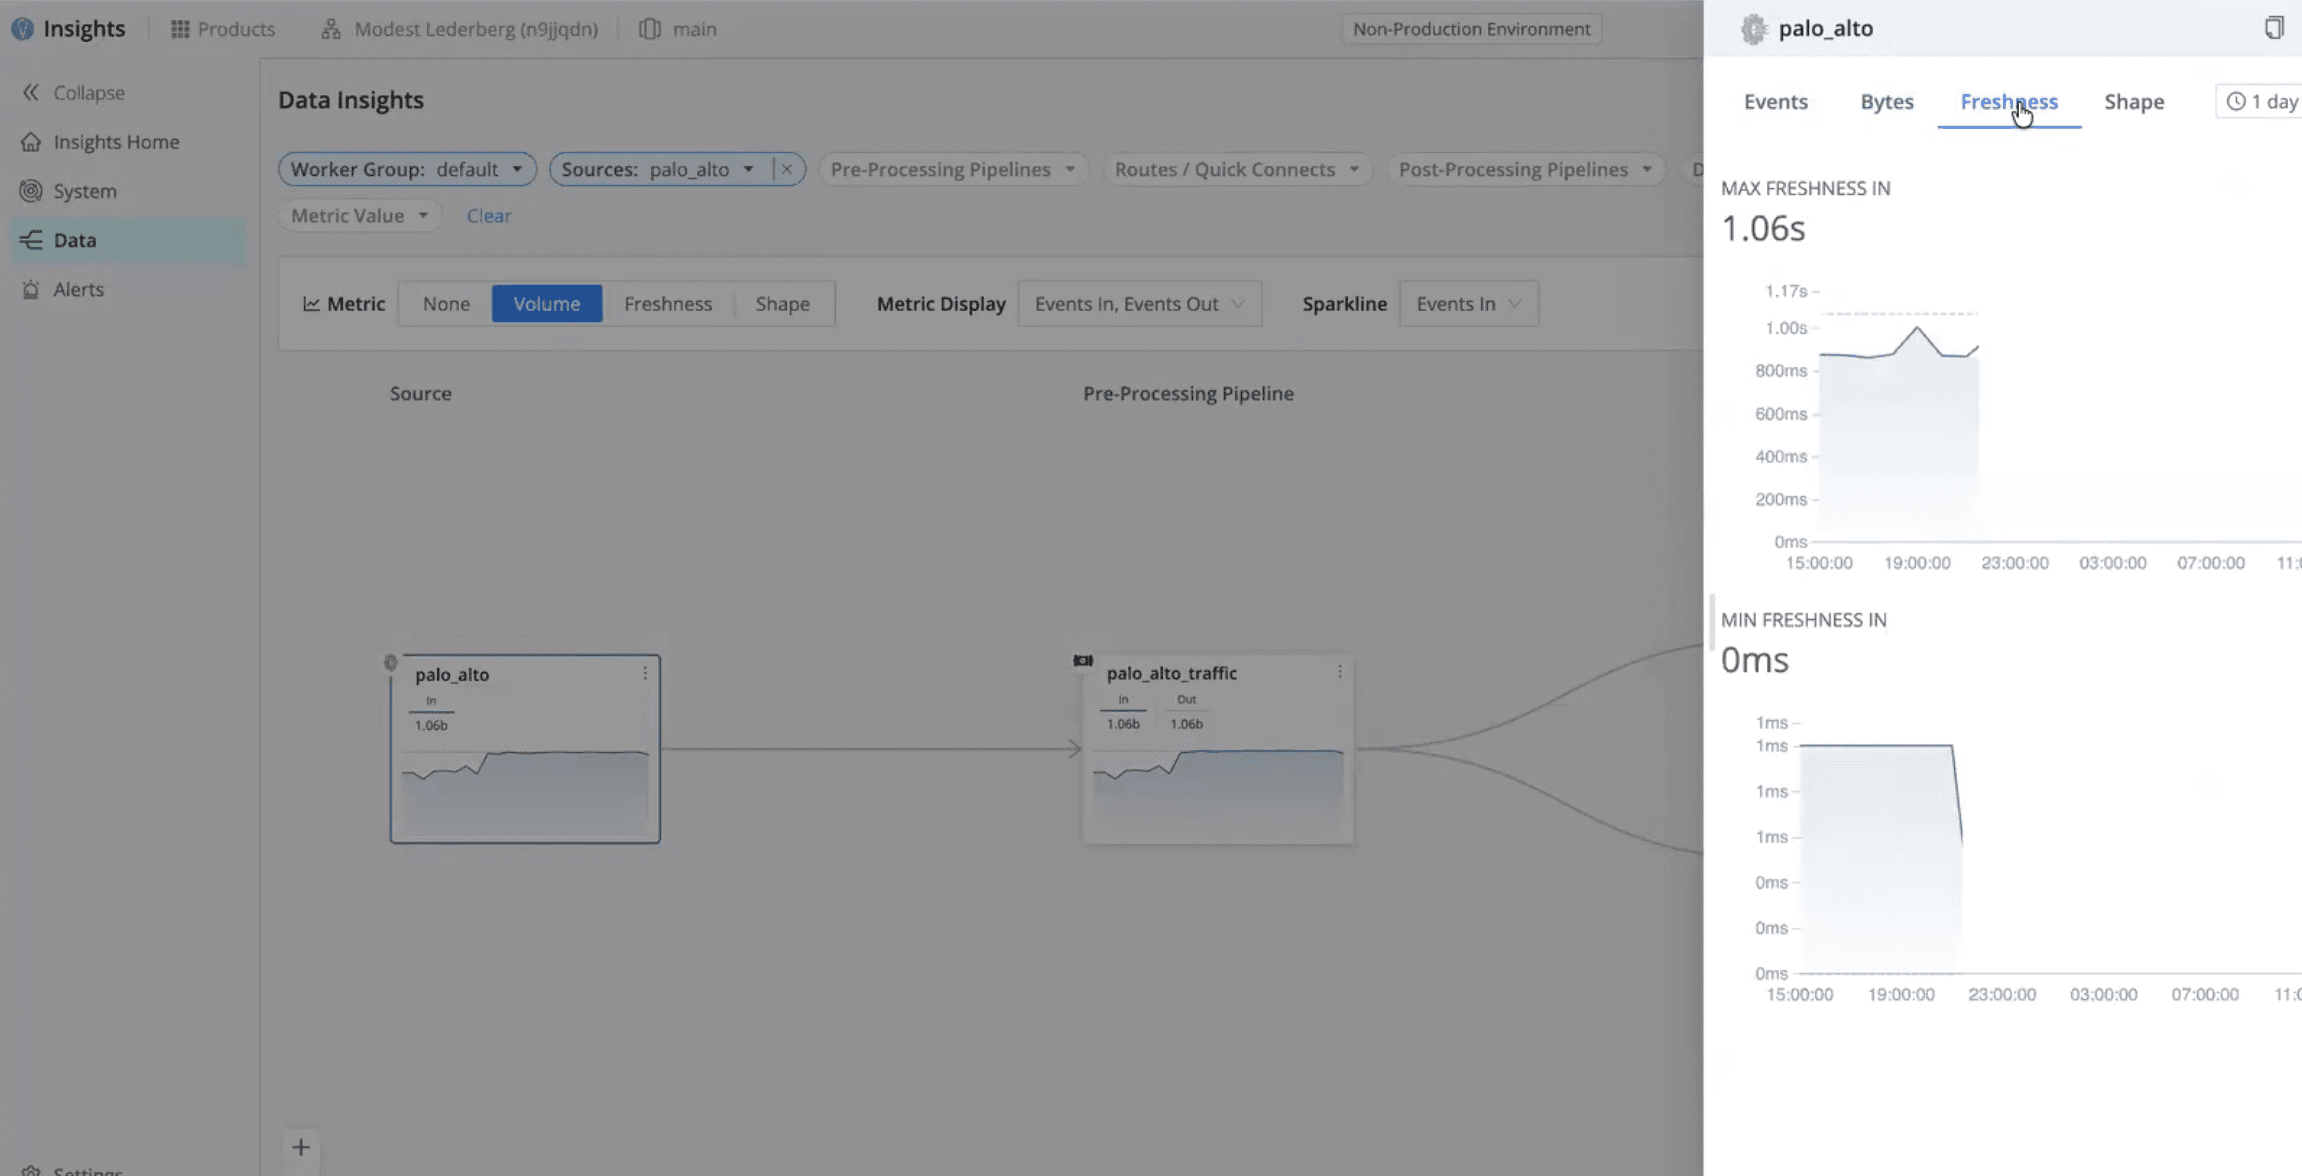
Data Insights provide end-to-end visibility across the pipeline—from source to preprocessing, post-processing, and destination—eliminating black boxes that often hide partial drops or unintended filtering.
With Data Insights, IT teams can:
Visualize data flow across every stage of the pipeline
Filter by source or worker group to isolate specific workloads
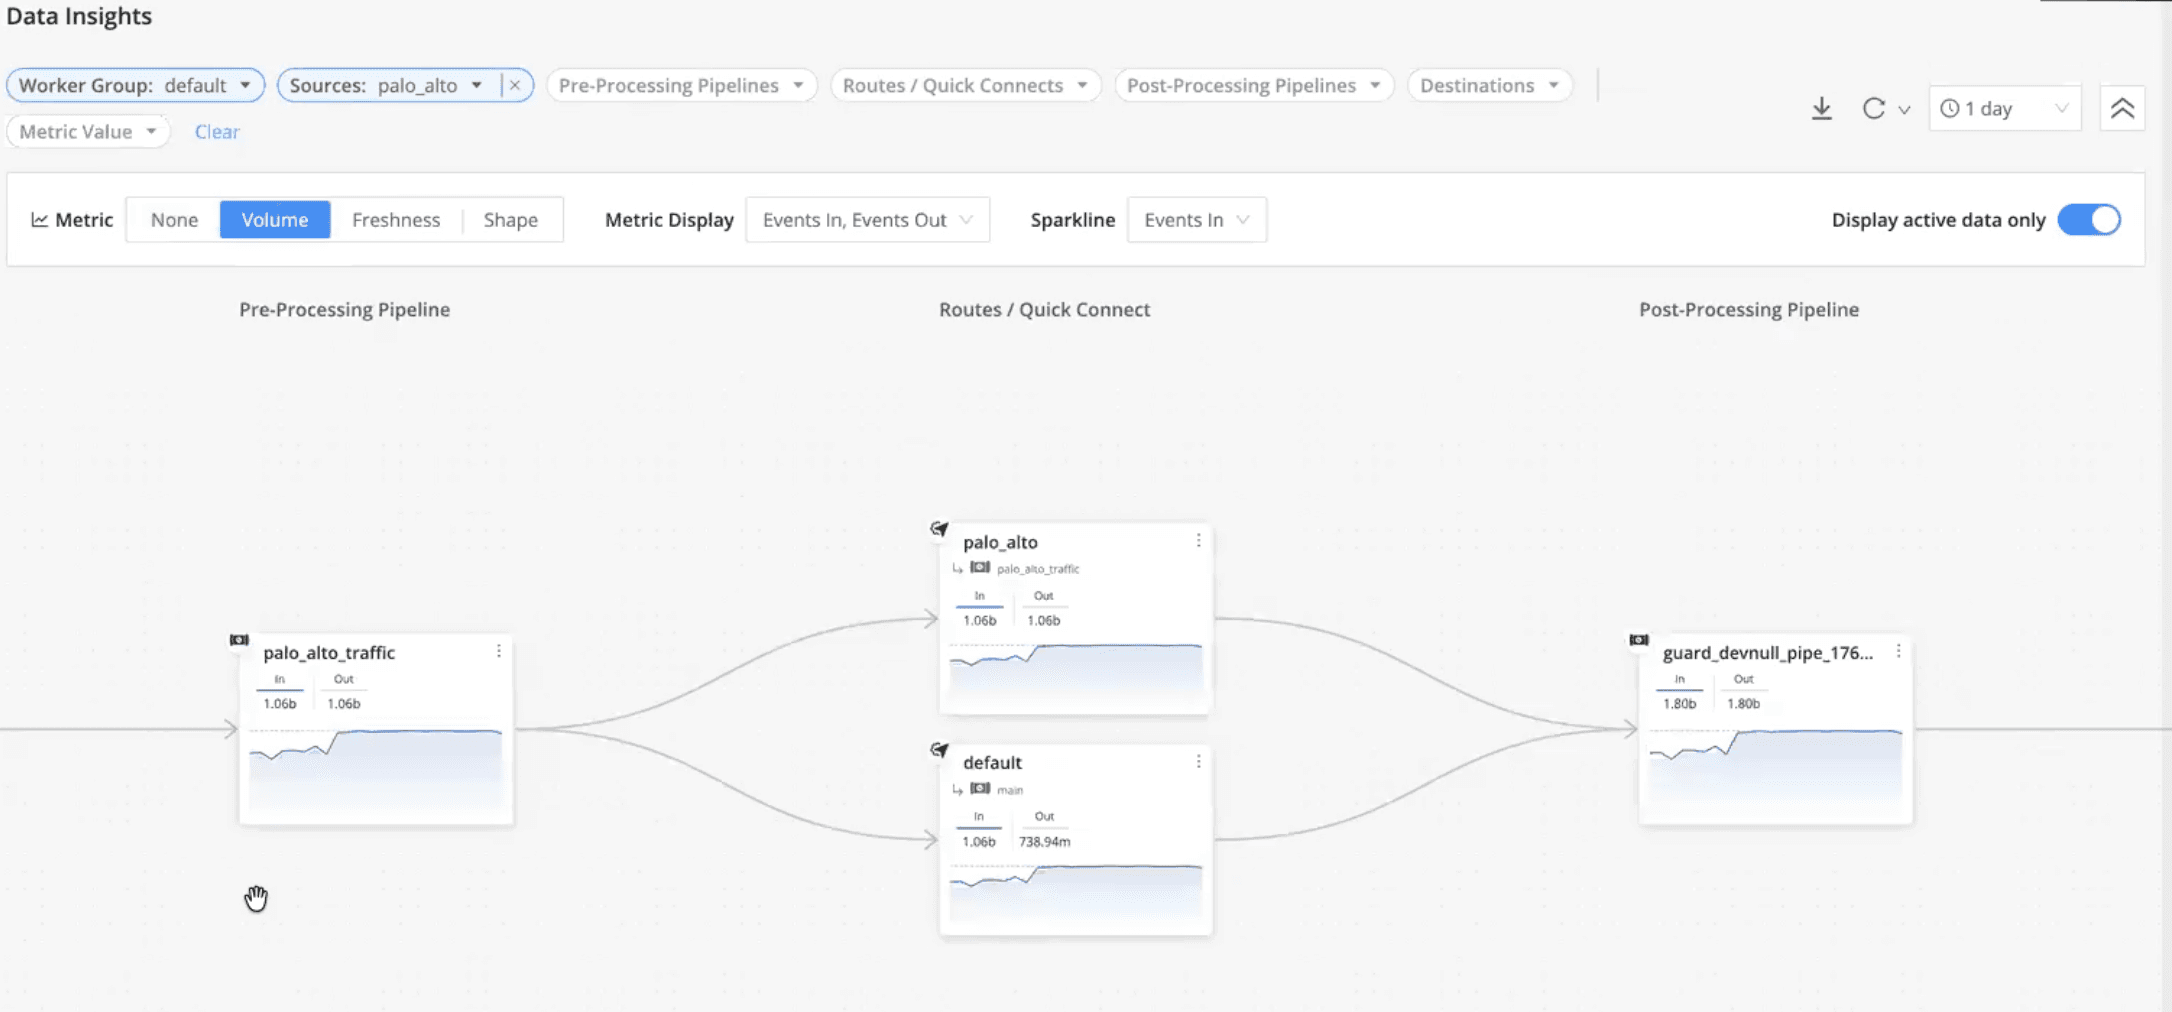
Interactively explore volume changes, clicking through event counts at each step
Inspect data in vs. data out, including bytes, events, freshness (lag), and data shape (fields in vs. fields out)
Detect dropped, filtered, or rerouted events, whether intentional or accidental
Track trends by dataset or source over multiple days to establish a reliable baseline
Optimize pipelines and costs using insights into routing, filtering, and tiering decisions
This is especially important for catching partial data loss—cases where telemetry hasn’t stopped entirely but has degraded enough to create blind spots downstream.
Alerting: Centralized, Actionable, and Tuned for IT and Security Operations
Cribl Insights includes built-in alerting designed to reduce noise while still catching meaningful issues early.
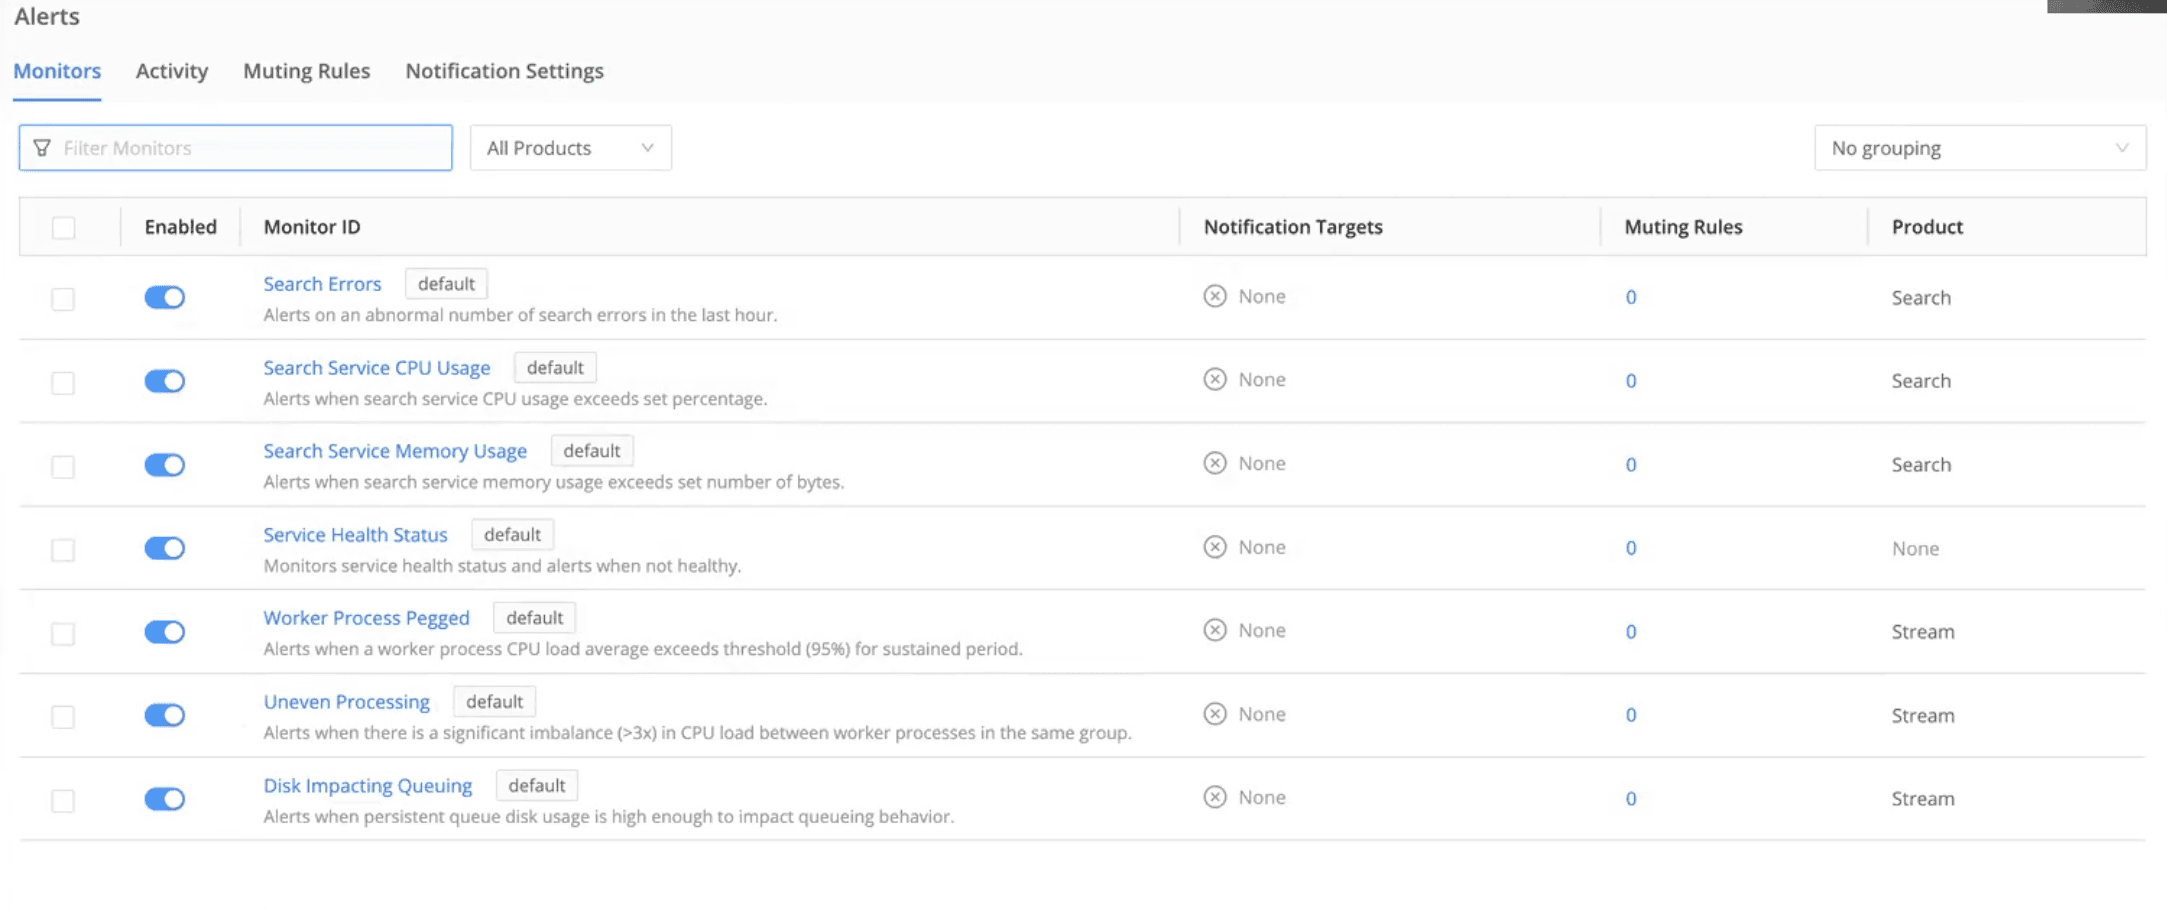
Out-of-the-box alerts
Teams can enable default alerts for:
System health issues
Data volume anomalies
Failures and slowdowns
These provide immediate coverage without needing to define everything from scratch. Teams also have the option to mute alerts for a specific period of time.
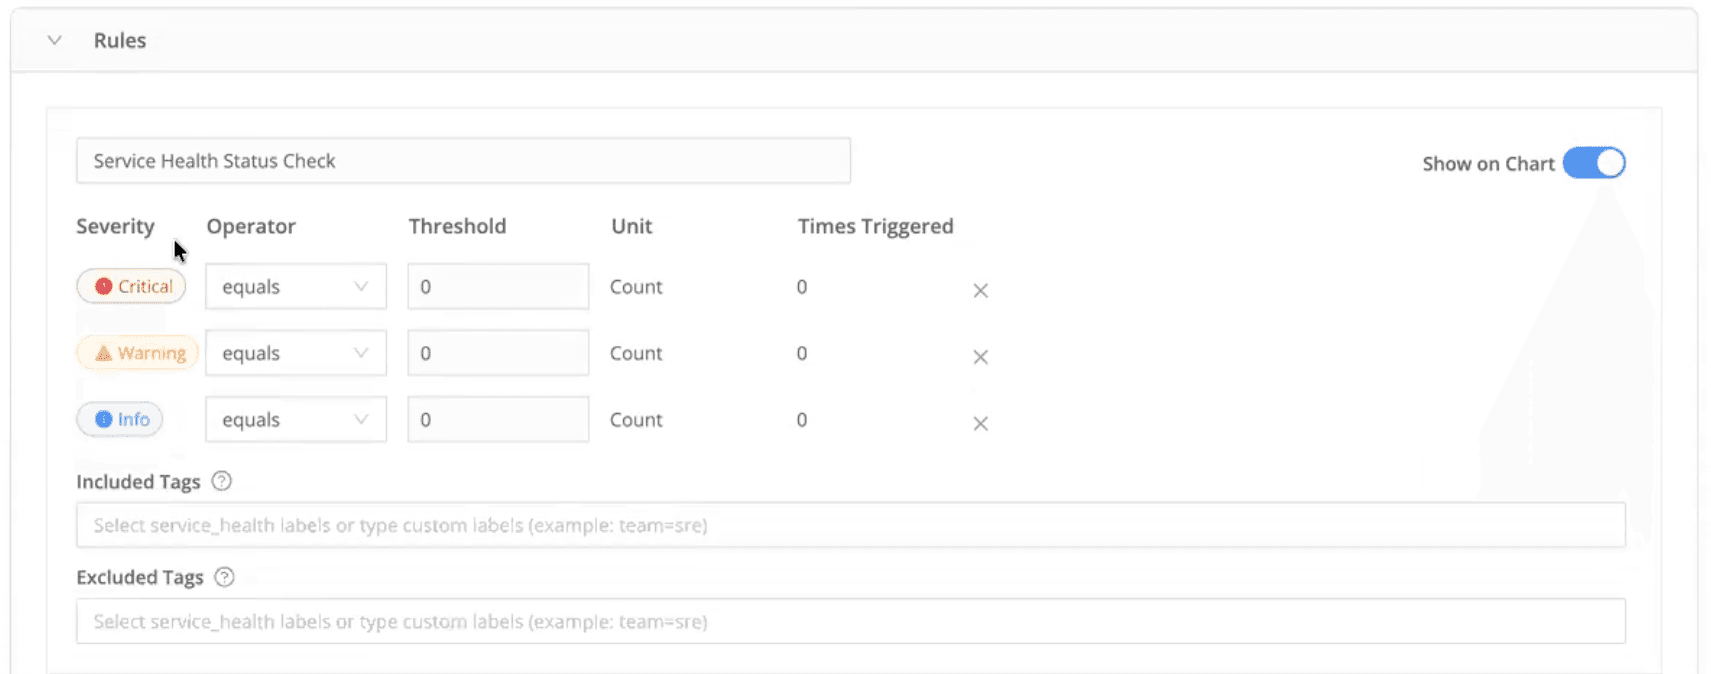
Custom alert conditions
Alerts can be customized with:
Threshold-based firing conditions
Severity levels (Critical, Warning, Info)
Product-specific or alert-specific policies
This helps teams avoid alert fatigue while still detecting early warning signals.
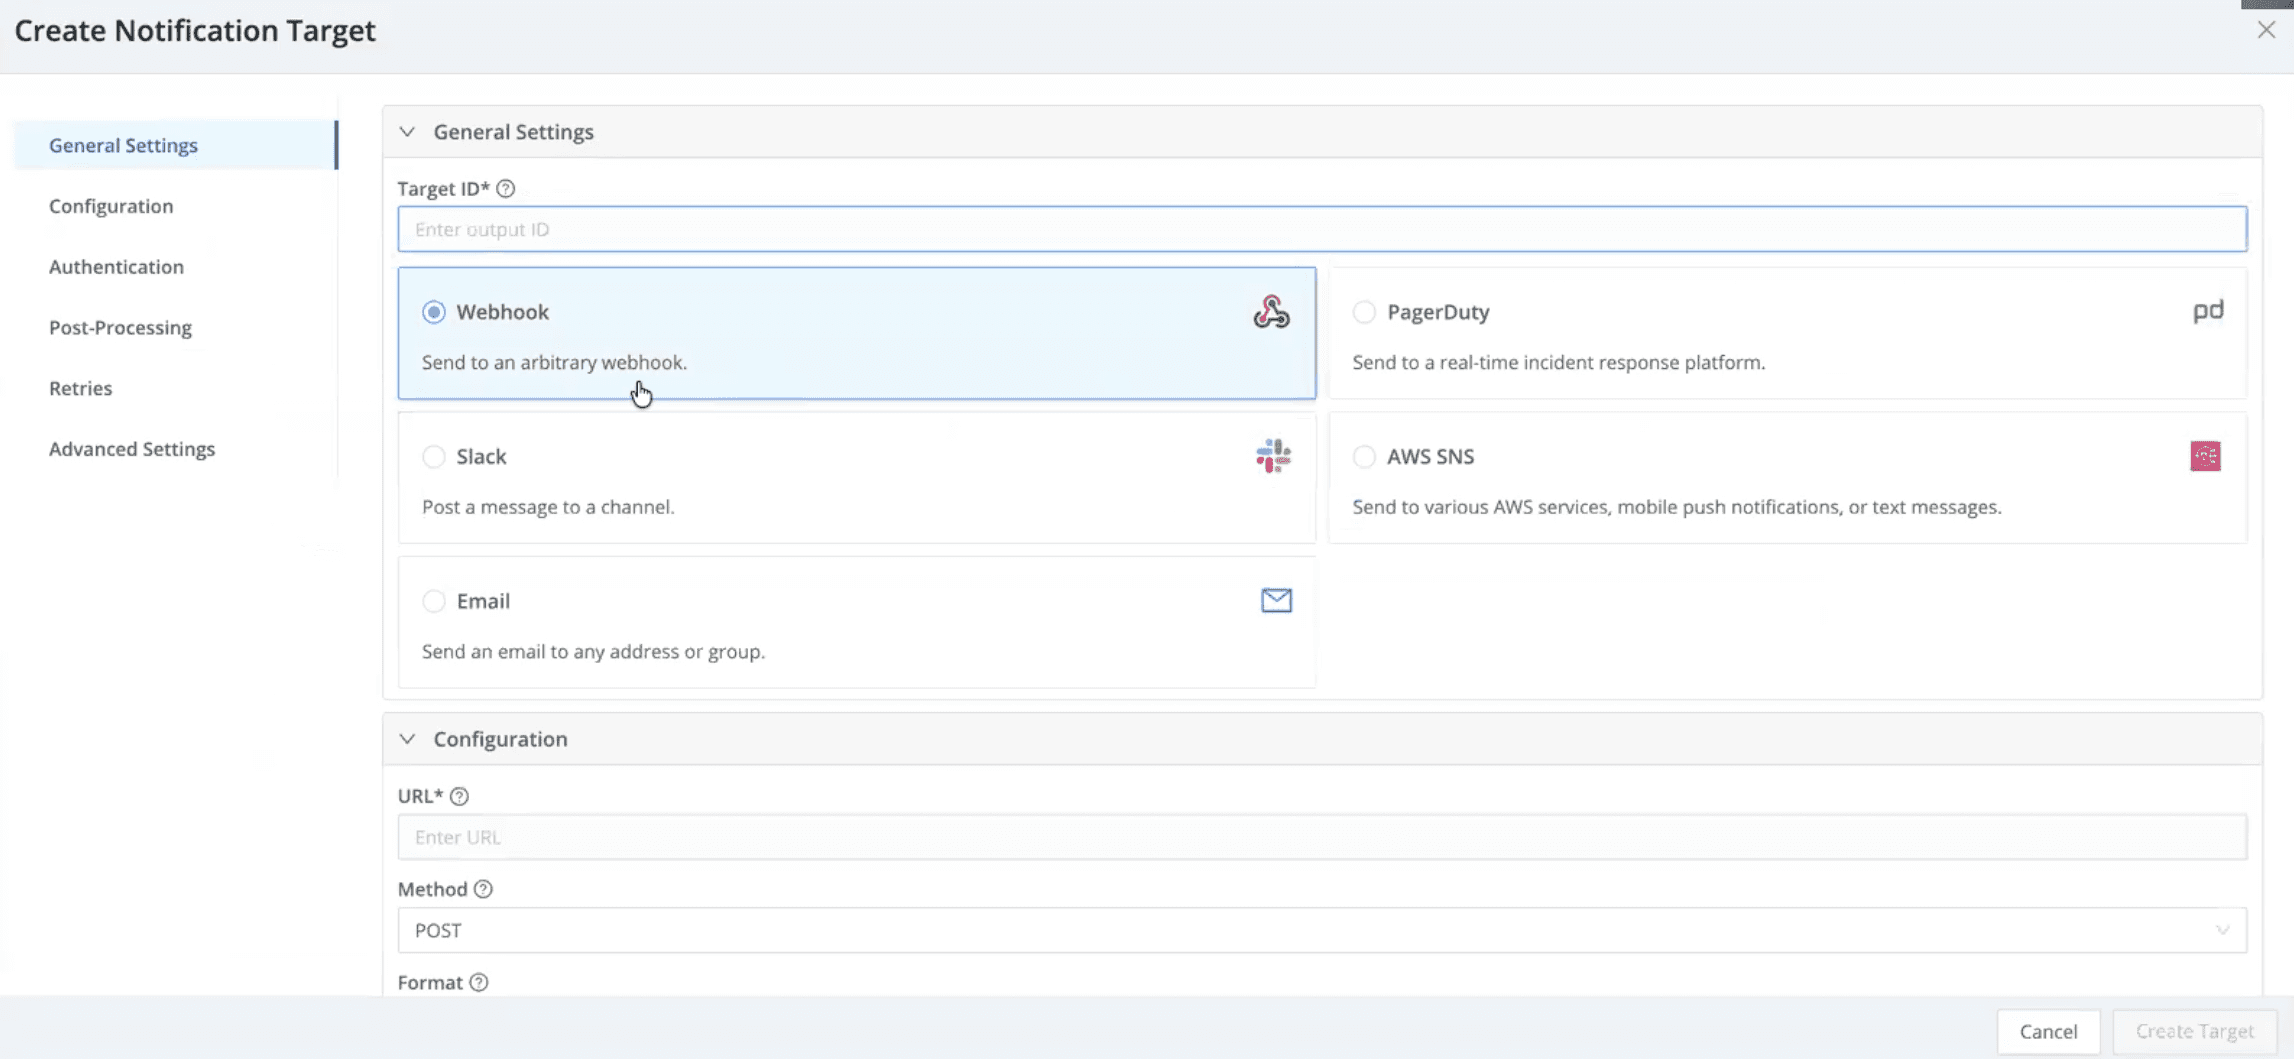
Flexible notifications
Alerts can be routed directly into existing workflows, including:
Slack
PagerDuty
SNS
Email
Webhooks or custom targets
Notifications can be configured by product, alert type, or severity to match how teams already operate.
Alert visibility and control
Cribl Insights also provides:
A centralized view of active and historical alerts
Full context, including triggering conditions and query details
Filtering by product, alert type, or severity
The ability to mute or schedule alerts during maintenance windows to reduce noise
The result is fewer alerts, clearer context, and faster response when something actually matters.
Get Started with 48 Hours of Free Context
Cribl Insights is now generally available and free for all Enterprise Cloud customers with up to 48 hours of data included. For longer retention, customers can choose 7 days, 1 month, 3 months, or 1 year, with pricing based on the number of credits per primary workspace. See cribl.io/pricing for more details.
Cribl Insights gives IT and security teams a single control plane to:
Monitor system performance and capacity
Understand how telemetry behaves end to end
Detect data anomalies before they become outages
Stay proactive with centralized, intelligent alerting
As telemetry pipelines grow more complex—and more automated—having this level of built-in visibility is necessary. Cribl Insights helps teams keep data flowing reliably today, while preparing for a future where monitoring increasingly feeds automated and agent-driven systems.