
Running Cribl Edge on Kubernetes clusters managed by the Nutanix Kubernetes Platform gives you a single, consistent way to observe what’s really happening in your platform. Instead of stitching together agents, sidecars, and custom exporters, Cribl Edge sits close to the workloads on each node, collecting metrics, logs, and events and turning them into usable, structured signals you can route anywhere.
This post isn’t a reference architecture you must follow. It’s a look at what becomes possible when you standardize cluster‑level collection with Cribl Edge and then use Cribl’s routing and pipelines to fan that data out to whatever tools your teams prefer.
Watching Nutanix Kubernetes from the Edge
On a Kubernetes cluster, every node hosts a mix of system services and applications, all emitting their own flavors of telemetry. Cribl Edge runs as a DaemonSet on those nodes and continuously collects:
Node‑level metrics such as CPU, memory, disk, and network usage
Pod‑level metrics and restarts
Application and platform logs
Kubernetes events from the control plane and workloads
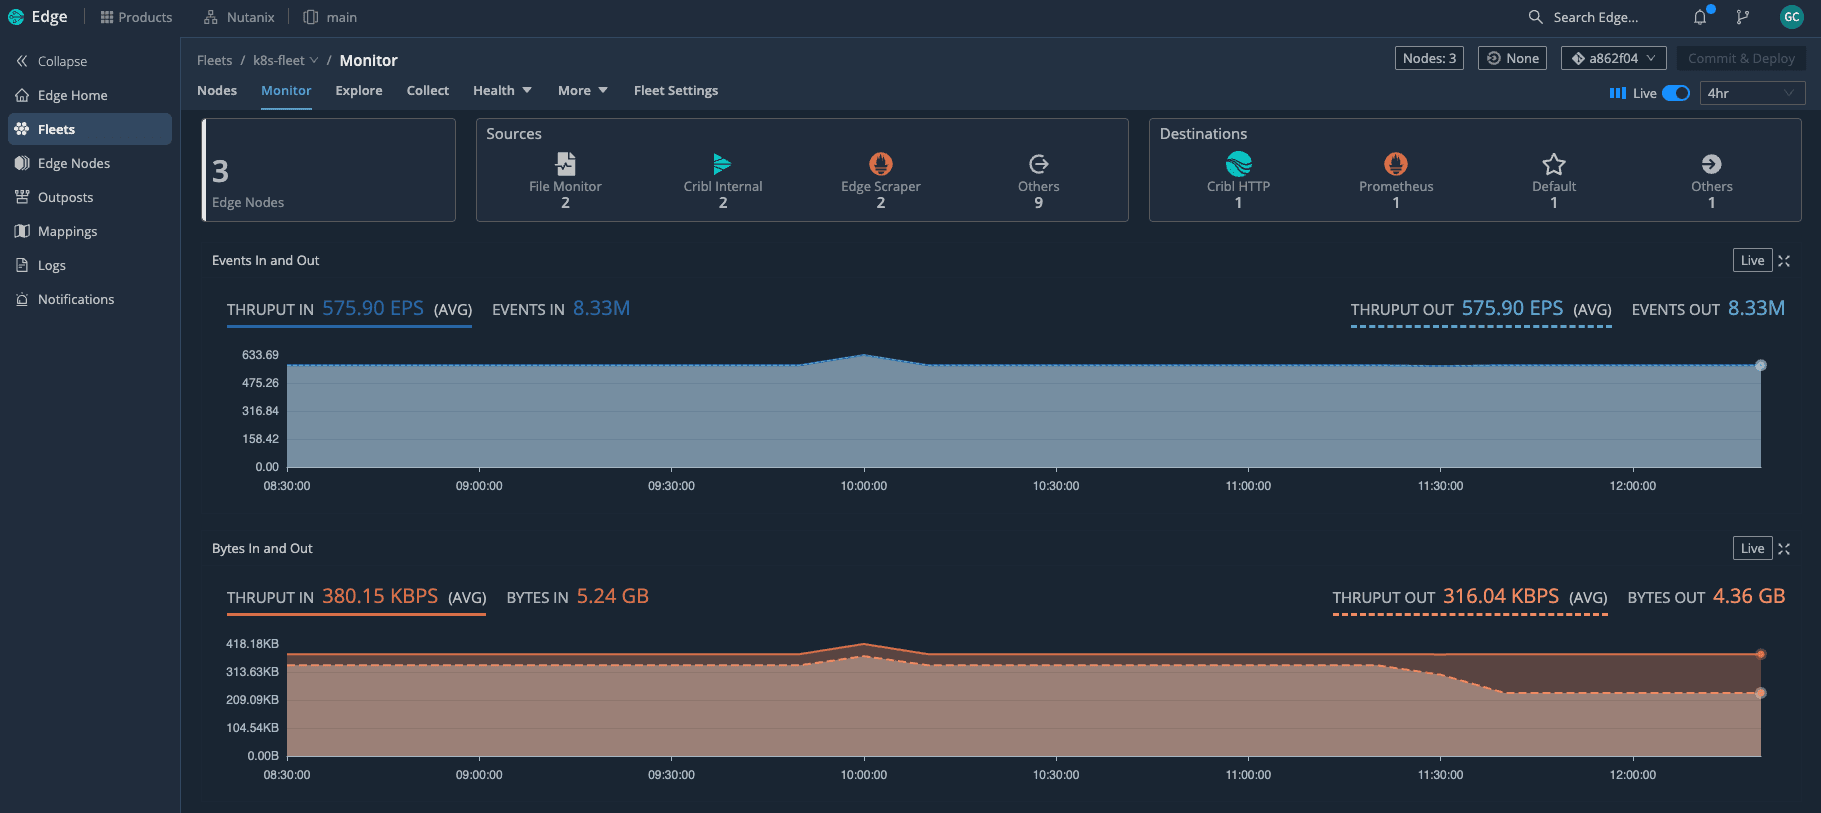
With Edge deployed as a DaemonSet across the Kubernetes cluster, we can see the entire fleet at a glance—how many nodes are active and how much telemetry is flowing through in real time. Because Edge understands Kubernetes, it automatically attaches rich context to what it collects: cluster name, node, namespace, pod, labels, and workload type. That context is what makes the difference between data you have and insights you can act on.
In practice, this means you get clear answers to questions like:
Which nodes are under pressure right now?
Which pods are flapping or crashing in a specific namespace?
Did this spike in errors line up with a deployment or a scaling event?
All of that comes from a single collection layer running on Nutanix, rather than from a patchwork of separate agents.
Business value of metrics, logs, and events together
The real payoff shows up when you look at how those three signal types work together.
Metrics give you the “vital signs” of the cluster: CPU saturation, memory pressure, disk usage, load average, and network throughput per node or pod. They show you where to look.
Logs tell you the detailed story inside the apps and platform components. Once they’re enriched with Kubernetes metadata, you can slice by team, service, or deployment without changing the code.
Events fill in the gaps: pod evictions, image pull failures, CrashLoopBackOff states, scaling actions, and rollout progress. They explain what the cluster itself was doing when something went wrong.
When you bring those signals together through Cribl Edge, SRE and platform teams move faster. You can see that a node’s CPU spiked, a set of pods restarted, and a deployment rolled out in the same timeframe—without hopping between tools or guessing which data is trustworthy.
If you want to visualize that story, you can surface these signals as a Nutanix “overall health” dashboard—CPU and memory trends per node, pod restarts, pod health, workload breakdown, and containers per node—built from metrics Edge has already collected and enriched.
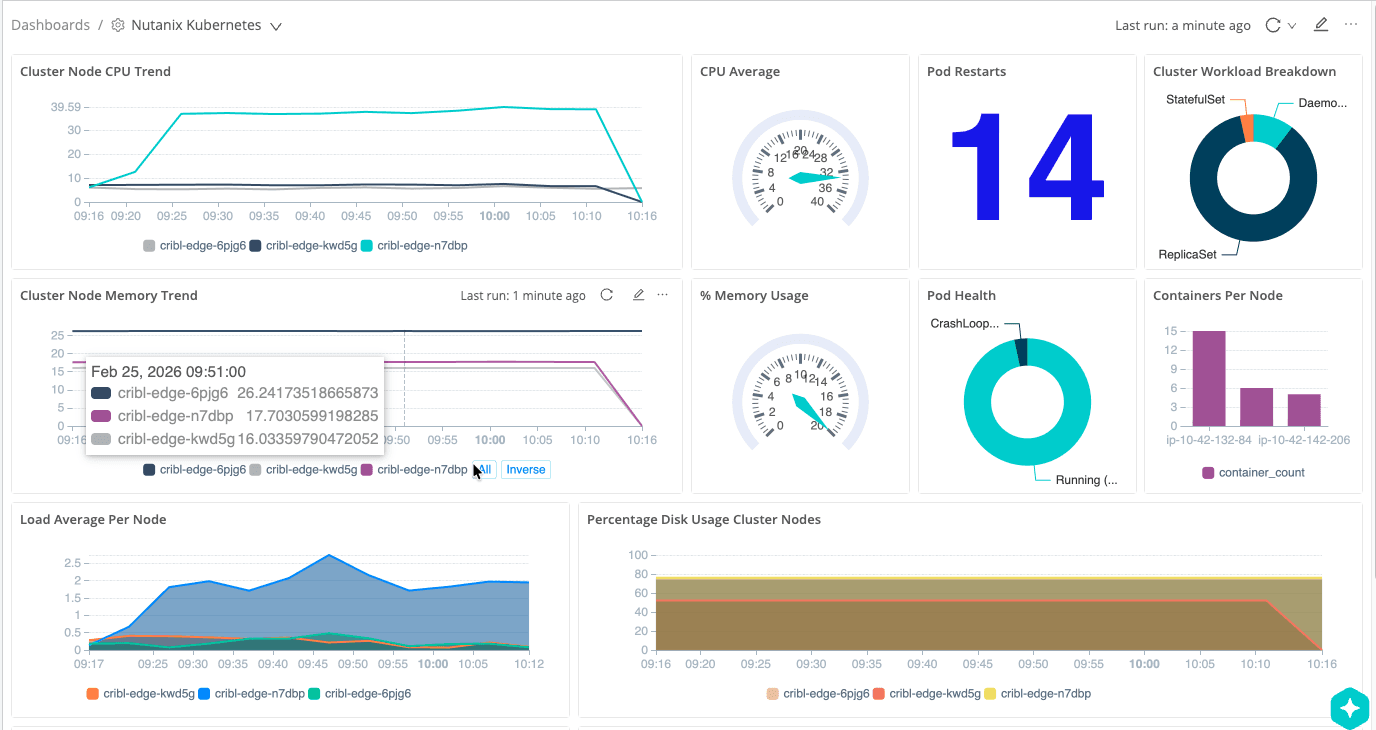
The interesting part is that this dashboard is powered by Cribl Lake, not a traditional metrics backend. Edge sends a full‑fidelity copy of the same cluster signals into Lake on low‑cost object storage, and Cribl Search rebuilds this view directly from that data—CPU and memory trends per node, pod restarts, pod health, workload breakdown, and containers per node—without having to re‑ingest everything into an observability tool.
Intelligent routing and pipelines: Fan‑out with control
Collecting everything is only half the story. The other half is deciding what each destination actually needs and shaping the data on the way out of the cluster.
Cribl’s pipelines let you do this directly at the edge:
Parse and normalize logs into a consistent schema
Enrich records with Nutanix and Kubernetes metadata
Filter or sample low‑value, noisy messages
Convert certain events into lightweight metrics
Route different slices of data to different tools
This setup uses an Edge pipeline to convert Kubernetes metrics into Prometheus‑compatible metrics and send them to Grafana, so all of that Nutanix telemetry shows up in familiar dashboards without running a full Prometheus stack on the cluster.
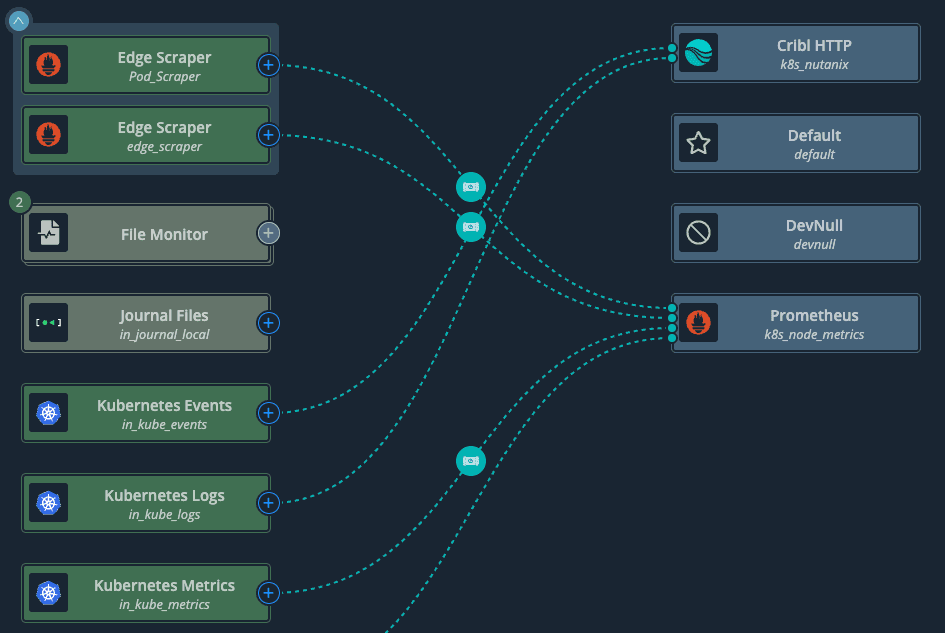
Here’s a simple example: Kubernetes metrics, logs, and events all flow into Cribl, where they are routed to multiple destinations or even to /dev/null when there is no need to keep certain traffic.
A few concrete examples of how this plays out:
Operations teams might get full‑fidelity logs and metrics for critical namespaces, while security teams receive a redacted, privacy‑aware view of the same streams.
Chargeback or capacity planning tools might only need a smaller set of aggregated node and namespace metrics, not every time series Edge sees.
High‑volume debug logs from non‑production namespaces can be sampled or dropped entirely, while production logs are preserved end‑to‑end.
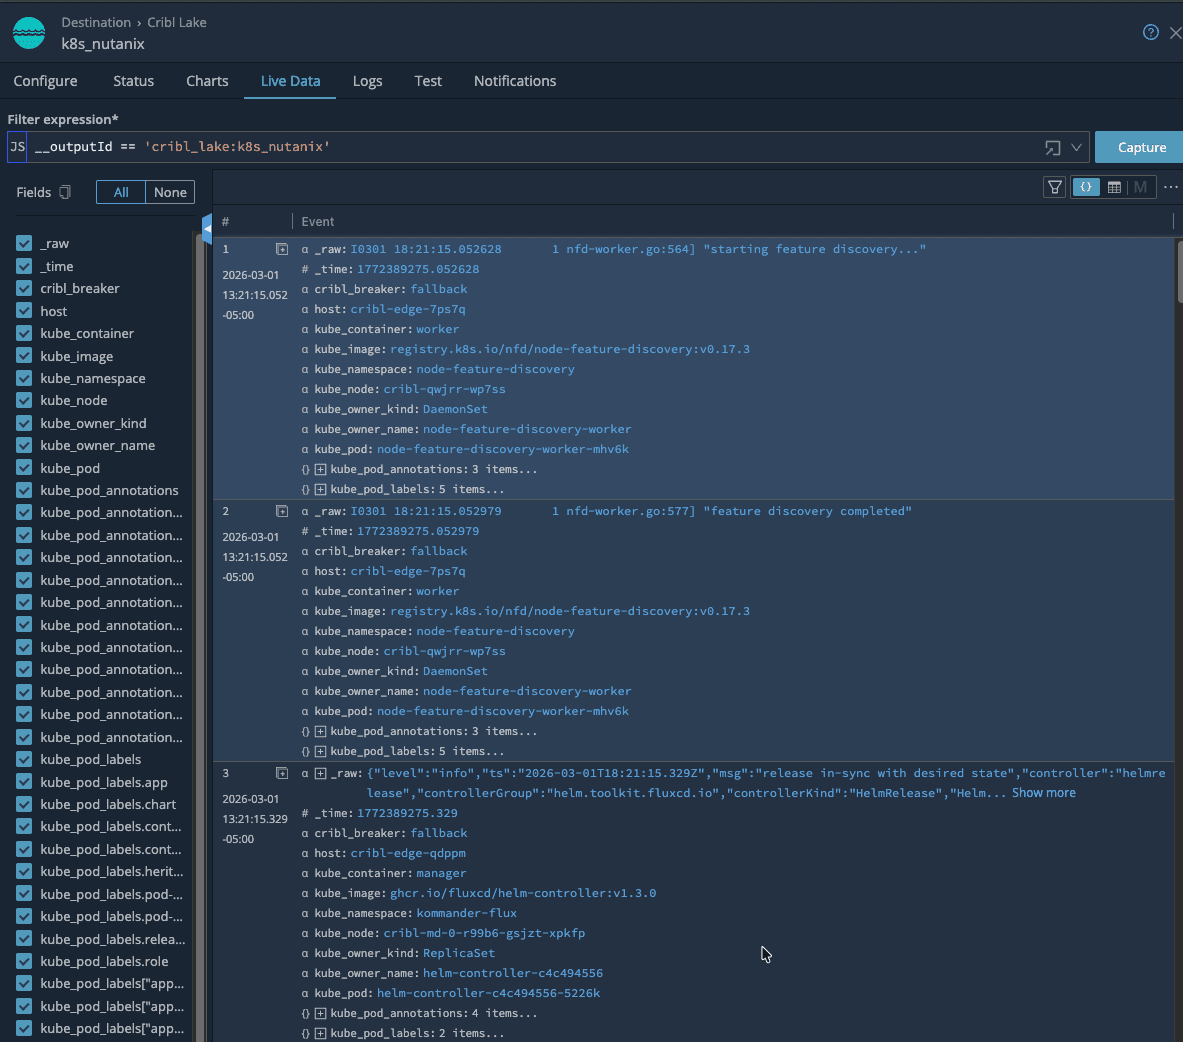
From there, live data makes it easy to see just how much Kubernetes context is attached to every event—namespaces, jobs, labels, and Nutanix specific fields—so troubleshooting starts with rich, searchable context. Because routing and transformations are defined centrally, you can add or swap destinations over time without redeploying agents or modifying workloads on your Nutanix clusters. Edge stays in place as the stable collection and control point.
Cribl Lake and Cribl Search on low‑cost storage
If you decide to use Cribl Lake, you can take this a step further by sending a full‑fidelity copy of your Nutanix telemetry into low‑cost object storage. Cribl Search then lets you query and visualize that data directly on the lake, without having to load it into an observability platform first.
That opens up a useful pattern:
Land everything from Edge into Lake on inexpensive storage
Use Cribl Search to explore the raw data, validate new parsing or filtering ideas, and build dashboards
Once you know which views and signals matter, forward only those into your more expensive observability tools
This “search and dashboard on low‑cost storage first, then forward” approach lets you control ingestion costs while still having deep historical visibility when you need it. It also gives you a vendor‑neutral safety net: your Nutanix cluster data lives in your own storage, and you keep the freedom to change downstream tools over time.
Prometheus‑ready metrics and Grafana views
What really ties this all together is having Cribl Edge convert Kubernetes metrics into Prometheus format before they ever leave the cluster. That step means Grafana can consume Nutanix metrics just like any other Prometheus target, without you having to run and maintain a full Prometheus stack on the platform. Edge does the hard work of scraping, enriching, and reshaping the data; Grafana simply reads clean, well‑labeled series.
We use that to drive a set of opinionated Grafana dashboards that match how we actually operate the platform. The Nutanix Kubernetes Cluster — Operations Overview dashboard gives a single, high‑level view of the environment: Kommander management plane health, Flux GitOps controllers, Nutanix CSI storage, and the Cribl Edge observability pipeline are all represented with simple green/red tiles and drill‑downs.
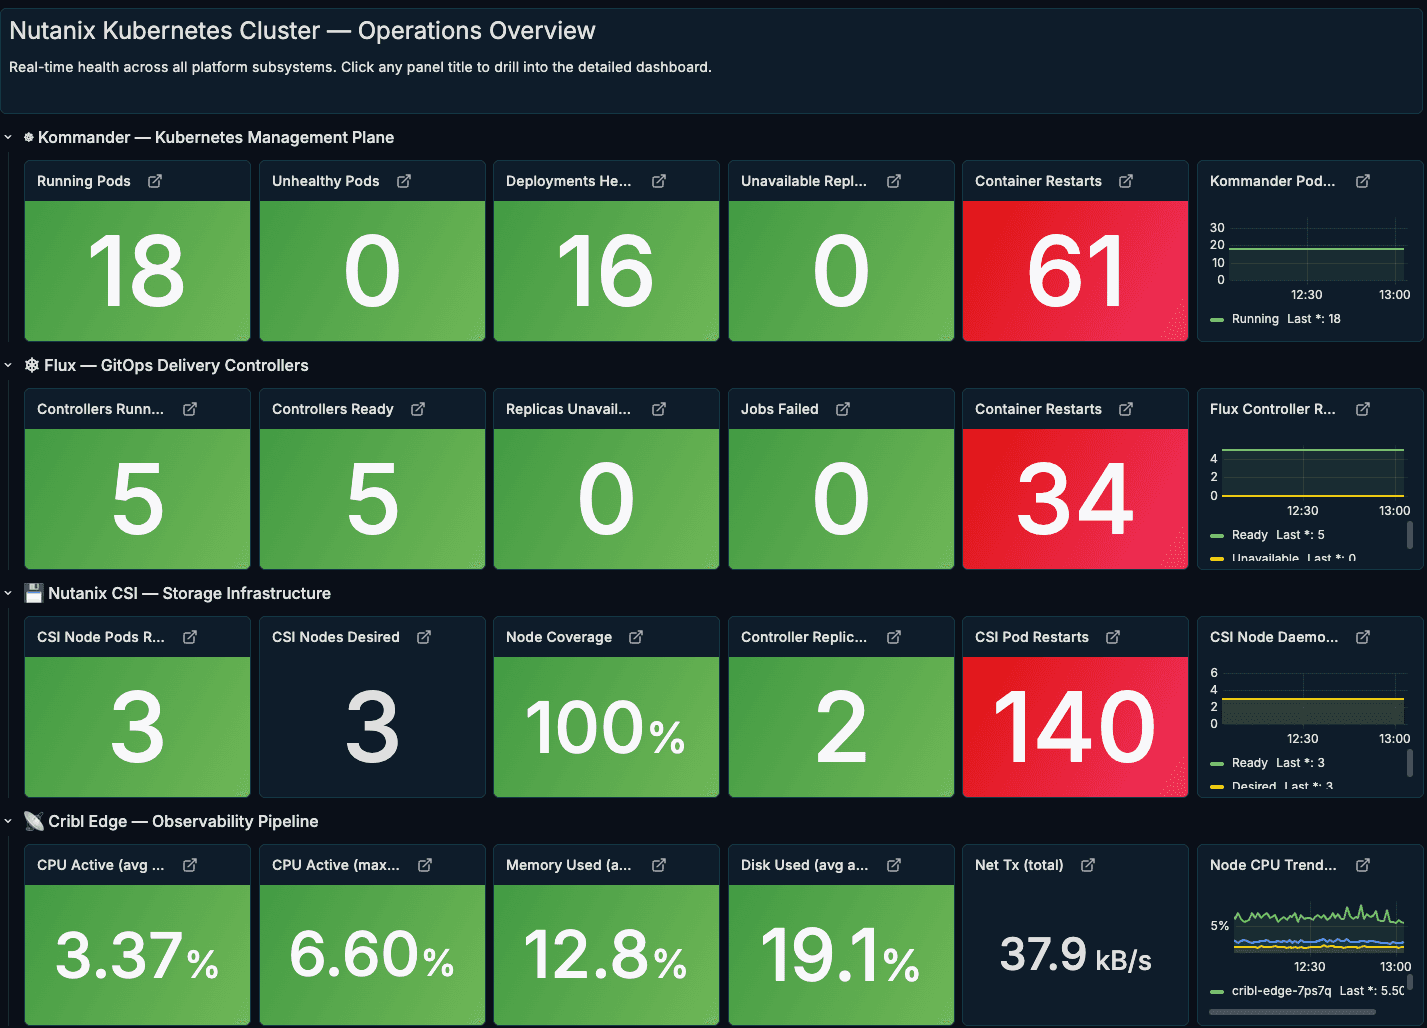
Then drill‑down views showcase the same Edge‑generated Prometheus metrics at a finer grain. One dashboard highlights the Nutanix controllers (CSI and related components), surfacing controller pod restarts, readiness, and resource usage over time so storage issues stand out quickly. Another centers on the GitOps and management layer—either Kommander or Flux—showing running pods, failed jobs, and container restarts to make the health of the control plane obvious at a glance.
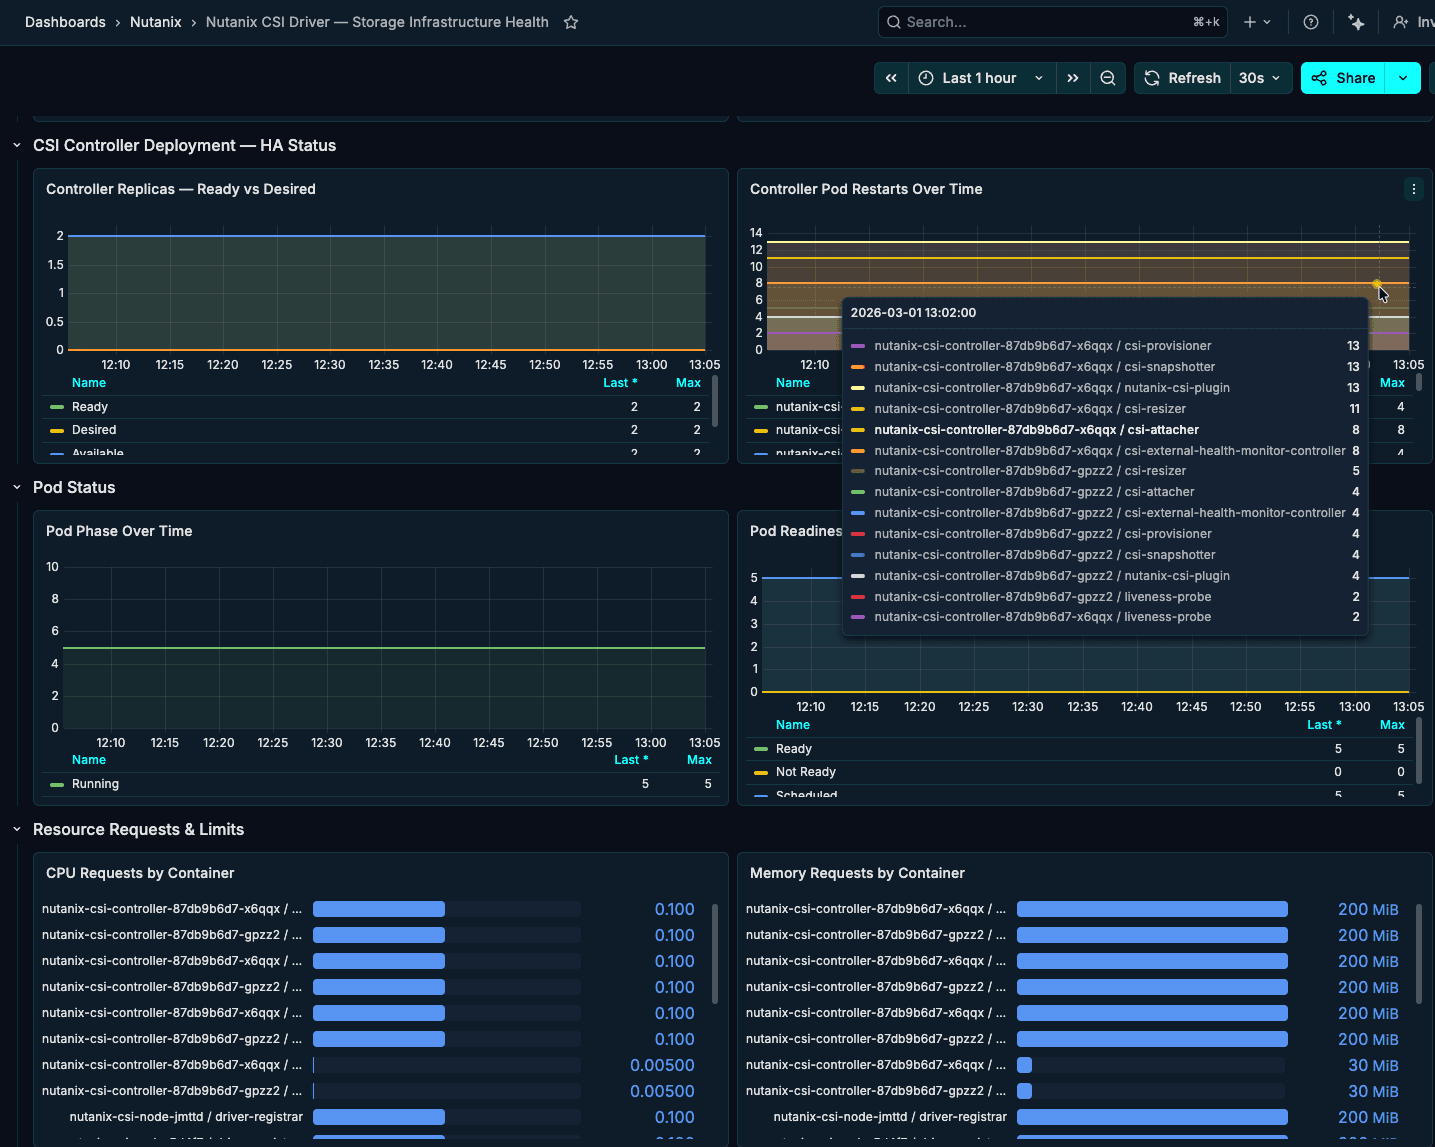
This Nutanix controller dashboard focuses on the CSI layer—controller replicas, pod restarts, readiness, and resource usage over time—so storage‑related issues surface quickly without digging through logs.
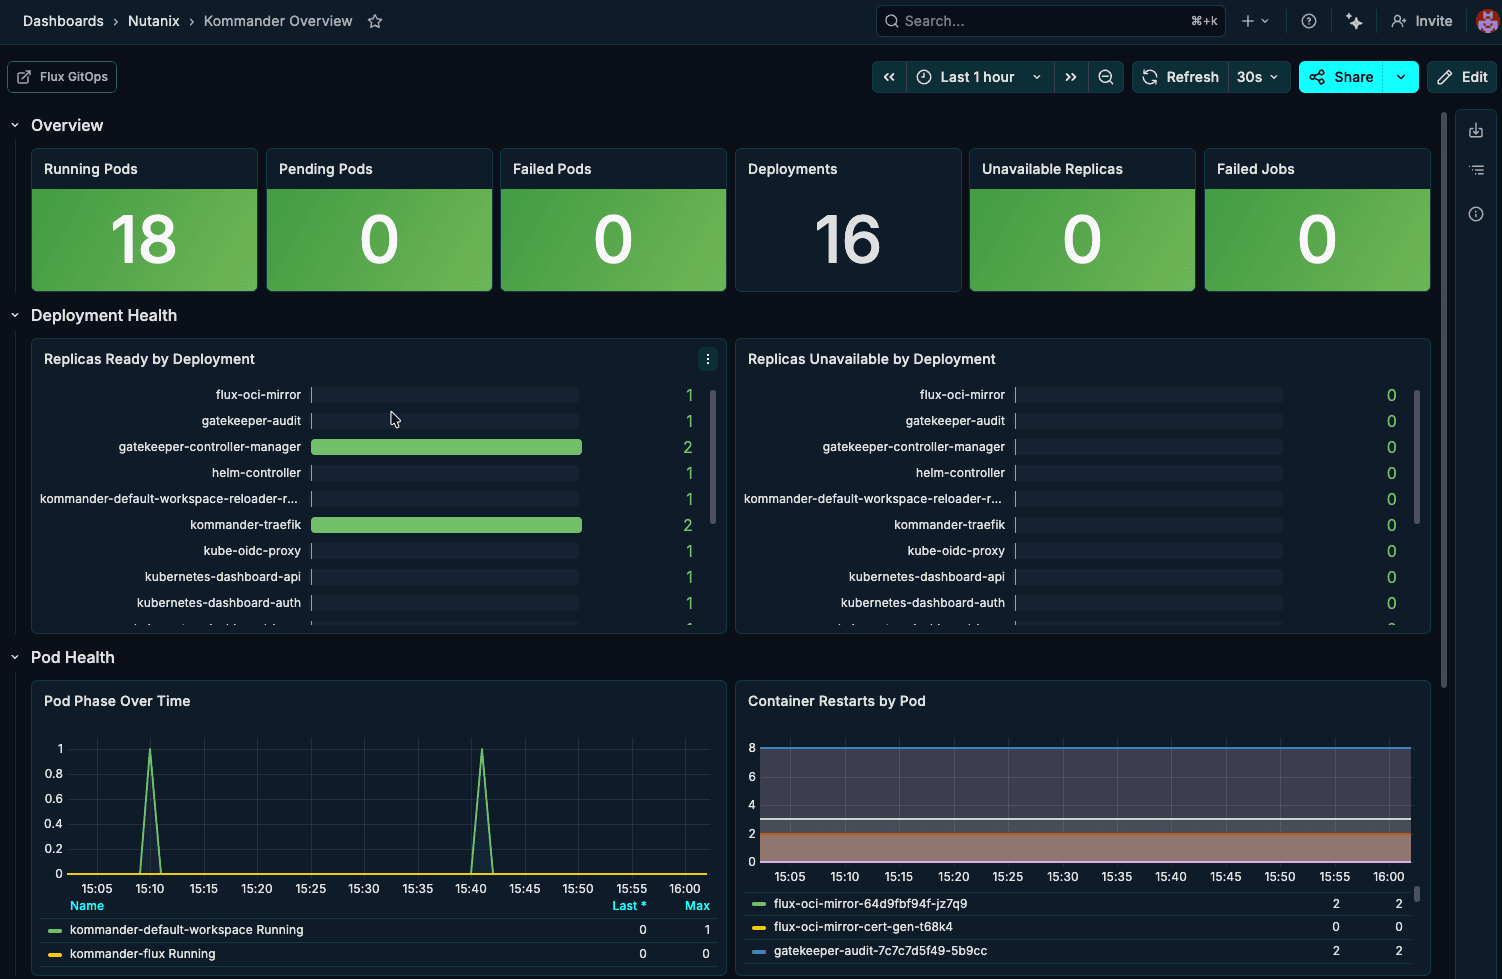
The Kommander overview dashboard tracks the health of the management plane itself, highlighting running pods, failed jobs, deployment status, and pod restarts to show at a glance whether the control layer is stable.
By standardizing collection with Cribl Edge on Nutanix Kubernetes, you get a single, trusted layer for metrics, logs, and events—enriched with Nutanix and Kubernetes context, routed with precision, and stored on low-cost object storage when you need full-fidelity history. Instead of stitching together agents and point integrations, platform and SRE teams can operate from one consistent telemetry fabric, feeding Grafana, SIEMs, and other tools with the right data in the right shape, while keeping ownership of that data in their own environment.
Meet us at Nutanix .NEXT for more
That’s exactly the vision we’re pursuing alongside Nutanix: pairing Nutanix’s Kubernetes platform and ecosystem with Cribl Edge, Stream, and Lake so customers can observe more, spend less, and stay ready for whatever’s next in their hybrid multicloud and AI roadmaps. If you’re heading to Nutanix .NEXT 2026 in Chicago, come find us at the Cribl kiosk—we’re proud to sponsor this year’s event and to show how your telemetry, running on Nutanix, is ready for the AI frontier in live demos and real-world dashboards.