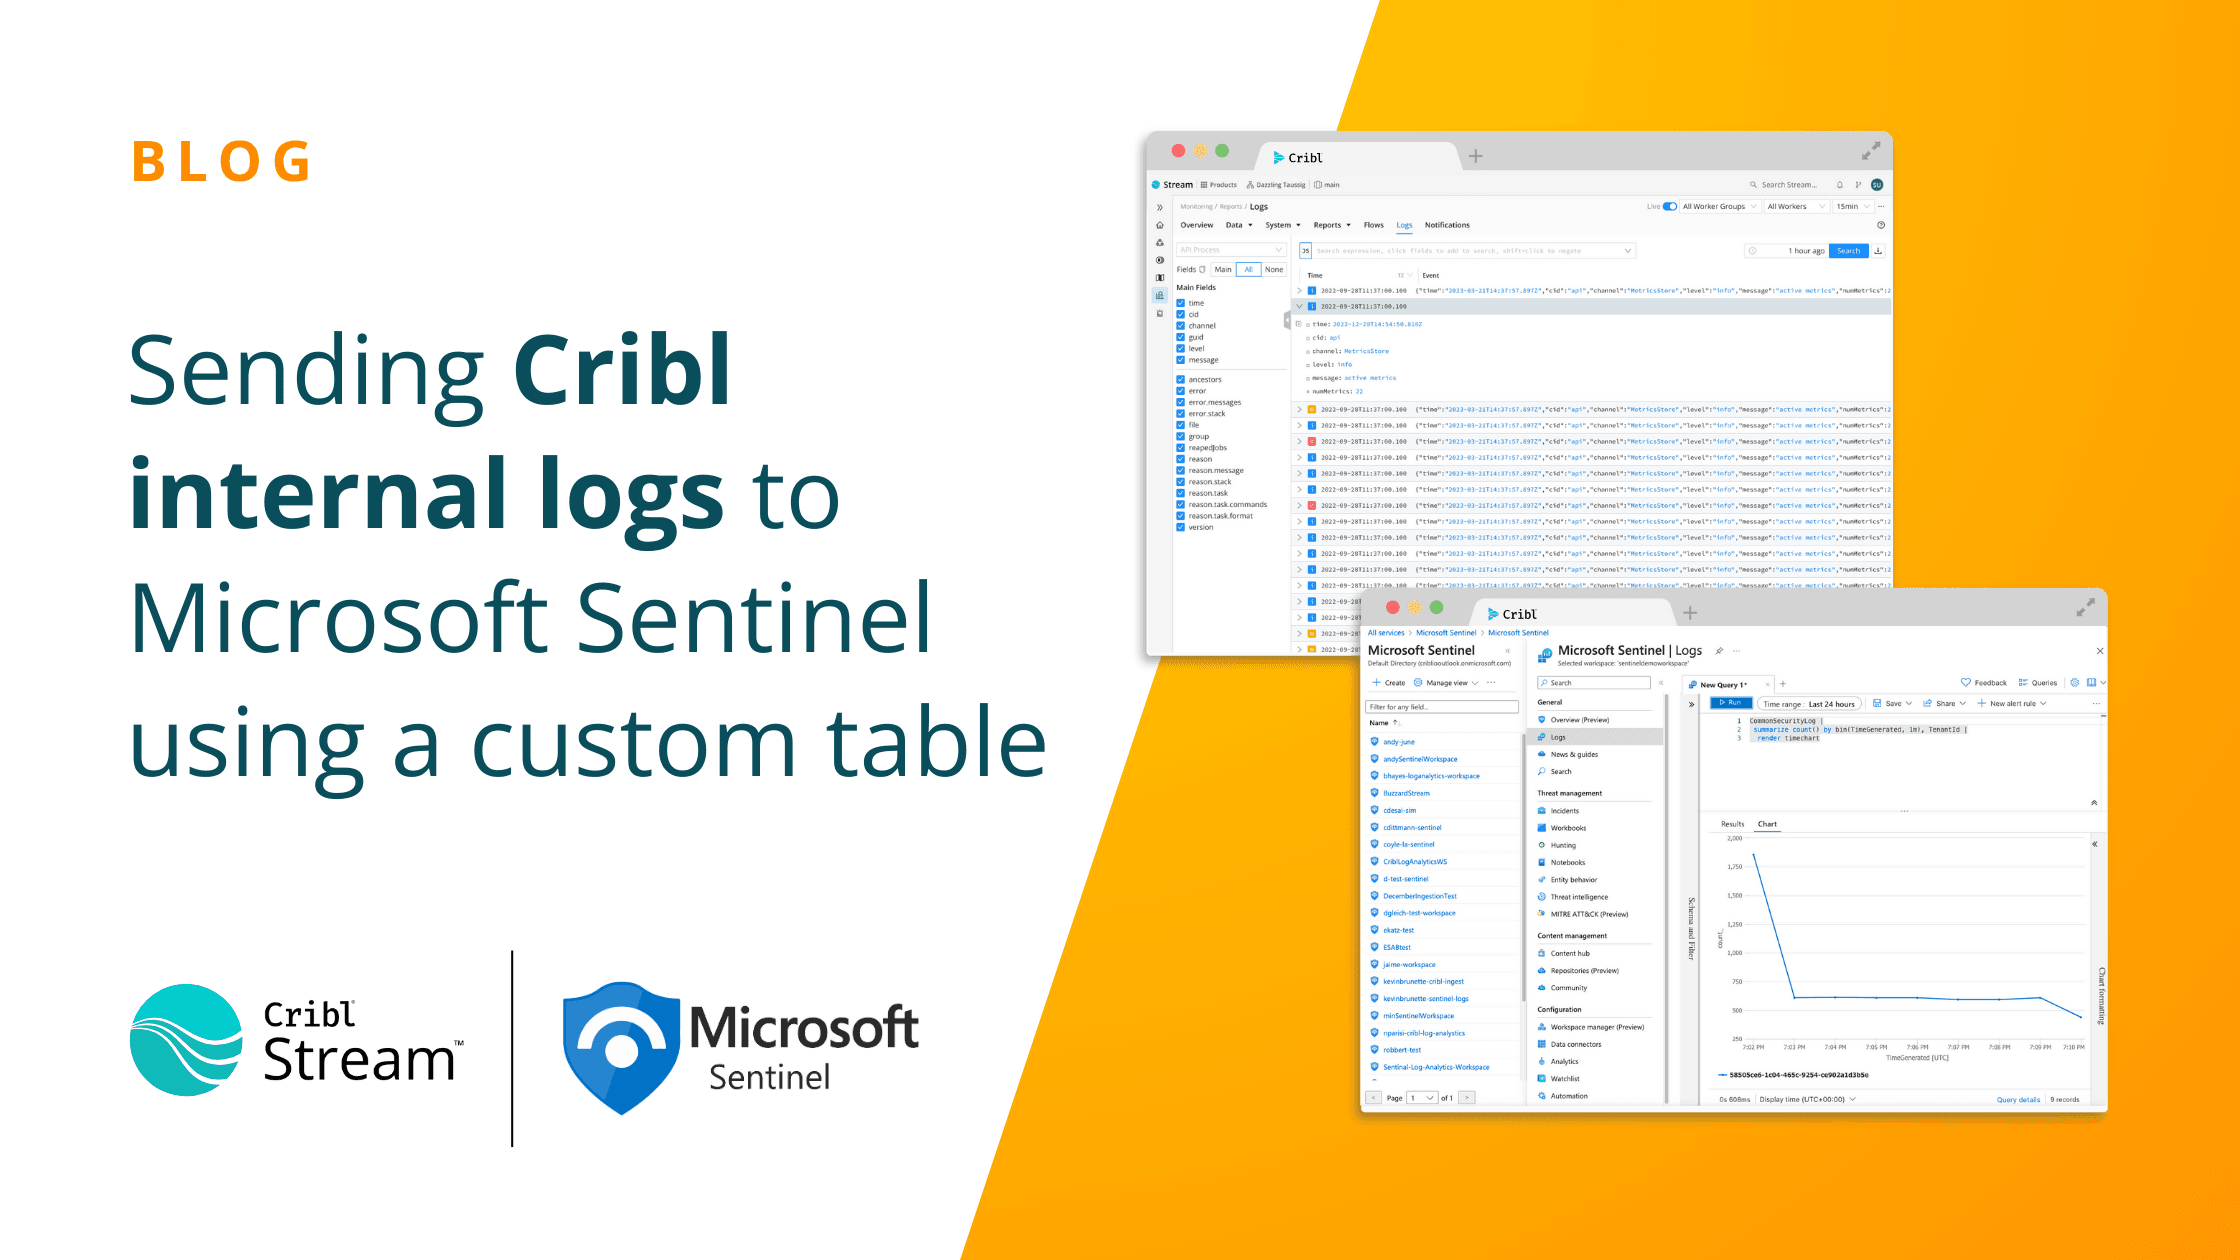
Organizations rely on Cribl Stream to control the flow of their telemetry data. One important but often overlooked data source is Cribl’s own internal logs, which can provide valuable insight into pipeline performance, worker health, system metrics, and error conditions. Forwarding these logs into your SIEM platform allows your SOC or platform teams to correlate Cribl operational telemetry with the rest of your security and IT data.
In this post, we’ll walk through how to forward Cribl Internal Logs to Microsoft Sentinel using a custom table. Unlike the built-in integrations that map data into standard Sentinel tables, this approach creates your own Data Collection Endpoint (DCE) and Data Collection Rule (DCR), so you can shape a schema that matches your operational and monitoring needs. We’ll also highlight relevant resources, including Microsoft’s Cribl content hub solution for Sentinel.
Why Send Cribl Internal Logs to Sentinel?
Cribl Internal Logs capture a rich stream of information, including:
System activity (workers, leaders, packs)
Data flow metrics (throughput, latency, drops)
Operational errors and warnings
Pipeline processing statistics
By shipping these into Sentinel, you can:
Detect anomalies in pipeline performance that impact data delivery
Correlate pipeline disruptions with security events
Alert on system errors across distributed Cribl environments
Visualize infrastructure health inside Sentinel dashboards
Reference: Cribl Internal Logs documentation
Step 1. Enable Cribl Internal Logs as a Source
Inside Cribl Stream:
Navigate to Data → Sources → Cribl Internal Logs.
Enable the source.
By default, this source emits structured JSON events representing Cribl system telemetry.Decide on the event types and fields you want to include. Internal logs can be high-volume, so use filters or routes if needed to target the most relevant data.
You now have internal telemetry available inside Stream like any other source—ready to be routed to destinations.
Step 2. Prepare Microsoft Sentinel for a Custom Table
Instead of sending data to built-in tables (e.g., Syslog, CommonSecurityLog), we’ll create a custom table so that Cribl logs have their own schema.
This requires:
Data Collection Endpoint (DCE): Defines the ingestion endpoint for custom log data.
Data Collection Rule (DCR): Maps incoming data to a specific custom table.
High-level process:
In the Azure portal, open Microsoft Sentinel → Settings → Tables.
Select Create → Custom Log Table.
Define a table name (e.g.,
Cribl_InternalLogs_CL) and schema. You can keep the schema flexible by ingesting raw JSON into a single column or define specific fields.Azure automatically creates or associates a DCE and DCR as part of this process.
Copy the DCR Immutable ID and DCE URL—you’ll need these when configuring the Stream destination.
Review Microsoft’s documentation on Custom Logs in Microsoft Sentinel for a deeper dive into custom tables.
Step 3. Configure Cribl Stream Destination
Back in Cribl Stream:
Add a new Azure Monitor Logs destination.
In the configuration:
Enter the DCE URL from your Sentinel custom table setup.
Provide the DCR Immutable ID.
Specify the custom table name (e.g.,
Cribl_InternalLogs_CL).
Test the connection to confirm Stream can post events successfully.
Route your Internal Logs source to this new destination.
Step 4. Validate Data in Sentinel
After a few minutes, in Microsoft Sentinel, query the custom table:
Cribl_InternalLogs_CL
| take 10
Confirm that fields are being parsed as expected.
Adjust your DCR schema or Stream pipelines if you want more refined columns or enrichment.
Step 5. Enhance with Sentinel Content Hub
Microsoft has published a Cribl solution in the Sentinel Content Hub. This package provides:
Workbooks to visualize Cribl log activity
Analytics rules for common error or anomaly conditions
Hunting queries to accelerate investigation
You can install this solution directly from Sentinel’s Content Hub, then adapt the included rules to point at your custom table (Cribl_InternalLogs_CL) instead of built-in ones.
Comparing with Built-In Table Approaches
Cribl already documents how to integrate Stream with built-in Sentinel tables and in the use case guide. That path is ideal if you want to quickly land data into standardized tables.
This post focuses on a custom table workflow because it provides:
Greater control over schema
Isolation of Cribl’s operational telemetry from unrelated log types
Easier tuning of analytics and dashboards specific to Cribl
Conclusion
By routing Cribl Internal Logs to a custom table in Microsoft Sentinel, you create a dedicated operational telemetry stream within your SIEM. This unlocks deeper monitoring, alerting, and visualization opportunities—especially when combined with Microsoft’s Content Hub solution for Cribl.
With this setup, your teams gain real-time visibility into the health and behavior of your Cribl Stream deployment, directly inside the SOC’s primary workspace.
Next steps?
Explore the Cribl Internal Logs source.
Review Microsoft’s Cribl Content Hub solution for Sentinel.
Experiment with both built-in and custom table approaches to find the right fit for your observability strategy.


