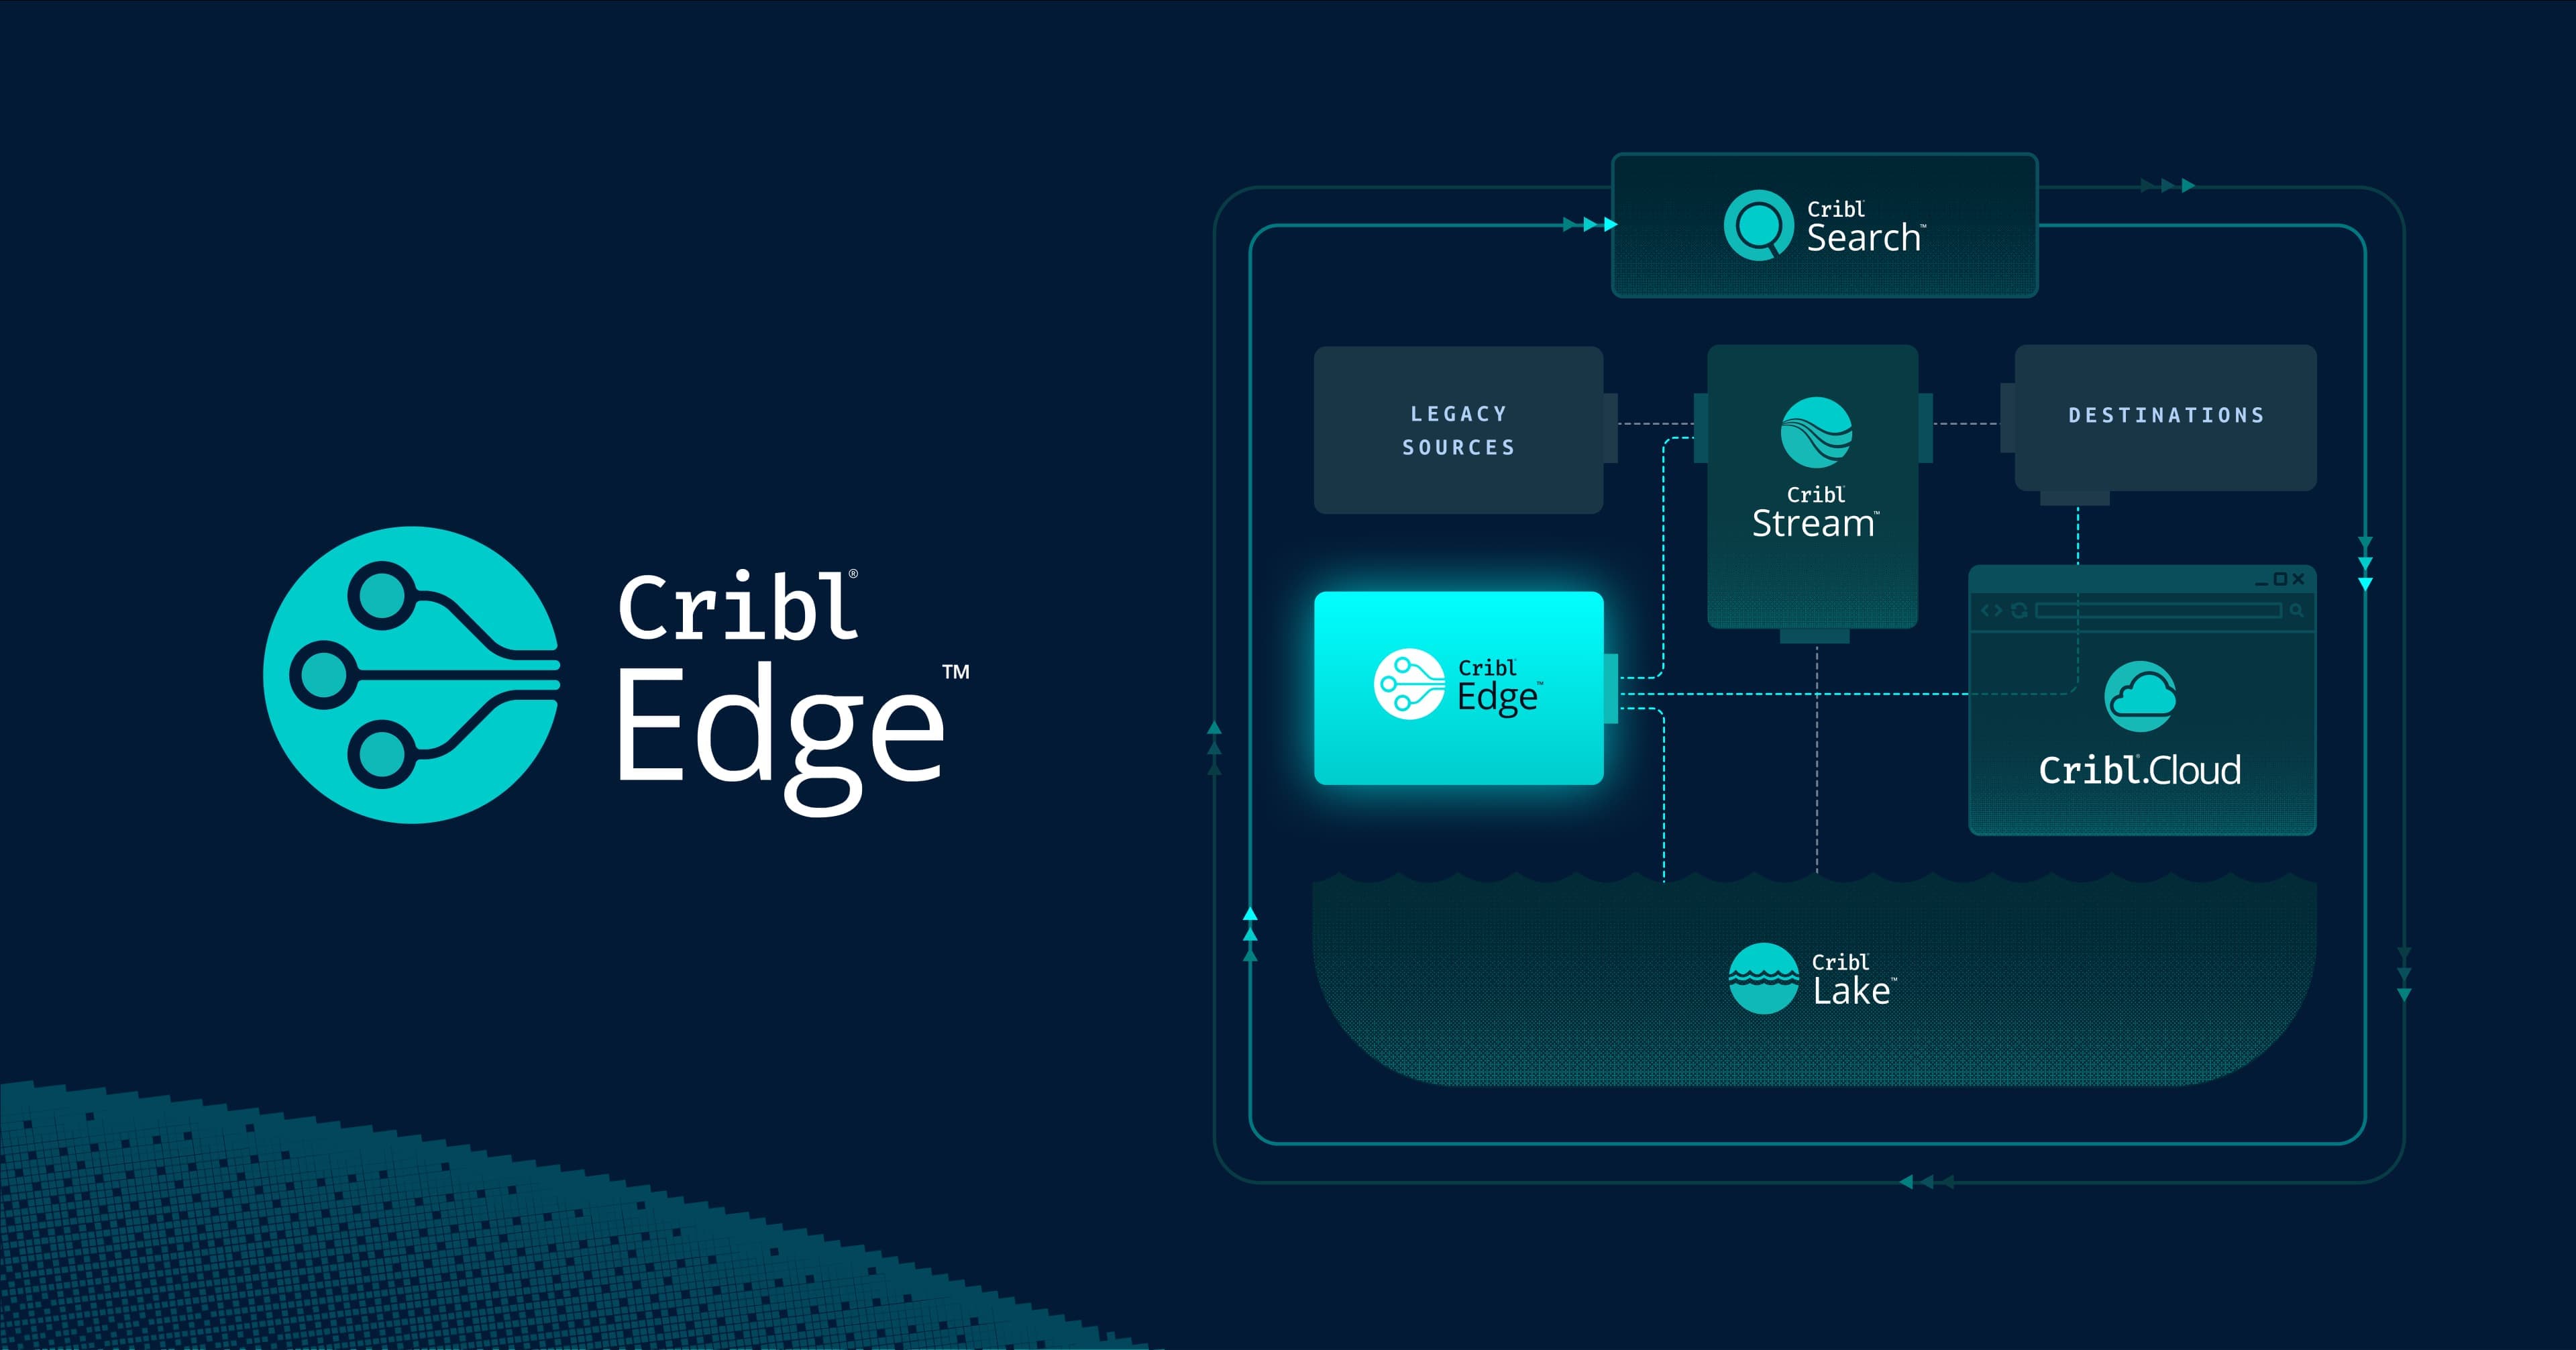
Cribl Edge can send data to OpenTelemetry in several different ways. In this blog post, we’ll focus on the OpenTelemetry Metrics. In the blog, we’ll talk about Cribl Edge, but what we say applies to Cribl Stream, too! We will cover how to use Cribl Edge to collect Linux System Metrics, transform them into the OTLP Metrics format, and deliver them to an OTLP Destination.
Why Collect OpenTelemetry Metrics?
The goals of collecting OpenTelemetry Metrics are centered around a few key objectives. First, it aims to enable the connection between metrics and other signals. For instance, this allows for the correlation of metrics and traces, providing richer insights. Additionally, OpenTelemetry aims to support existing metrics instrumentation protocols and standards. At a minimum, this includes full support for Prometheus and StatsD, ensuring that users can leverage OpenTelemetry clients and the Collector to collect and export metrics while maintaining the same level of functionality as their native clients.
Cribl Edge can help automate this conversion process from normal metrics to OpenTelemetry metrics.
Using Cribl Edge to Collect Metrics
Cribl Edge supports many options for collecting metrics, including Linux, Windows, Kubernetes, and more.
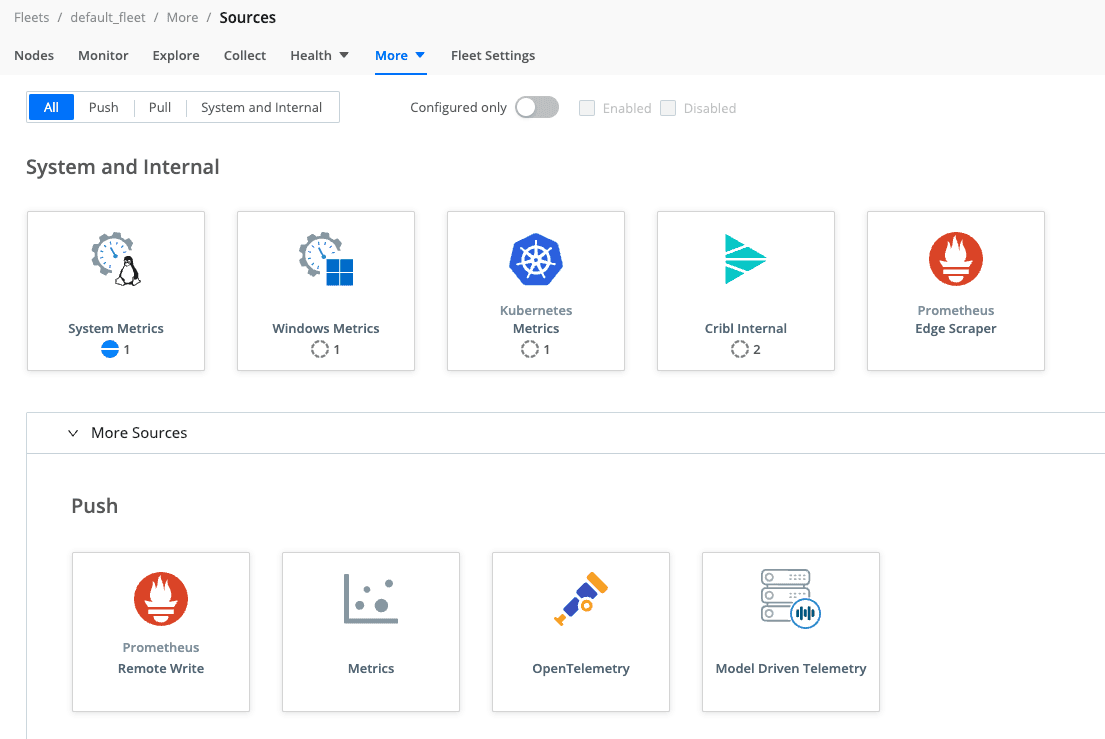
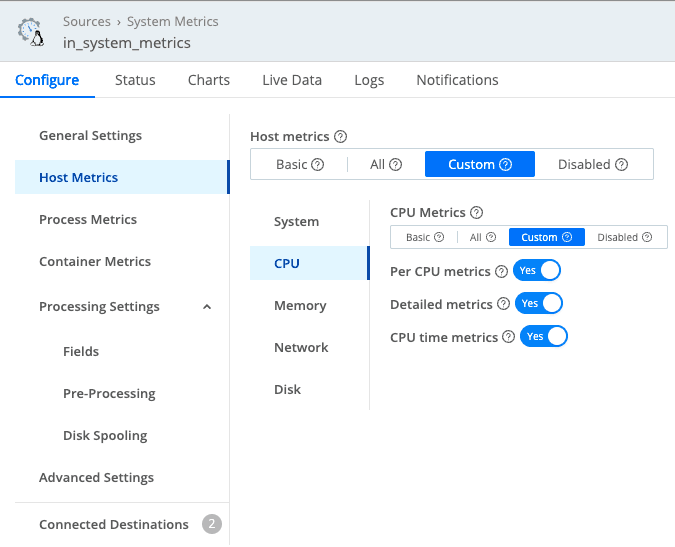
In this blog, I am using Cribl Edge with Linux System Metrics, for example, collecting the CPU metrics usage on the node.
Transforming Metrics Events into the OpenTelemetry Protocol Metrics Format
Adding a pipeline or a pack with the Cribl OTLP Metrics function will transform dimensional metrics events into the OpenTelemetry Protocol metrics format.
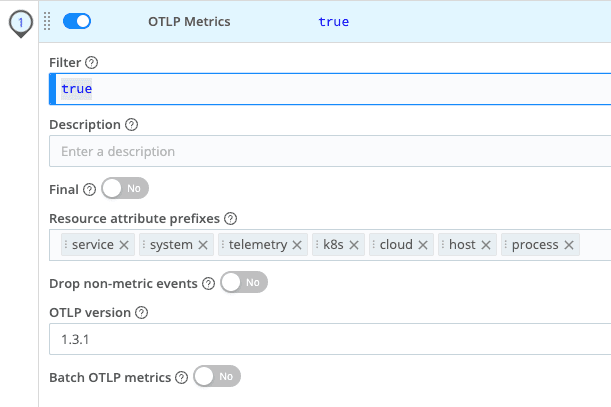
The OTLP Metrics function default behavior can take the live data and the original metrics event, for example, Idle CPU metrics, and transform it.
Before –

After –
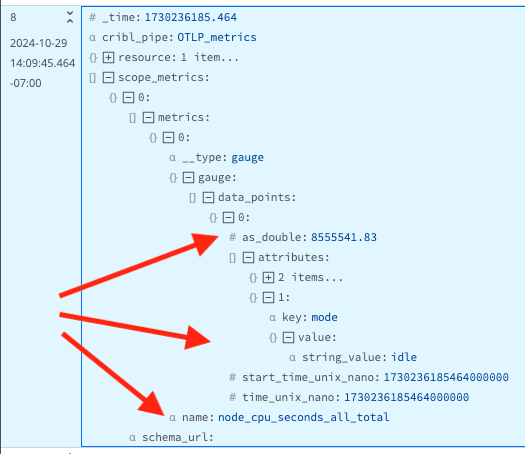
Also, Cribl OTLP Metrics supports the option to do batching.
Enabling the batching of OTLP Metrics by shared top-level `resource` attributes will combine many metrics attributes to fewer events.

Sending the Open Telemetry Protocol Metrics Format to the OTLP Metrics Destination
You can use Cribl Edge to route these newly transformed metrics events to any destination of your choice.
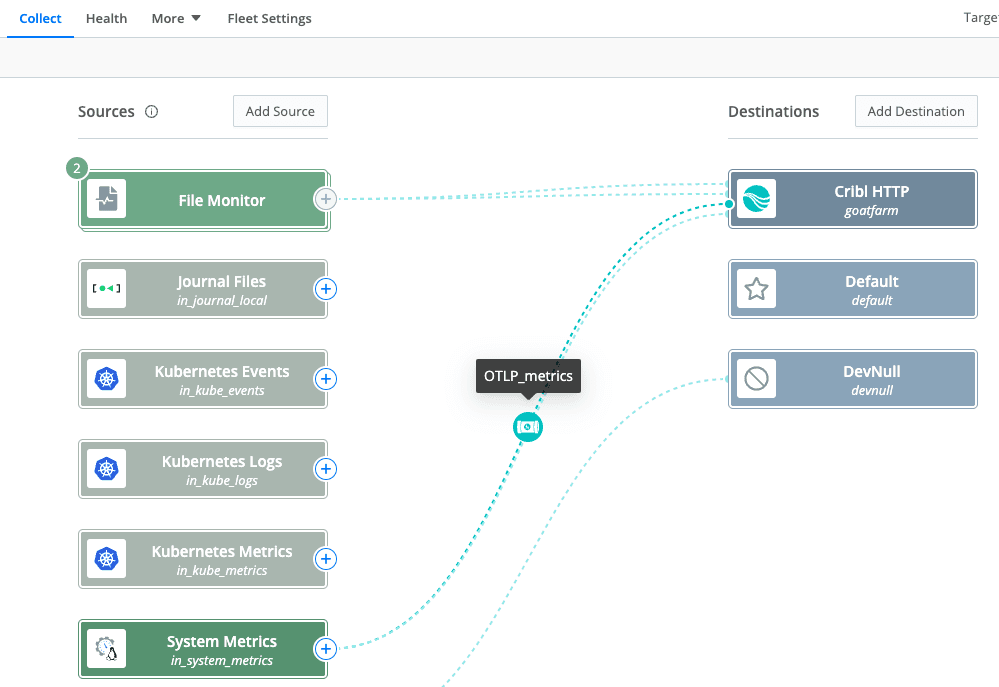
Cribl Edge streamlines the collection, transformation, and routing of OpenTelemetry Metrics. Whether you’re working with Linux System Metrics or data from environments like Windows or Kubernetes, Cribl Edge makes it easy to convert metrics into OTLP format and send them anywhere. If you’re looking for a scalable and efficient way to manage OTel data—or any telemetry data—Cribl Edge has you covered.
