Did you know you can deploy Tetragon and parse high-volume logs with Cribl Edge? It’s true! Tetragon integrates seamlessly with Cribl Edge. This combination enhances monitoring capabilities in Linux environments. Have your cake and eat it, too.
With a combined Cribl and Isovalent solution, you can deliver deep insights into your workloads, optimizing for your specific operational requirements with zero loss of data fidelity. Tetragon allows you to extract the right data from the kernel and Cribl Edge filters, transform, and deliver the right data to the right place at the right time.
In this blog post, I will explain how to deploy Tetragon and Cribl Edge on a Linux instance and explore some of the telemetry that can be captured from the Linux kernel with Tetragon. The demo walkthrough sets up the Tetragon agent (the open-source version) and Cribl Edge to collect, transform, and route the Tetragon logs to a backend observability platform.
To begin, let’s answer, “What is eBPF?”
The BPF Revolution
What is eBPF?
The eBPF documentation says it best:
“…eBPF is a revolutionary technology with origins in the Linux kernel that can run sandboxed programs in a privileged context such as the operating system kernel. It is used to safely and efficiently extend the kernel’s capabilities without requiring to change kernel source code or load kernel modules.”
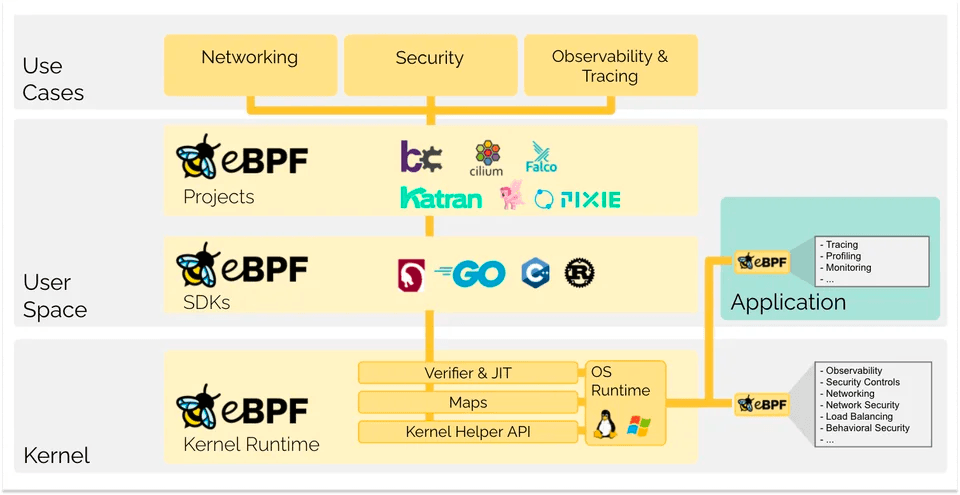
Still a little confused? The diagram below from eBPF.io helps clear it up. eBPF operates at the kernel level and is leveraged by SDKs and a growing landscape of projects, like Tetragon and Cilium from Isovalent, to gain network, security, and observability insights.
Tetragon 1.0
You have probably heard about eBPF (or just BPF to the purists) in the context of monitoring for Kubernetes or the APM observability space. The pitch? See every call your application makes without making a single change to your code base. That is certainly an exciting proposition, even if you are not currently thinking about Kubernetes!
When Isovalent announced the 1.0 release of their Tetragon agent, including support for ARM processors, BPF became accessible to engineers outside of the Kubernetes and application spaces with a package-based install option.
For infrastructure and operations engineers, Tetragon can unlock an understanding of your Linux-based operating environments in exciting new ways and offers instrumentation policies for a myriad of use cases:
Want to monitor TCP connections outside of specific CIDR ranges? There’s a policy for that!
Need to track SSH connections, including duration? There’s a policy for that, too!
What about privilege escalation to root for users and groups? Yeah, there’s a policy for that.
Tetragon provides detailed network monitoring and security insights, capturing logs about system calls, network connections, file access, system events, and more! Cribl Edge efficiently manages those logs as it filters, enriches, and routes the logs to a backend system for analysis and storage. Together, they offer a comprehensive view of system performance and security.
Making Space For The Data
Tetragon’s challenge isn’t finding the right data, it’s finding space for all the right data. Data volumes quickly spike when you shift monitoring to the kernel from head or tail-based tracing, sampled metrics, periodic polling intervals, or even application-defined logging output.
In the observability space, the prevailing thought has been to collect all data in a central environment where it can be queried, summarized, and eventually aged out to make room for the new telemetry. Filtering at the source is always recommended, but without Fleet management agents across hundreds of instances (or hundreds of thousands!) quickly results in configuration chaos.
By adding Cribl Edge to the mix, parsing and filtering at the point of collection rather than a centralized database, optimizes telemetry flows, reduces storage costs, and improves query performance across the reduced data set.
Why Should You Care?
If you are already using a log forwarder like Fluentbit, you might think, I’ll just add /var/log/tetragon/tetragon.log to my config and be done with it. That is an option, but here is what happens.
Tetragon logs are in JSON format but don’t include a message object, which many logging platforms usually require. Creating a message field by combining other fields in YAML and regex is often complex and sometimes unsupported. Defining and enforcing log standards, regardless of the source, shouldn’t be that hard.
Tetragon writes to the tetragon.log file by default. Each JSON object in the tetragon.log file varies in size but tends to be 2-3KB. On the test instance you will deploy in the demo, we measured 112 messages per minute without actual activity and no external applications. That is 0.32GB per day or 9.8GB per month per server for a lab server.
Let’s pause for a moment while you go check the price per GB to send logs to your preferred platform. Don’t worry. You don’t need to share your answer with us.
A verbose Tetragon profile or a misconfigured log forwarded could significantly increase logs being sent, increase costs, degrade performance, and add complexity when parsing the logs.
If you are wondering, “Should I even do eBPF-based monitoring? That log volume is a significant risk in our environment, and any unintended spike in log volume is going to be expensive”, the answer is “Yes, you can!”
Read on!
The Right Data, At The Right Place, At The Right Time
To fully understand each syscall, connection, file descriptor, and process, you need a solution tailored to answer detailed queries at any point in the data path. The Cribl product suite, built on the concept of a unified data engine engineered explicitly for IT and Security data, consists of Stream, Edge, and Search. Cribl offers complete control and flexibility to access, explore, discover, collect, and process data at scale as discreet products or as a holistic solution for observability telemetry.
Let’s look at each of the current offerings in more detail before moving on.
Cribl Edge, an agent for large-scale data collection, simplifies managing OS and application telemetry with centralized management that automatically detects and processes telemetry, deciding whether to send it to Cribl Stream or elsewhere. Why move complete debug logs to an expensive analytics store if they’re only useful temporarily? Edge allows users to directly interact with the endpoints and discover needed information before deciding whether to move it. In addition, Edge assists with agent consolidation efforts by providing robust centralized management and easily collecting and transforming data to send to a variety of destinations.
Cribl Stream is a robust streams processing engine focused on centralized parsing and processing of event data. Take any event source and use Stream to route, reduce, reformat, enrich, or otherwise structure data intended for any destination.
Cribl Search is an innovative new approach to finding and accessing data regardless of where it is landed and in any format. Search provides a federated solution built to separate the query engine from a storage medium. This delivers a unified query interface in a familiar and ergonomic pipe-delimited language that reaches into existing object stores filled with messy, unstructured, or structured datasets. It retrieves data without moving it or having to index it first. The same interface can also connect to APIs, databases, or existing tooling and combine results from all these disparate datasets.
Do We Have Your Attention?
“With great power comes great responsibility!”
– Stan Lee, Amazing Fantasy #15 (1962)
Okay, Stan probably wasn’t looking into the future to see the impact of eBPF as a new source of data in the observability and security space. Still, his words are no less prescient. eBPF unlocks a whole new world of visibility into Linux-based workloads (and soon Windows too!) and, with data forecasted to grow at 28% CAGR, according to the most recent IDC report – Worldwide IDC Global DataSphere Forecast, 2023-2027 – and adding kernel-centric observability telemetry is only going to exacerbate that growth.
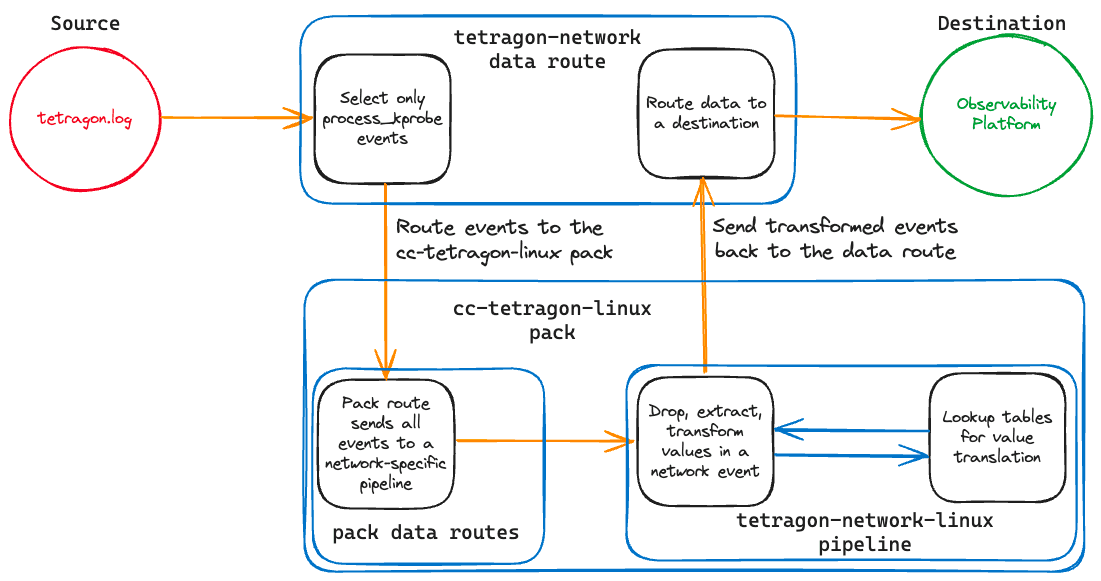
We will build a solution that looks like the diagram below to help mitigate this data risk while still capturing valuable insights from the kernel. Tetragon will write observations into a log file on a Linux host, and Cribl Edge will read those log entries and deliver them to a data route. Here is where things start to get interesting!
In our case, the data route enables a single stream of telemetry where Tetragon logs will be sent to the appropriate data pipeline. In our case, we will install a pre-built Pack from the Cribl Dispensary that will accept data from a route and decide whether it should be sent to a pipeline for processing or dropped entirely. The pipeline is where the magic happens! We will take robust, nested JSON objects and extract, transform, and enrich them, including using lookups to translate obscure kernel nomenclature into a common, more readable format, and perform DNS resolutions for the source and destination IP addresses.
The transformed and enriched logs will then be returned to the original data route, where we will send it to an observability platform. Or, if you are like many organizations, send the logs to a data lake for long-term storage, a security platform, and an observability platform. As promised, you can have your cake and eat it too.
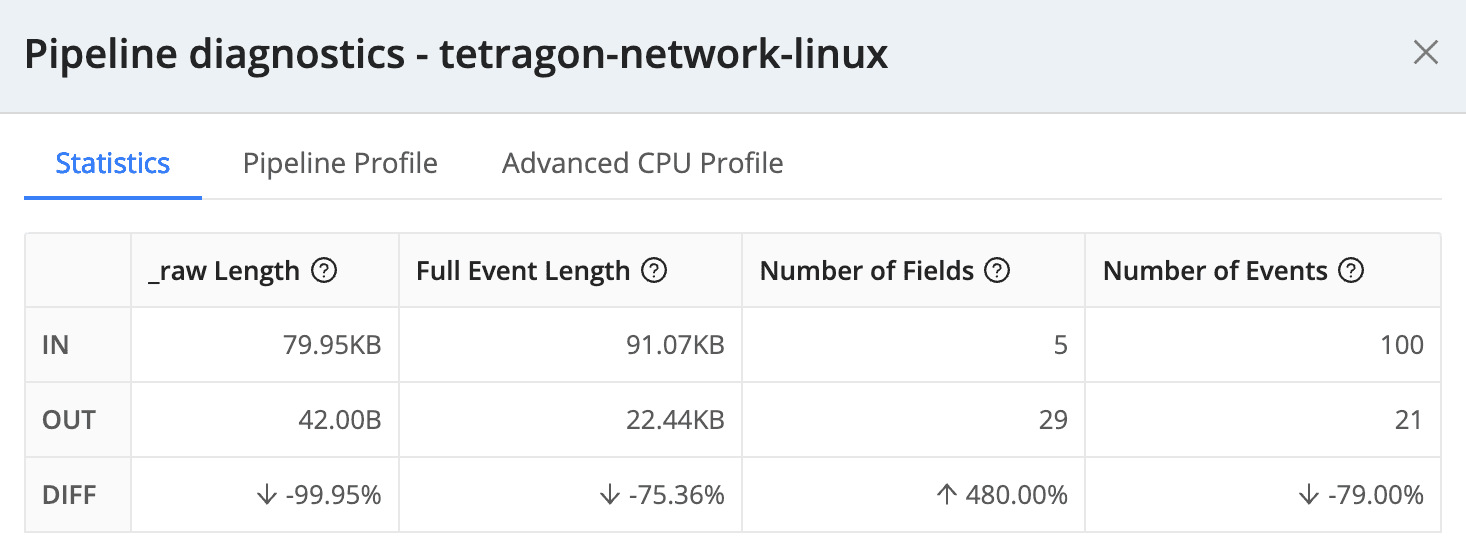
To set expectations, in our test environment, we achieved a 75% reduction in event length using the configurations in the demo walkthrough. In this limited sample set, we also saw a 79% reduction in total events. That’s a 94.8% reduction in total data ingest while normalizing Linux kernel event values to more human-readable values and performing DNS resolution on both source and destination addresses.
Ready to get started with Cribl Edge and Tetragon? Let’s GOAT!, as we say at Cribl. Check out the GitHub repo for a walkthrough on how to set it up.


