

In this blog post, we’ll demonstrate how to use Cribl Search for anomaly detection by finding statistical outliers in host CPU usage. By monitoring the “CPU Busy” metric, we can identify unusual spikes that may indicate malware penetration or high load/limiting conditions on customer-facing hosts. The best part? This simple but powerful analytic is easily adaptable to other metrics, making it a versatile tool for any data-driven organization.
Technology Background
Cribl’s innovative new search-in-place product, Cribl Search, empowers users to explore data without the need to index or ingest it into another system. With a query language called Kusto, Search enables distributed execution of analytics, returning results that are integrated and presented to the user.
For our purposes in this blog, we’re showing Cribl Search in action with the help of Cribl Edge. This agent-based system allows for the collection of host-based metrics and files on distributed hosts, making it the perfect complement to Cribl Search’s data exploration capabilities. Join us to learn how these powerful tools can help you easily access and analyze data, all without the need for costly indexing or ingestion. I’ve also embedded video below showing the process as well if you want to follow along.
Analytic Background
This analytic uses Z-Scores, which is a statistical property of a data set, using the mean and standard deviation. For some background on these mathematical concepts, you can check out this article and accompanying videos.
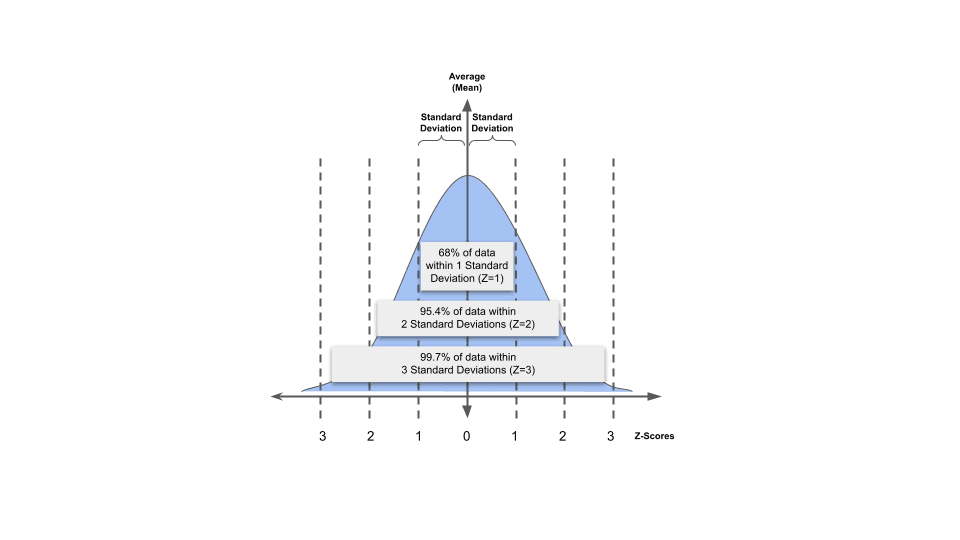
The quick summary is that for a given data set, we can easily compute the mean and standard deviation using the usual formula for them. Then you can define an envelope of data points that are “above” and “below” the mean by adding/subtracting that standard deviation to/from the mean. For example:
If you have a given set of data with a mean of 25 with a standard deviation of 5, the set of data points within ONE standard deviation would be those data points that are between 20 and 30 – that is, 25+5 and 25-5.
In this example, Z-Score would be equal to 1, because we’re creating thresholds of one standard deviation away from the mean (both up and down).
For a Z-score of 2, we can simply multiply the standard deviation by the desired z-score. Here, with a standard deviation of 5, for a Z-score of 2, we would use 2*5=10 as our threshold above and below the mean. So the upper bound is 25+10 = 35 and the lower bound is 25-10 = 15. Those are the thresholds for a Z-score of 2.

The idea is to choose a Z-score that finds statistically unusual events, based on the mean and standard deviation of the set.
Demo Environment / Scenario
Our demo environment for this scenario consists of:
Cribl Search, hosted in Cribl Cloud
Cribl Edge, hosted in Cribl Cloud
One Edge Node, hosted in Amazon AWS as an EC2 instance (t2.micro).
The Cribl Edge node software runs on the EC2 instance and is able to periodically report the system metrics of that system back to Cribl Cloud. Additionally, Cribl Search is able to query the Edge node for specific desired metrics. As mentioned above, this analytic uses the “% CPU Busy metric”, which is reported as “node_cpu_percent_active_all” by Edge.
This t2.micro host was not otherwise active during this test; however, it should be noted that querying Edge nodes via Search does in fact create a load in itself on that Edge node. Since this is a small, single CPU VM, that load was significant.
Additionally, specific artificial load was created on the t2.micro host using the following shell script:
$ yes > /dev/null &
This script would pin the CPU to 100% until the process was manually killed.
Cribl Search is connected to Cribl Edge via a Dataset Provider, specifically one that can communicate directly with Cribl Edge. Specific Edge nodes can be specified in a Search, and specific metrics provided by those Edge nodes can be used as result data in a Search.
Search Evolution process

The built-in Edge dataset was chosen in Search by specifying the search term
dataset=”cribl_edge_metrics’.The specific Edge node and metrics source was added to the search to limit the results of the search to the specific EC2 experimental host and desired metric,
node_cpu_percent_active_allThe timestatsquery operator was used to summarize the desired metric over ten-minute windows, generating the mean (average) and standard deviation, as well as the maximum data point in that window – the data point we’re using to test for anomalous behavior.The timestatsoperator was used for several calculations, including:Creating a field called
z_score, which was a constant. This can be set to anything convenient for the user; here it was set to 4 (meaning 4 standard deviations above/below the mean)Creating a field called
delta, which was calculated to be the standard deviation times the z-score.Creating fields called
env_hiandenv_lo, that were equal to the values of the mean plus or minus the delta field. This established the “envelope” of values expected to be “normal”, that is, within the range of values defined by the z-score.Creating a field called anomaly_flag, that was defined as a boolean (true/false) field which was set to 1 if the test data point (the maximum CPU %busy value in the 10-minute window, in our case) was higher than the env_hi field. (Note that we did not test the env_lo boundary.)
Updating the
env_hiandenv_lofields to create “practical” boundaries. No matter what the mathematical results of the z-score calculations, we want to set practical boundaries on the high envelope to be between 5% and 95% CPU, and the low envelope to be at least 1% CPU.Finally, creating a field called
anomaly_chartwhich will be used to visualize any anomalies found, using a different color.
The
project-awayoperator was used to remove the intermediate fields that we don’t need in our output data set.
The completed search with comments is shown here: https://pastebin.com/xwY84CZ6
This search was executed over 24 hours in our example.
After executing the search, the resulting chart was customized to achieve a striking visualization, in the following manner:
The
anomaly_flagfield was hidden from the chart.The
env_hiandenv_lowfields were rendered as area charts in a light color.The
cpu_maxfield was rendered as a bar chart in black.The
anomaly_chartfield was rendered as a bar chart in yellow.
Note that due to a bug, zero-value data points are rendered visually on the chart, so the y-axis-minimum was set to 1 to visually hide those elements.
How to Customize / Make It Your Own
The algorithm shown here can apply to just about any metrics you might be able to find in your data that has a “usual” range, with occasional “anomalies”.
You can customize this metric by simply substituting a search for your own data element in the first stanza of the pipeline, and then targeting it in the timestats operator in the second stanza. (You may also want to rename it to something more descriptive if cpu_max isn’t appropriate.)
The Z-Score you choose is also relative to the variability of your specifically chosen metric. Generally, it’s good to start at 3 and explore how many anomalies you get with that.
Also, note that the practical limits added to the CPU metric might be different depending on the actual metrics chosen. If, for example, you’re looking at Network Interface statistics, you might want to choose a fraction of the bandwidth (like 1 Mbps and 950 Mbps for a 1Gbps NIC). These practical limits can be omitted entirely but may result in computational anomalies. Also, note that the env_lo boundary should be enabled for metrics that would not be expected to vary down to zero.
Future Directions
Cribl Search is revolutionizing data analysis by enabling insights without the need for data transport or ingestion. As a newly-developed product, there are many exciting directions we plan to explore.
For example, we’re considering incorporating alerting capabilities into our product, allowing users to be alerted reactively when the current metric falls outside the z-score envelope. Additionally, we’re exploring ways to perform this analysis on multiple hosts simultaneously and alert on any metric anomalies found.
While the current version of Search computes the standard deviation and mean over the same window as the analytic, future versions may allow for varying analytic windows within a given data set. This would reduce edge conditions at the boundary of the window, enabling even more accurate analysis.
Thank you for reading this blog post! If you have any questions or comments, please don’t hesitate to reach out to our team on #search on the Cribl Community!
The fastest way to get started with Cribl Stream, Edge, and Search is to try the Free Cloud Sandboxes.