
The SIEM returns an empty search to the crew, woo woo woo
What's that you say, Mr Firewall, Davie Null has taken them all away, hey hey hey
How do you identify when an event has stopped being received by your analysis tier?
This seemingly simple question is one of the most common o11y admins have. Answering it is not always so easy however. Move along if anyone offers a solution that sounds something like "why don't you just…" False positives lurk around every corner. Not to mention looking back over hours or days of data can be costly. Shortening that window means more false positives, and worse, more false negatives.
Back in my days as a log-jocky, my solution was to run periodic, scheduled searches to collect up the last seen time by host, or event type, or matching pattern. Then store those results back into the expensive analysis tier. Finally, another scheduled search would run over that simplified data set, over a longer window, to identify hosts or event types that have not been received recently. While this worked reasonably well I was burning resources collecting up the timing info, storing it, and then re-searching. It was not a cost-effective solution.
I'm going to offer a better solution below, but first, let's lay out the old method as Exhibit A in the context of Cribl Lake and Cribl Search. Why revisit this? As you'll see, we're going to use the structure of the aggregations we develop in Search as a basis for the aggregations we define in Stream. (spoiler!)
Periodic Collection, Aggregation and (re-)Storage
Storage
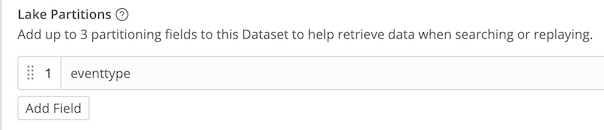
First, identify or create the holding tank for the post-aggregation data. In Cribl Lake, I have a "my_metrics" dataset where stuff like this lands. This data will not generate a lot of volume, so this relatively small amount will fit fine. Notably, my_metrics is assumed to be JSON formatted data, so my existing datatype and parser settings won't need updating.
Tip: For extra speedy results, I've included eventtype as a partition in my bucket path in the Lake Dataset definition. I generally do this for all my datasets, not just this case.
The Collection Search
Start with identifying the identifier(s) you're wanting to track. Use extend, project and summarize to modify, transform, and narrow the data down to just the bare minimum required. For the summarize portion, capture the max (latest) _time value grouped by some number of dimensions. The coarsest I'd recommend is to go by host. You could use source, or even arbitrarily assign tags earlier in the search string. Your search should end with something like this:
| summarize events=count(), last_seen=max(_time) by host
or this
| summarize events=count(), last_seen=max(_time) by source
or this
| summarize events=count(), last_seen=max(_time) by host, source
I'd caution against going crazy with the by clause. Higher cardinality will increase the record count, and add more potential for false, or missed, alerts. All you want here is an identifier for the thing you’re tracking.
Validate your results at this point. Is it what you expected? You should have 1 or more columns of dimensions – host, source, etc – and 1 column of time represented as seconds since epoch. In other words, for each combo of dimensions, when was the last time we saw an event?
Super dupe. Now add an eventtype tag to it using the project command, so our partition in Lake gets the benefit of this field. The final step would be to export this data into Cribl Lake. We tack on another piped command, like this:
| summarize events=count(), last_seen=max(_time) by host, source
| project eventtype="last_seens"
| export to my_metrics
It's so easy, right?! Each run of this search will now output the resulting table into Cribl Lake, as JSON data.
Our collection/aggregation search is ready. At this point I'd save and schedule it to run once an hour looking back over the last hour.
The Alerting Search
After you get a few runs stored in Lake, run a new search to check the results. Note that the summarize command here should usually align with the summarize command results you used above. But you can absolutely modify it as desired – for instance you should look across multiple summarizations to avoid false hits from a temporary glitch. Also note I'm referencing the events field as we renamed above.
dataset="my_metrics" eventtype="lastseens" earliest =-1d
| summarize events=sum(events), last_seen=max(last_seen) by host, source
| project age=now()-last_seen
The last line of this search is to create a new field called age, which will show the difference between the current time, and the last time a particular host + type combo showed its face. After exploring this data to validate, try adding a where clause to show only those that are concerningly late. In this case I'm looking for any ages showing older than 3 hours (3 x 3600s):
| where age > (3 * 3600)
The age filter here will be critically chosen by you, the operator, and steered by your particular use case and profile of your servers.
Our last step for this phase would be to schedule this search, and have it alert you when there are any matches (after that last where clause). Don't forget maintenance windows!
Note that the further back you run the alert search window, the more "memory" it has. If a host stopped reporting 2 days ago, and you run the search for only 1 day, the contents of the search won't contain any data with the host in it. No alert! You need to think about the ramifications and adjust your search window and alerting threshold accordingly. In any case the alert search time window should always be several times the size of the collection window. I'd say at least 20x.
This process is fine. It's what I used to track flapping/failing agents for a decade in my last job. What if we could do it better? What if we moved the initial, resource-intensive, Collection search to Stream? In flight. With minimal overhead.
In-flight Aggregation and Storage With Cribl Stream
In the above instructions, we're going to rip out everything in the Collection Search section. In its place…
In Cribl Stream, add a new pipeline called last_seen_aggs. If you need to extract or define a new field that you'll base the aggregation on, add that to the pipeline first. Next, add an Aggregations function something like below:
Filter: true
Time window: 10m
Aggregates:
count().as(events)max(_time).as(last_seen)
Group by fields: host source
Evaluate fields: eventtype => 'last_seens'
With this function we've created roughly the same stats we created in the Collection Search section above. You can adjust the settings as you require. Increasing the Time window will result in fewer, larger files written, and faster searches, but at the cost of some memory. Likely not a huge amount. Making it smaller will result in smaller, more numerous files, resulting in slower searches.
The Group by fields are the dimensions we're tracking last_seen by. In the example above we used host and source.
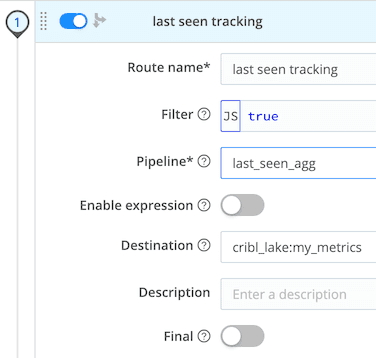
Add a new Route under Routes -> Data routes. For the Route Filter you can set it so it matches only the subset of data you want to monitor. Or literally true if you want it on all data. Select last_seen_aggs as the pipeline, and your metrics storage area in object store or Cribl Data Lake. Be sure the Final flag is NOT checked, so we are not interfering with other uses of the data. Finally slide it up to the top of your Routing table.
That's it. We've recreated effectively the same flow of data into Lake that we had via the search. There will be overlap here, as each Cribl process will create their own aggregated data, but the amount of data is so small, we're talking fractions of pennies, it shouldn't factor. And the structure of the scheduled, alerting, search correctly handles duplicate datasets.
Conclusion
Observability in modern enterprise systems presents challenges, even for seemingly straightforward questions like identifying missing log sources. While traditional methods of periodic data collection and re-storage can work, they are often resource-intensive and costly.
By leveraging Cribl's capabilities, particularly Stream for in-flight aggregation and Lake for cost-effective storage, organizations can achieve a more efficient and performant solution. This approach allows for real-time monitoring of log source availability, transforming a complicated problem into a streamlined and reliable process for maintaining full visibility into system events.
Post-credit Scene
Lakehouse is the newest piece of the Cribl Suite pie. It offers massively accelerated searching of data, up to 30 days old (for now). For datasets that you choose to accelerate, searches can run in as little as 1% of the time a normal search would take, transparently. And it's so easy: Enable a Lakehouse subscription in the Cloud control panel, and attach it to a dataset. Done. Any new data showing up will be automatically accelerated. It really is the easy button for wicked-fast searches. But only for the datasets you explicitly choose. Not all data has equal value!
If you already have use for faster searching of some pieces of your data, it may make sense to include this tiny bit of accelerated data in the Lakehouse store to improve search times. However, given that the smallest Lakehouse offering is 600 GB per day, I wouldn't recommend standing up Lakehouse just for this use case unless you approach that volume.