Introduction: From monolithic stacks to telemetry‑as‑a‑service
If you run a central logging or telemetry platform team today, you live in constant tension. On one side, log and event volume keeps growing faster than your budget. On another, every app and security team wants their data handled their way, in their tools, on their timelines. On a third, compliance, audit, and risk teams expect full coverage and clean governance, while your SIEM and observability platforms complain about ingest limits and license pressure.
Meanwhile, your sources are anything but uniform. Developer teams are pushing OpenTelemetry logs, metrics, and traces through SDKs and auto‑instrumentation, even though logging formats may not be consistent. Network, firewall, and legacy platforms still speak syslog. Cloud providers send you flows, audit logs, events, and metrics in their own shapes and schemas. Endpoints and servers spit out Windows Event Logs, Linux syslog, and container runtime logs. SaaS apps expose audit data via APIs and webhooks, each with its own model.
Developers often cut out centralized logging teams, sending OTel to destinations of their own choosing to get visibility to their telemetry in production. But that leads to developers spending their time becoming part-time observability engineers. Worse, there’s no safety check to ensure PII, API keys and other telemetry are redacted, and there’s probably little compliance in terms of log retention.
This guide is about escaping shadow logging, brittle logging systems, and moving toward a telemetry‑as‑a‑service model. Instead of wiring every source directly into one or two favored tools, you create a vendor‑neutral data plane where you centralize control over schemas, routing, compliance, and cost. At the same time, you’re, decentralizing access so application, SRE, and security teams can actually use their data without filing tickets for every change.
We’ll focus on practical architectures built around OpenTelemetry (OTel) and Cribl’s data engine (Edge, Stream, Lake, and Search). The goal is to move from fragile, one‑off pipelines and shadow logging to a governed, multi‑tenant shared service that scales with your organization and sets you up for AI‑driven investigations down the line.
Who this guide is for and what you’ll get
This guide is written for teams who sit at the center of telemetry in large, complex environments. In practice, that’s usually four overlapping groups.
The first is the centralized logging or telemetry platform team in infrastructure or IT operations. This team owns shared services for collecting logs, metrics, and events across applications, infrastructure, and SaaS, and is responsible for reliably delivering that data into SIEMs, observability platforms, data lakes, and compliance archives.
The second are the many developer teams building and support services. Increasingly, developers are instrumenting their services to use OpenTelemetry to generate and send metrics, logs, and traces to destinations that have been configured in the OTel collector.
The third are observability, SRE, and platform engineering centers of excellence. These groups run the common telemetry platforms used by hundreds or thousands of app teams. They feel the impact when pipelines are brittle, when schema drift makes dashboards unreliable, or when every new service requires a bespoke integration.
The fourth are security and cyber observability teams who depend on a governed, high‑fidelity logging plane to keep SIEM and security analytics costs in check, while expanding coverage and supporting multi‑SIEM or migration strategies.
If you sit in any of these seats, you’re probably being asked to do some version of the same job:
Standardize logging across many business units, regions, and tools without breaking running systems.
Keep SIEM and observability costs flat while onboarding more data and more teams.
Give developers, SREs, and SecOps real visibility into production logs without handing them the keys to every pipeline.
Get ready for AI in your NOC and SOC
By the end of this guide, you’ll have three reference architectures for modern centralized logging built around OTel collectors and Cribl: a single‑region OTel‑first design and concrete patterns for syslog, endpoints, and SaaS at scale. You’ll also get a step‑by‑step implementation playbook for moving from today’s brownfield mess toward a shared service without a big‑bang replatform, guidance on governance and PII handling, and an operational checklist you can use to benchmark where you are today and what to prioritize next.
We’ll keep the jargon light, stick to patterns that already work in large enterprises, and be honest about trade‑offs along the way.
Architecture principles for modern central logging
Before we get into diagrams, it is worth grounding on a few principles. These are the design decisions that show up again and again in successful centralized logging programs. If a proposal fights one of these, it tends to hurt later.
Central control, local autonomy.
The central team owns schemas, governance, “golden” pipelines, and cost controls. Application, SRE, and SecOps teams get scoped workspaces and self‑service within those guardrails. In practice, that means a multi‑workspace control plane with role‑based access, not a single giant config file that everyone edits by hand.
Vendor‑neutral data plane.
Sources should not be wired directly to tools. Agents, collectors, and appliances send telemetry into a Cribl‑powered data plane; Cribl fans out to SIEMs, observability tools, data lakes, and archives. When a team wants to add a new tool or migrate away from an old one, you change routing rules — not every agent on every host.
OTel‑first, backwards‑compatible.
OTel gives you a common language for logs, metrics, and traces. Treat the combination of OTel collectors plus Cribl Edge as your default on‑ramp for new workloads, but accept that syslog, legacy agents, and proprietary formats will be with you for a long time. The goal is a steady move toward OTel, not a disruptive overnight cutover.
Tiered storage and replay instead of “index everything.”
Hot data lives in SIEM and observability platforms for real‑time workflows. Warm and cold data lands in Cribl Lake or other object storage, where Cribl Search can query it directly and Cribl Stream can replay it into tools as needed. You keep more detail for longer, but only pay hot‑tier prices for what truly needs to be hot.
Governance built into the pipeline.
PII detection, masking, and tokenization belong in the pipeline, not scattered across services and dashboards. Workspaces, RBAC, and event‑level controls make it possible to run a multi‑tenant service safely. Git‑backed config, Packs, and Projects give you change history and repeatable promotion paths, so you can treat logging infrastructure like any other critical system.
Those five ideas show up in these two architectures that follow:
Reference architecture 1: OTel‑first centralized logging (single region)
The first architecture assumes a single primary region where most of your logging and observability tooling lives. The goal is to create a consistent, OTel‑aligned logging architecture in that region, with Cribl acting as the control plane between sources and tools.
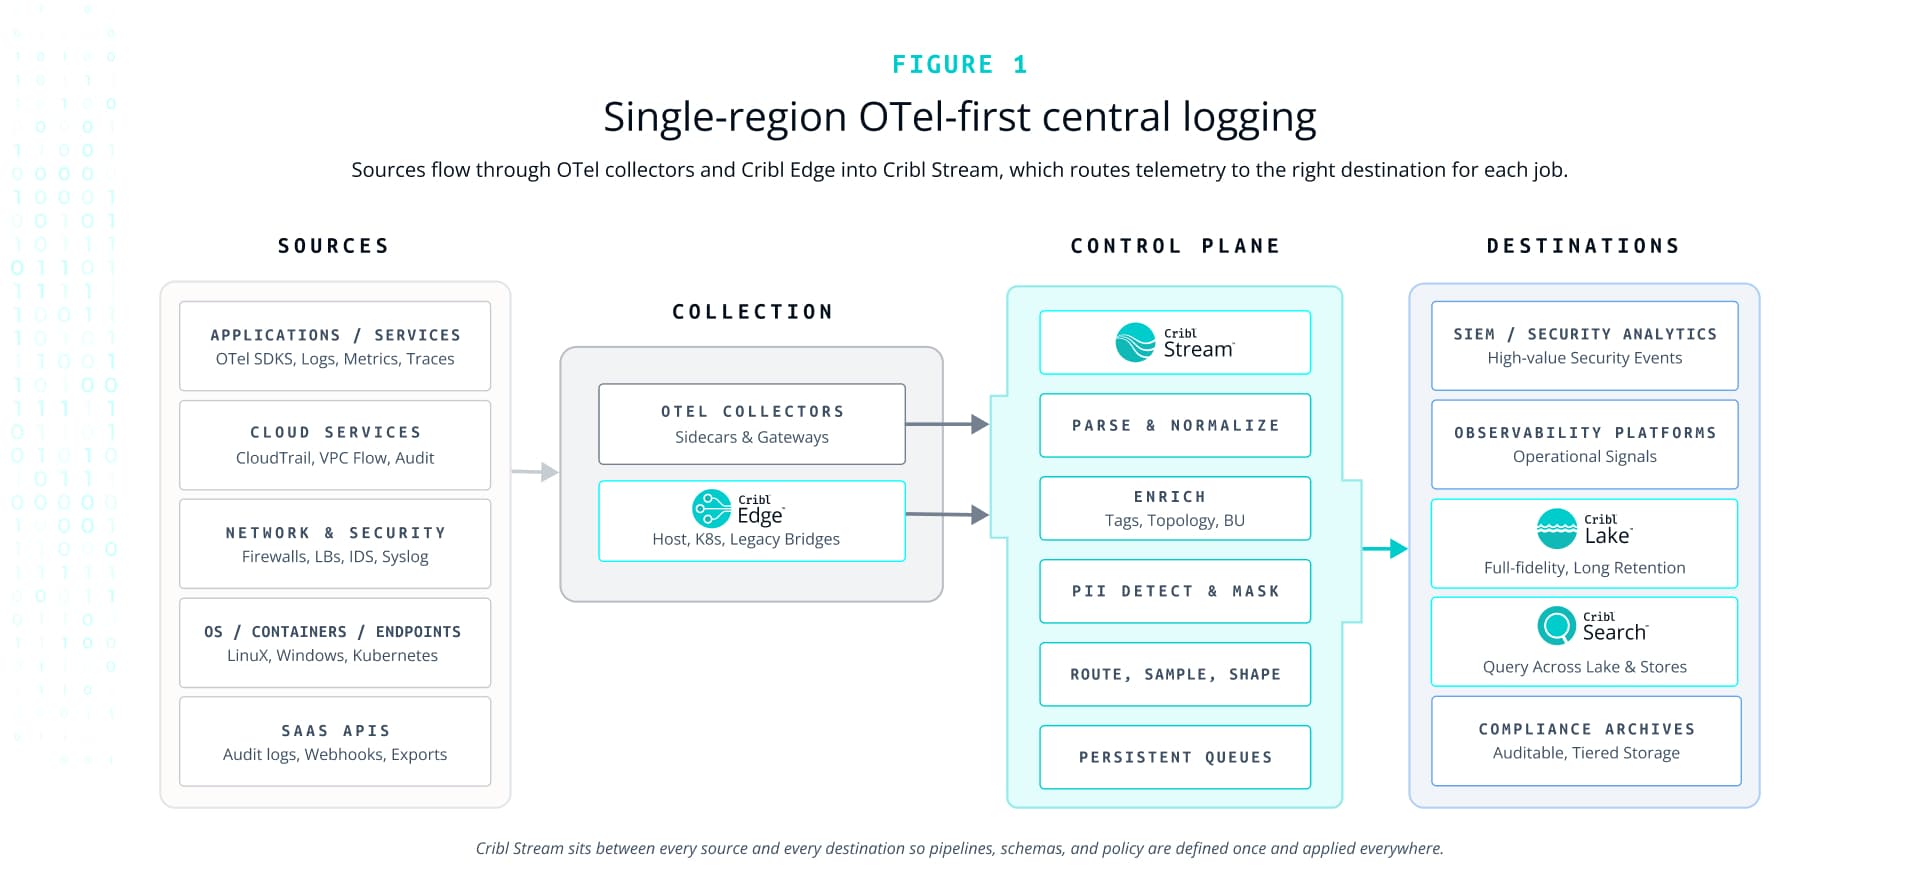
Figure 1: Single‑region OTel‑first architecture
High‑level data flow
In this model, applications and services emit telemetry in a few main ways. Newer workloads use OTel SDKs and auto‑instrumentation to send logs, metrics, and traces. Older workloads rely on existing agents, syslog, or native integrations. Infrastructure and cloud services produce their own mix of logs and metrics — from CloudTrail and audit logs to network flows and OS logs.
OTel collectors act as the default collection layer for OTel‑capable workloads. They run as sidecars, DaemonSets, or host agents, receiving OTel signals from instrumented services and forwarding them in OTel’s native OTLP format. For sources that do not speak OTel cleanly — endpoints, servers, appliances — you deploy Cribl Edge close to the source. Edge normalizes formats, adds basic enrichment, and filters noise before forwarding to the central plane.
All of this telemetry flows into Cribl Stream, which acts as the central processing tier. Stream applies parsing and normalization to create consistent event structures. It enriches logs with metadata such as environment, service, business unit, or region. It runs PII detection and masking rules so sensitive data is handled consistently. Finally, it evaluates routing and optimization rules that decide which events go to which tools, at what level of detail.
On the destination side, you fan out based on use case. High‑value security events and normalized audit logs go to SIEM and security analytics platforms. Operationally critical logs and metrics go to observability tools and APM. Full‑fidelity or near‑full‑fidelity telemetry lands in Cribl Lake, backed by object storage, for low‑cost, long‑term retention. Cribl Search sits alongside these targets, providing a single search interface that can query Lake directly as well as other connected stores, so teams can investigate without re‑indexing everything into your most expensive platforms.
What changes for each team
For application and development teams, this architecture replaces guesswork with clear contracts. If they log in a documented format and send data to a specific endpoint — usually via an OTel collector or Cribl Edge — they know where those logs will show up and how they will be enriched. They spend less time reinventing per‑service logging patterns or filing tickets just to see their own data. With governed access to Cribl Search over Lake, they can investigate their own services without needing admin rights to the SIEM or production observability tools.
For the central logging team, you now have a single logical place — Cribl Stream — to implement and evolve standards, instead of a sprawl of custom pipelines hidden in various repos and configs. You can shape cost centrally by dropping or sampling low‑value events, normalizing schemas across sources, and routing only the necessary subsets into expensive tools. When the organization wants to add a new analytics platform or migrate off an old one, you adjust routing in the data plane rather than touching thousands of agents.
For security and compliance, the OTel‑first architecture offers consistent handling of PII and sensitive data at the pipeline layer instead of relying on each service owner to “do the right thing.” SIEM coverage improves because more sources feed into normalized pipelines, while Lake provides cheap retention for data you cannot afford to index. Git‑backed configuration, Packs, and RBAC give you auditable change history: you can answer when a specific transformation was introduced, why volume changed for a given source, and who has access to which datasets.
Practically speaking, this is the Day 1 architecture most organizations aim for: a single‑region, OTel‑aware control plane where you can prove out golden pipelines, self‑service, and cost controls before you start replicating the pattern globally.
Reference architecture 2: Syslog, endpoints, and SaaS at scale
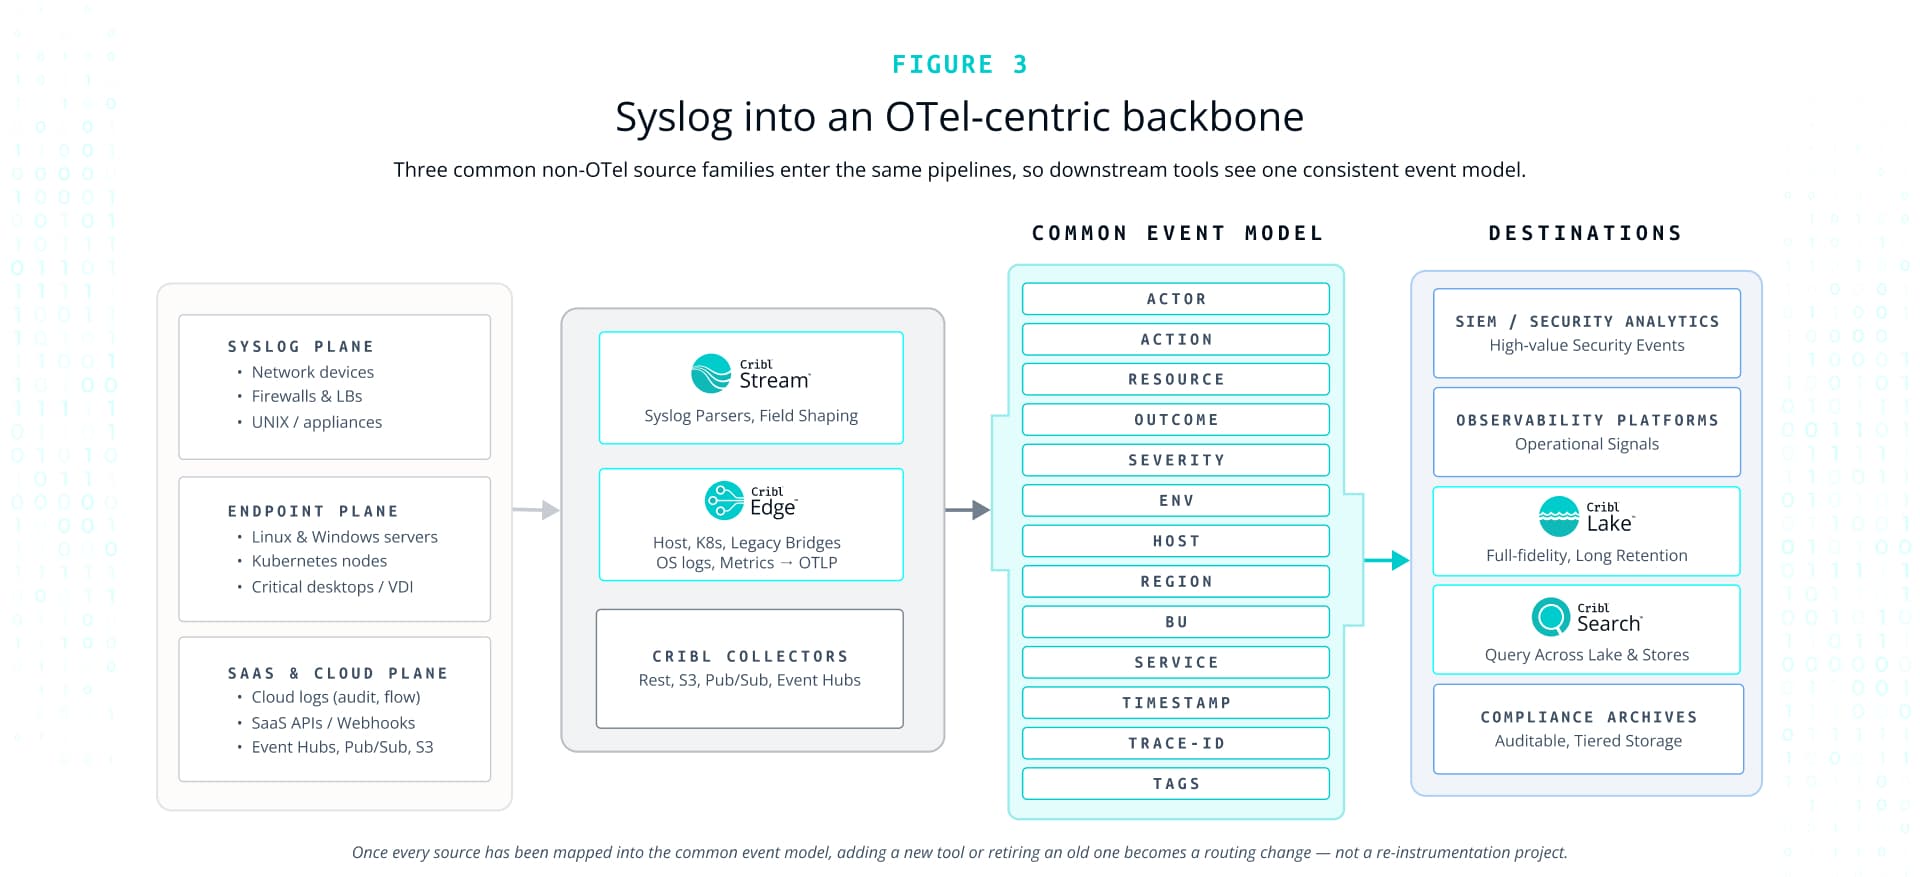
OpenTelemetry is a big part of the future, but it is not the whole story. A lot of your most important telemetry — network flows, firewall logs, Windows Event logs, SaaS audit data — will never come from an OTel SDK. This architecture shows how to bring that data into the same control plane without waiting for perfect OTel coverage.
Centralized syslog pattern
Most network devices, firewalls, and appliances speak syslog. In a Cribl‑centric design, those devices send syslog either to regional Cribl Edge nodes, which perform local parsing, filtering, and tag enrichment, or directly to Cribl Stream syslog sources.
Cribl Stream then normalizes incoming syslog messages into your standard event model. That usually means extracting structured fields for host, facility, severity, app, and message, aligning timestamps and time zones, and mapping into a shared schema that downstream tools understand. Where it helps, you can map key syslog families into OTel log conventions, but that is an implementation detail rather than a requirement.
From there, syslog events follow the same pattern as any other log family. High‑value security events route to SIEM, operational events route to observability platforms, and full‑detail or compressed feeds go to Lake for long‑term retention and later investigation. The advantage is less about the protocol and more about the fact that syslog is now just another log family in your golden pipelines, not a special‑case ecosystem.
Endpoint and server pattern
Endpoints are where a lot of incidents start, and also the first place people blame when logs go missing. You want a pattern that is predictable and repeatable.
Cribl Edge runs on Windows, Linux, and macOS as a lightweight forwarder and local processor. On servers and VMs, Edge can collect OS logs, Windows Event Logs, selected application logs, and system metrics. On Kubernetes nodes, it can cover both host and container logs. In VDI or desktop scenarios, it can capture the small but important set of events you care about without overwhelming central pipelines.
Edge applies first‑hop filtering close to the source — for example, dropping verbose debug logs except on whitelisted hosts or for specific time windows. It normalizes events and tags them with environment, region, application, and other context before forwarding to Cribl Stream or directly to destinations where appropriate. For host metrics, Edge can also convert native formats into OTLP Metrics when you need them in an OTel‑aware backend.
The result is a single pattern for endpoints and servers that feeds into the same pipelines as your application and network telemetry, instead of a completely separate forwarding stack.
SaaS and cloud services pattern
SaaS and cloud providers are going to do what they are going to do with their telemetry formats. Your job is to normalize them and bring them under the same governance model without creating a zoo of one‑off integrations.
Most large organizations rely on a mix of cloud logs (CloudTrail or equivalent, platform audit logs, VPC or VNet flow logs) and SaaS audit feeds. Those typically arrive via native cloud mechanisms (S3 notifications, Pub/Sub, Event Hubs), HTTP event collectors, or periodic API pulls. Cribl Stream and Cribl Edge both have source types designed to ingest from these channels.
Once the data is in the pipeline, you normalize it into consistent schemas: actor, action, resource, outcome, geo, device, and any business‑specific dimensions you care about. That allows security analytics and observability tools to work with cross‑SaaS and cloud events without constant re‑mapping. It also means you can land full‑fidelity feeds in Lake and use Cribl Search for investigations that span multiple providers and long time horizons.
Where OTel appears — some cloud and SaaS services are starting to emit OTel‑compatible telemetry — you treat those like any other OTel source. Where it does not, you let Cribl do the heavy lifting to map them into your standards.
Implementation playbook: from brownfield to shared service
Architectures are nice. Getting from today’s reality to something like them is the hard part. The organizations that succeed treat central logging as a series of focused upgrades rather than a single heroic replatform.
Who needs to be in the room
Before OpenTelemetry becomes the default path for metrics, logs, and traces, you need a small, empowered group aligned on scope and goals. Platform/observability/SRE teams own the Collector topology and default pipelines. App teams decide how services are instrumented and which ones go first. Security and compliance review payload content, redaction, and how attributes support risk tracking. Cloud/infra/Kubernetes teams determine where collectors run and how traffic reaches them. FinOps sets guardrails on cardinality, sampling, and retention so costs don’t explode. Tool owners for APM, logging, metrics, and SIEM confirm OTel data doesn’t break existing dashboards or workflows.
What you need alignment on
The group should agree on clear objectives — such as faster MTTR, a single view for SREs and devs, or vendor flexibility — then lock in a data model based on OTel semantic conventions plus a few organization-specific attributes (service name, environment, team, tier). They need a shared pipeline and routing design: collector patterns, which backends get which signal types, and how different audiences (ops, security, archive) receive data. Cost controls must be explicit: trace sampling strategy, allowed metric labels, and log filtering. Security and privacy rules become hard requirements in the pipeline — no credentials or sensitive payloads, TLS everywhere, and role-based access to telemetry. Operational ownership should be unambiguous: who runs and monitors collectors, who is on call, who approves new exporters, and what SLOs apply to the telemetry stack.
How you’ll roll it out
Rollout should be phased and deliberate. Start with a small set of services or a single environment, use auto-instrumentation for quick coverage, and add manual instrumentation where you need depth. Define success criteria for each phase (for example, “all tier-1 services emitting standardized traces” or “incidents routinely use OTel views”) and require those before expanding scope. Plan coexistence with legacy agents up front: how long both run, how you validate parity, and when to cut over. Wrap it with basic enablement — —short training for developers, SREs, and security analysts — —plus updated incident playbooks that assume OTel as the primary path from metric spike to trace to log.
Step 2: Pick a small, concrete first win
Centralized logging programs stall when they start with “everything.” A better pattern is to pick a narrow, painful slice where you can show real improvement quickly: a single noisy application that regularly blows up SIEM or observability bills, a compliance‑sensitive data source with poor PII handling, or a recurring incident pattern where you lacked the right logs.
Frame the implementation of that slice in terms of outcomes: reduced ingest, fewer war rooms, faster investigations, or a better compliance posture in the next one or two quarters. That gives your team and your stakeholders something tangible to rally around.
Step 3: Stand up the control plane
With the first win scoped, Deploy Cribl Stream and Edge. Create or connect your Cribl Cloud organization or on‑prem Leaders. Define initial workspaces — for example, one for the central logging team and one or two for early‑adopter business units or regions.
Deploy Cribl Stream worker groups in your primary region. Roll out Cribl Edge where host‑level collection makes sense, and deploy OTel collectors for the first OTel‑capable applications you plan to onboard. At this stage you do not need to carry production traffic through the new stack; your goal is to get an end‑to‑end pipeline running correctly from at least one source to at least one destination.
Step 4: Define golden pipelines for your top log families
Next, define golden pipelines for the log families that matter most: application logs, syslog, cloud audit logs, and key security events. For each family, standardize fields and naming, timestamp handling, and severity mapping. Implement PII detection and masking where required, and add core enrichment such as environment, business unit, region, and service name.
Package these pipelines as Packs so you can reuse and improve them instead of copy‑pasting configuration between workspaces. Store them in Git and treat them like code, with reviews and promotion paths.
Step 5: Mirror, validate, then flip
For each source you migrate, follow a simple pattern:
Mirror traffic. Keep the existing path in place, but add a parallel route into Cribl — via Edge or directly into Stream.
Validate results. Compare event volumes and error rates between the old and new paths. Spot‑check representative events for parsing, timestamp correctness, PII handling, and coverage. If something looks off, fix the pipeline before you cut over.
Flip production over. Once you are confident, change the primary route so traffic flows through Cribl instead of the old endpoint, and repoint agents and collectors accordingly.
If anything goes sideways, the mirrored path gives you a straightforward rollback option.
Step 6: Expose self‑service to early adopters
Once a few log families are stable in the new architecture, start letting early‑adopter teams use it directly. Give them workspaces with scoped permissions, a curated library of Packs for common sources and patterns, and access to Cribl Search over the Lake datasets that are relevant to them.
Document how they should onboard: which formats you expect, which endpoints to use, where their logs will appear, and how to request something outside the paved roads. A useful measure of success at this stage is simple: fewer tickets for routine onboarding, more teams using the platform themselves.
Step 7: Give developer teams visibility to their logs.
Developers must have seamless access to logs — not only to optimize performance but to ensure they can effectively troubleshoot incidents while on-call. Providing workspaces and access to Cribl Search is a straightforward way for developers to be able to search their logs. Since Cribl Search has copilots that convert natural language to Kusto Query Language, developers don’t need to learn another language to perform sophisticated searches, and render results in the way they find most valuable
Cribl Notebooks can further help. Part of Cribl Search, Notebooks lets you curate a sequence of searches. From there, notebooks can be shared across a developer team. This is particularly helpful when developers are on-call and need to work quickly to find the right logs or traces to isolate impacted services and probably root cause of incident.
Step 8: Instrument showback and SLOs
Finally, treat central logging like the shared service it is. Define and publish service‑level objectives for ingestion latency, drop rates, and platform availability. Use Cribl Insights and internal metrics to track which workspaces and sources drive volume, where optimizations reduced cost, and where bottlenecks still exist.
Showback is how you move from “ticket queue” to “business‑critical platform.” When you can point to specific ingest savings, faster incident resolution, or simplified migrations, central logging stops being an internal utility and starts to look like a strategic asset.
Governance, security, and compliance by design
If you want your logging platform to be the backbone of sensitive telemetry, you do not get to bolt governance on later. It has to show up in the architecture and pipelines from the start.
PII detection and masking in the pipeline
The simplest place to enforce data hygiene is where all the data already flows: the Stream processing layer. Cribl’s Guard and masking functions can scan for patterns that represent PII or secrets — email addresses, account numbers, credit card‑like strings, and custom patterns — and mask or tokenize those fields before the events ever reach downstream tools or long‑term storage.
By embedding these controls into your golden pipelines rather than leaving them to individual app teams, you give new sources a safe default. Every workspace and every new dataset inherits sane masking behavior unless someone explicitly changes it.
Role‑based access and workspace boundaries
The same pipeline that collects everything cannot expose everything to everyone. Workspaces and RBAC give you the basic controls you need: the central logging team can see and tune pipelines and top‑level metrics; tenant teams see their configurations, their Packs, and their data.
On the data side, per‑workspace Lake datasets and role‑aware access in Cribl Search make it possible to let application, SRE, and security teams explore the telemetry they own without handing them broad visibility into sensitive logs from other parts of the business.
Auditability and lineage
Regulated environments have a simple ask: be able to show what you changed, when you changed it, and how it affected data. Treating Stream and Edge configurations as code makes that straightforward. Pipelines live in Git; changes are reviewed, tested, and promoted from development to staging to production.
On the data side, keeping origin tags, transformation markers, and routing metadata in events makes it possible to reconstruct where data came from, how it was transformed, and where it went. When an auditor asks why a particular field disappeared from SIEM at a certain time, you have a commit and a config diff, not a mystery.
Operating and evolving your central logging platform
Getting the architecture right is one thing. Keeping it healthy is an ongoing job, much closer to running a product than standing up a one‑off project.
SLOs for ingestion, latency, and delivery
Telemetry can feel slow or unreliable in vague ways. SLOs turn those feelings into concrete thresholds. Track ingestion latency from source to primary tools, error and drop rates per workspace and per Source or Destination, and replay and recovery times when you have to drain queues or backfill from Lake after an incident.
Publish these SLOs and bring them into your regular operational reviews. They form the basis for conversations with stakeholders about trade‑offs between cost, performance, and retention.
Capacity planning and cost controls
Log growth is one of the few constants in enterprise IT. Monitor volume growth by source and workspace, watch for cardinality hot‑spots in labels and dimensions that can blow up index size, and keep an eye on ingest and storage trends for each downstream tool.
When the economics start to look ugly in a given tool, push more volume into Lake and Cribl Search and reserve hot‑tier capacity for the events that matter most. Tune pipelines by sampling low‑value data, trimming noisy fields, or aggregating where it makes sense. Use showback to show business units what their telemetry actually costs and how their choices affect shared infrastructure.
Retrospectives and pipeline hygiene
Pipelines age just like applications. Formats drift, new regulations appear, legacy sources go away, and exceptions pile up. Make pipeline hygiene a regular practice. After major onboarding projects, significant incidents, or migrations, ask: did we have the right data, did we get it fast enough, and did any pipeline “helpfully” drop something we needed?
Retire dead routes, unused Packs, and one‑off experiments. Update PII policies as standards evolve. Over time, you should see work consolidating into golden pipelines and away from bespoke one‑offs.
Using showback to justify budget
Finally, you are not just “the log team.” You are running the data engine for IT and security. Showback makes that visible. Track avoided ingest and storage costs in SIEM and observability tools, reductions in incident duration and frequency, and faster onboarding or migrations for major initiatives such as cloud programs, SOC modernization, or AI trials.
When you can tell a clean story like “we reduced SIEM ingest from this source by a meaningful percentage while expanding coverage,” or “we cut onboarding time for new apps from months to weeks,” budget conversations change. You are no longer arguing for headcount and resources in the abstract; you are showing a tangible return.
Checklist: Are you ready for scale (and AI)?
As a last step, it helps to have a quick self‑check. If you can say “yes” to most of these, you are well on your way to running central logging as a shared service instead of a shared headache.
Single logical control plane. You have one Cribl organization or Leader tier governing multiple worker groups, workspaces, and regions, rather than a patchwork of unconnected pipelines.
Golden pipelines for top log families. Application logs, syslog, cloud logs, endpoint logs, and your primary OTel workloads all flow through standardized pipelines and Packs.
Self‑service onboarding. App, SRE, and security teams can onboard new sources or adjust their logging within documented guardrails without opening a ticket to the central team for every change.
Tiered storage model in place. You know which events go to hot tools, which go to Lake, how long each tier retains data, and how to replay or search cold data when investigations demand it.
Centrally enforced governance. PII detection and masking rules run in the pipeline. Workspace and role boundaries align with your org chart. Sensitive data does not leak just because a new team plugged in a new source.
Showback metrics live and in use. You can tell any line of business what they send, where it goes, what it costs, and how it is performing — —and you review those numbers regularly.
OTel as the preferred path, not the only one. New services default to OTel plus Cribl, but legacy sources still flow through the same control plane, rather than being isolated islands.
AI‑ready telemetry. Schemas are consistent across major log families, PII is handled, and there is a clean way to feed search and analytics workloads — —including AI and agentic workflows — —without inventing a new pipeline every time.
If this mostly sounds like where you already are, you are well positioned. If not, you have a map for improvements. Either way, OTel and Cribl together give central logging teams the control plane they need to run telemetry as a real shared service — not just a stack of tools someone has to keep alive.
