
The explosion of telemetry data: Opportunity or catastrophe?
We are witnessing an unprecedented tidal wave of machine data.
Starting this year, IDC projects that the world will generate 175 zettabytes of data, with nearly 80% being unstructured, machine-generated exhaust — logs, metrics, traces, and sensor streams. These projections don’t even account for digital exhaust generated by the sudden explosion of artificial intelligence use cases being deployed, which ultimately pour gas on this telemetry fire.
Every prompt, embedding call, or fine-tuning run emits mountains of additional logs and traces. Analysts now expect AI agents to triple the volume of network alerts in the next few years — and every one of those alerts is a log event you have to ingest, route, shape, and retain. At the same time, AI training jobs push 100 Gbps-plus east-west “elephant flows’” across GPU fabrics, generating far more granular telemetry than traditional workloads.
Here at Cribl we often quote IDC that telemetry is growing at 29% CAGR and budgets simply are not. That number is incredibly high. The reality is that it doesn’t account for the sudden surge in AI over the last couple of years. If 29% growth is both conservative and already far outpacing current tool capacity, we’re in for a rude awakening if nothing changes.
The world of business data has already begun grappling with this problem. With the rise of cloud stacks built on the likes of Snowflake and Databricks, organizations have the flexibility to deal with the growing mountain of this class of data.
While transactional records live happily in these lakehouses and BI tools, telemetry does not. Machine exhaust, aka telemetry, has significantly higher volume, variety, and velocity compared to business data. Its variety is particularly wide-ranging, coming in raw from numerous sources with uncontrolled formats that cannot be dictated by the organization that is collecting the data. Trying to treat telemetry like business data forces teams into over-provisioned clusters, slow incident response, complex and ever-changing transformation scripting, and region-by-region copy sprawl that can even violate sovereignty rules due to inconsistent policy enforcement.
Most importantly, the value of the vast majority of this data is typically low. Until, that is, something breaks. An audit hits, a system goes down, or an AI tool misbehaves. Suddenly, this data is the most important data in your organization.
That means you have to collect and keep it, 24/7.
Where today’s solutions buckle
This chart highlights just a few reasons we see legacy systems that operate in a cloud-first world buckle under the pressure:
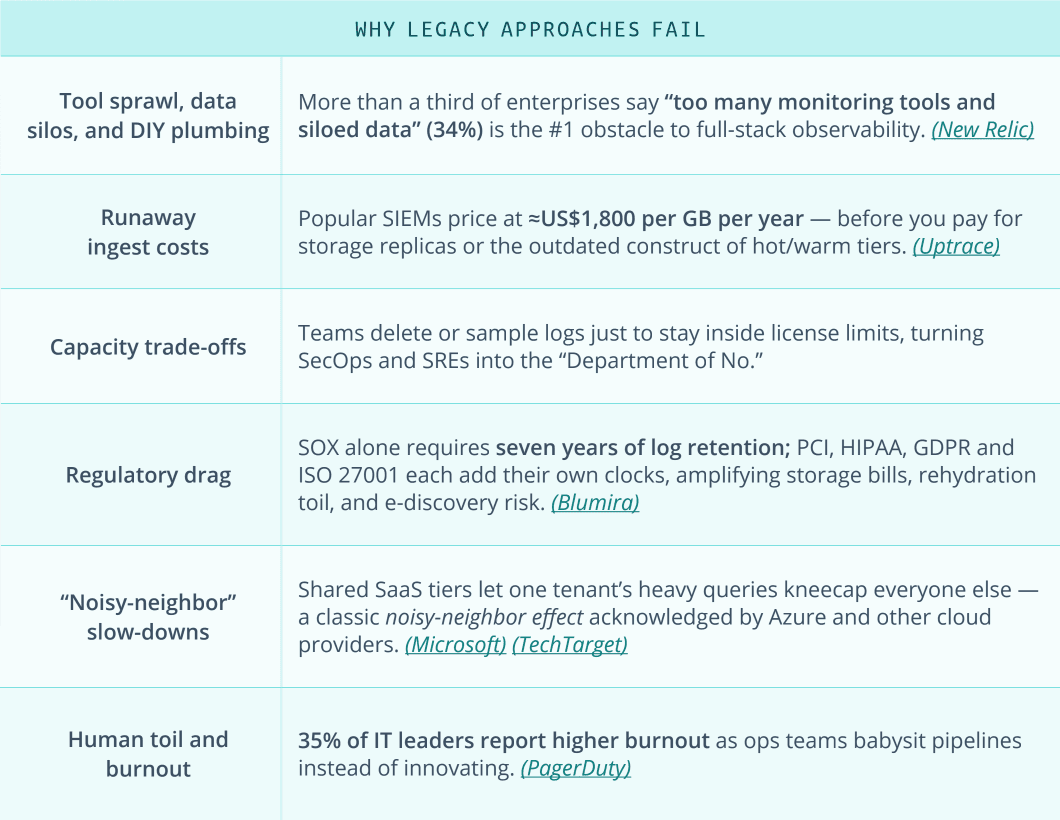
It’s clear the overwhelming presence of too many monitoring tools and fragmented data is holding observability back. High, unpredictable ingest costs exacerbate the issue, with common solutions priced exorbitantly — often upwards of $1,800 per GB annually.
To manage expenses, teams often resort to sampling or deleting logs, inadvertently transforming security operations and reliability engineers into gatekeepers rather than facilitators. And this slows down your entire innovation engine while exposing some of your key systems to risks.
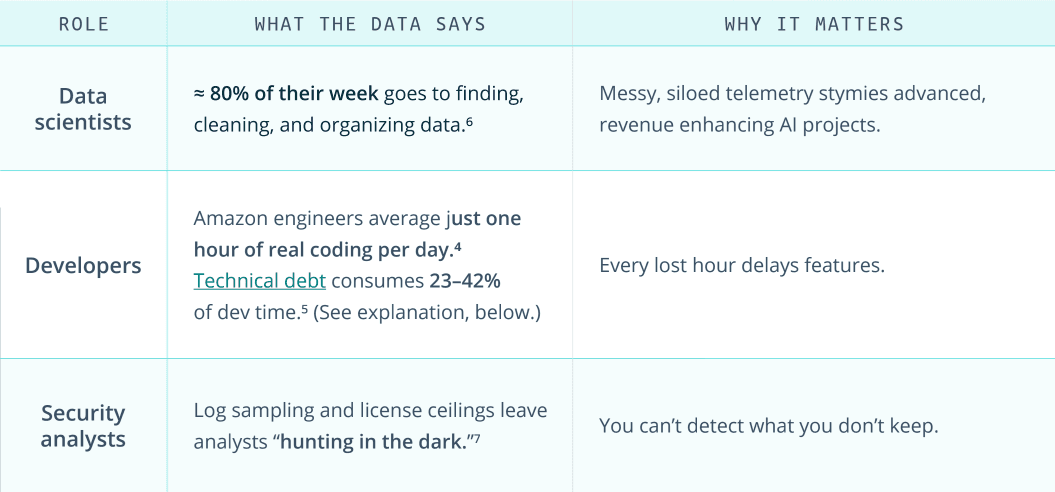
The hidden tax on innovation hits your business
When log ingestion is capped or priced like some rare gold-leaf, data scientists are held back from training AI effectively, product teams throttle experiments, and SecOps misses faint attack signals. The indirect costs — slower releases, longer outages, failed audits, inaccurate root cause analysis — are the brutal hidden tax on innovation that crushes an organizations’ ability to compete.
The silent budget drain

Downtime
97% of large enterprises say one hour of outage now tops $100,000, and 41% put the figure at $1–5M. (1)

Breaches
The global average breach hit $4.88M in 2024, the steepest jump on record. (2)

Dropped logs
When a system of analysis license quota is exceeded, the indexer can stop accepting data, silently discarding events that exceed the cap. (3)

Those dollars could bankroll new products, yet they’re wasted plugging holes that telemetry should have prevented.
Human drag › slower releases
The compounding opportunity cost
Google’s DORA research shows elite performing teams who automate and fully instrument their pipelines:
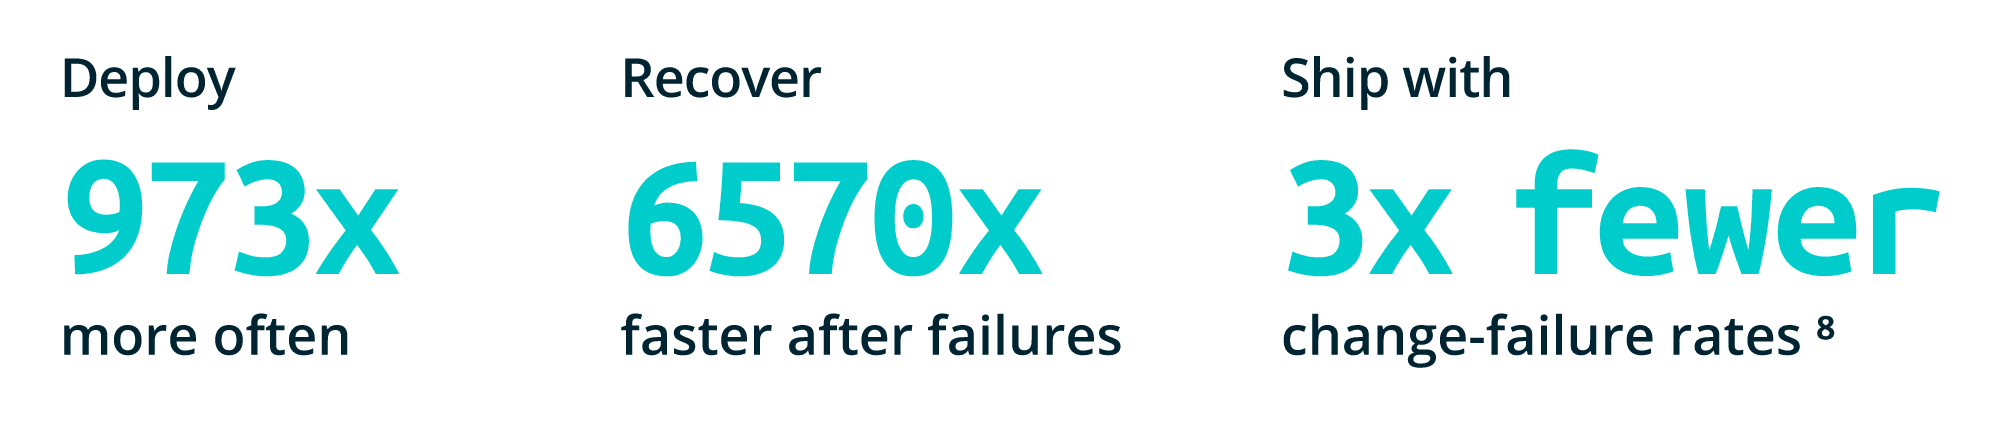

Those advantages translate directly into revenue, uptime, and customer trust — yet tool-chain complexity and data fragmentation top the list of blockers to reaching “elite” status.
Why incremental fixes won’t cut it
This all should sound familiar. That’s because as an industry we’ve come to terms with this untenable status quo. It’s the same story every quarter: You squeeze another discount out of your tool vendor, prune another index, bolt on yet another pipeline sidecar — only to watch costs, tools, storage, and complexity roar back a sprint later. Industry surveys prove the cycle is getting worse, not better:
You could renegotiate ingest pricing, share another Elasticsearch cluster, or write one more Lambda to filter logs. But the pattern is familiar:

Cost Gravity
Data grows ~29% YoY; but tool and storage pricing doesn’t shrink 25%! It’s typically quite the opposite. Each quarter the same red-line reviews return, only bigger.

Integration tarpit
Every new point tool buys visibility into one corner, silos another copy of data, and adds two new failure modes everywhere else.

Cognitive overload
More dashboards mean more “Is this metric even correct?” debates, delaying every root cause analysis and audit request.

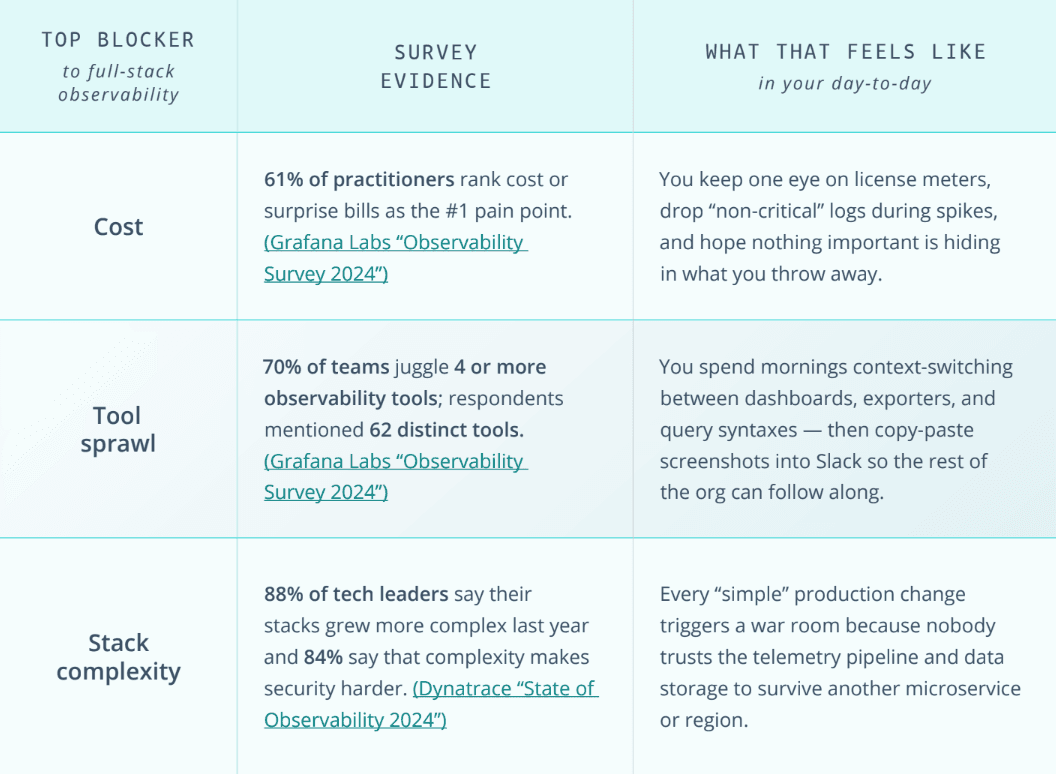
That’s why, when surveys ask what really blocks full-stack observability, cost, tool sprawl, data fragmentation, and complexity leap off the charts. The Band-Aids — license tier shuffles, query sampling, cheaper “cold” storage — treat symptoms, not the structural rot.
What happens if we do nothing?
The price of doing nothing has never been steeper, more diverse, or pervasive. Organizations that settle face:
Exploding spend
Ingest fees rise faster than revenue.
Audit failures
Fragmented retention and masking policies break compliance.
Slower product cycles
Teams ration data instead of iterating.
Talent drain
Top engineers leave rather than babysit brittle pipelines.
No organization — startup or Fortune 50 — can absorb that trajectory.
But what happens when you remove these blockers? You unlock:
Released velocity on elite footing
Ship daily, not monthly.
Shorter MTTR & fewer rollbacks
Full-fidelity signals speed root-cause.
Security that scales with threat volume
Hunt first, then license math later.
Happier engineers and scientists
More time building, less time babysitting systems, and fewer resignations.

In other words, capped telemetry isn’t just today’s pain — it’s tomorrow’s missed launch. The goal has to be an elastic resource that can handle all data and make it accessible.
The road ahead
This post mapped the crisis of volume, cost, variety, fragmentation, risk, and human burnout that make a telemetry services cloud inevitable.
Cribl.Cloud was built for this exact moment. Unlike legacy tools that treat telemetry as an afterthought to their analytics stack, Cribl.Cloud is purpose-built as a telemetry services cloud. That means elastic scale without runaway costs, centralized governance without silos, and open pipelines that let you route any data to any destination.
The result: You get full-fidelity visibility without forcing engineers into painful trade-offs between cost, compliance, and speed.
Most importantly, Cribl.Cloud puts the control back in your hands. Instead of ballooning ingest bills and brittle pipelines dictating what data you can keep, you decide what’s valuable and where it lives. That shift — from telemetry controlling your budget to you controlling telemetry — is what makes a telemetry services coud not just a better solution, but a necessary foundation for competing in the age of AI, compliance scrutiny, and relentless digital velocity.
Don’t just take our word for it — try Cribl.Cloud yourself. Process up to 1TB per day for free, and see how easy it is to take back control of your telemetry.
References