Yesterday, we officially announced Cribl Edge, a next-generation observability agent. You can find more about its features here. In this post, I am going to walk you through the journey of incepting and building this new product.
Our most important core value at Cribl is “Customers First, Always.” and that involves actively listening and being on the lookout for any pains our customers might be experiencing. We have been consistently hearing from them that collecting logs, metrics, and traces from their infrastructure is a painful task. There are usually several agents, each coming from a different vendor, with different configuration, managing, and monitoring capabilities. But where exactly do the pain points lie?
Identifying the real pain point is a critical step in building successful products. For any product to become successful it needs user adoption. Real pain is a key trigger to action, which leads to adopting new strategies, a new product, or service. We decided to explore this further by breaking the data collection problem down to its first principles and asking lots and lots of questions, like these:
What Is the Job to Be Done?
Discover, collect, transform, and route relevant observability data.
How Is This Job Being Done Today?
Data is collected by different agents configured and managed by different teams. The agents tend to specialize in logs or metrics collection and usually have an ecosystem affinity, e.g. Elastic Beats agents work better in the Elasticsearch ecosystem, the Cloudwatch Logs Agent only works in AWS, etc.
If we had not heard our customers’ pain we’d likely accept the state of the world and stop here. We had to dig deeper. The next few questions highlight how we came to identify the dimensions in which current solutions are broken.
How Do Agents Know What Data to Collect?
The very first question asked when setting up an agent is: Which data should it collect? Today’s agents rely on the operator to specify exactly what directories to monitor and what file patterns to look for. Well, how do the operators know? In smaller organizations the operators of the observability infrastructure are the application owners so they inherently know, but in larger organizations this involves working with the application teams. As organizations deploy new applications and retire old ones, this process becomes more time consuming and error prone resulting in missing data and observability gaps. There’s goat to be a better way …
How Are Agents’ Configs Managed and Updated?
The workflow for making configuration changes varies for different agents, but generally, it follows this pattern:
Manually update a number of configuration files.
Test the config changes locally or in a production-like environment.
(optionally) Push the config changes to a code repository.
Use a configuration management tool (e.g. Puppet, Chef, Ansible, SaltStack, etc.) to push the config changes to the fleet.
Cross fingers & pray.
If something goes wrong, we simply repeat the above steps until we get it right. There’s gotta be a better way …
How Is the Fleet of Agents Monitored, Managed, Upgraded?
Observability data collection is effectively a very large distributed system problem. Many agents today expose some metrics about their individual operation, however, the task of fleet monitoring and management is left as an exercise to the operator. There’s goat to be a better way …
Answering these questions helped us understand the fundamental pain-points of data collection that our customers were experiencing. We set out to build an observability agent which helps operators identify relevant data that needs collecting and provide them with a centralized way to configure, monitor, and manage their entire fleet. And in true engineering fashion, while building Edge we came across a new set of powerful capabilities, which we didn’t originally intend, so read on …
Living on the Edge…
When addressing the log monitoring configuration problem we started by asking: Is there a way we can auto-discover the log files? The trivial solution would be to periodically scan the entire filesystem – it would work, but be quite heavy on the filesystem! Another solution would be to use AppScope, to scope all applications and have them send the data to Edge. This would solve the filesystem scanning problem but would introduce a config problem as you’d need to use AppScope on all of your applications. We went back to using the first principles questioning: what is a log file? A file where a process is writing operational messages. This answer drove us to explore a novel path: Look at the files that a process has opened for writing, and auto-tail the ones that look like log files. This method of discovering log files would be resilient to application modifications or even unplanned applications running on the endpoint. We were shocked that (to our collective knowledge) none of the existing agents address log discovery this way … such is the power of solving from first principles.

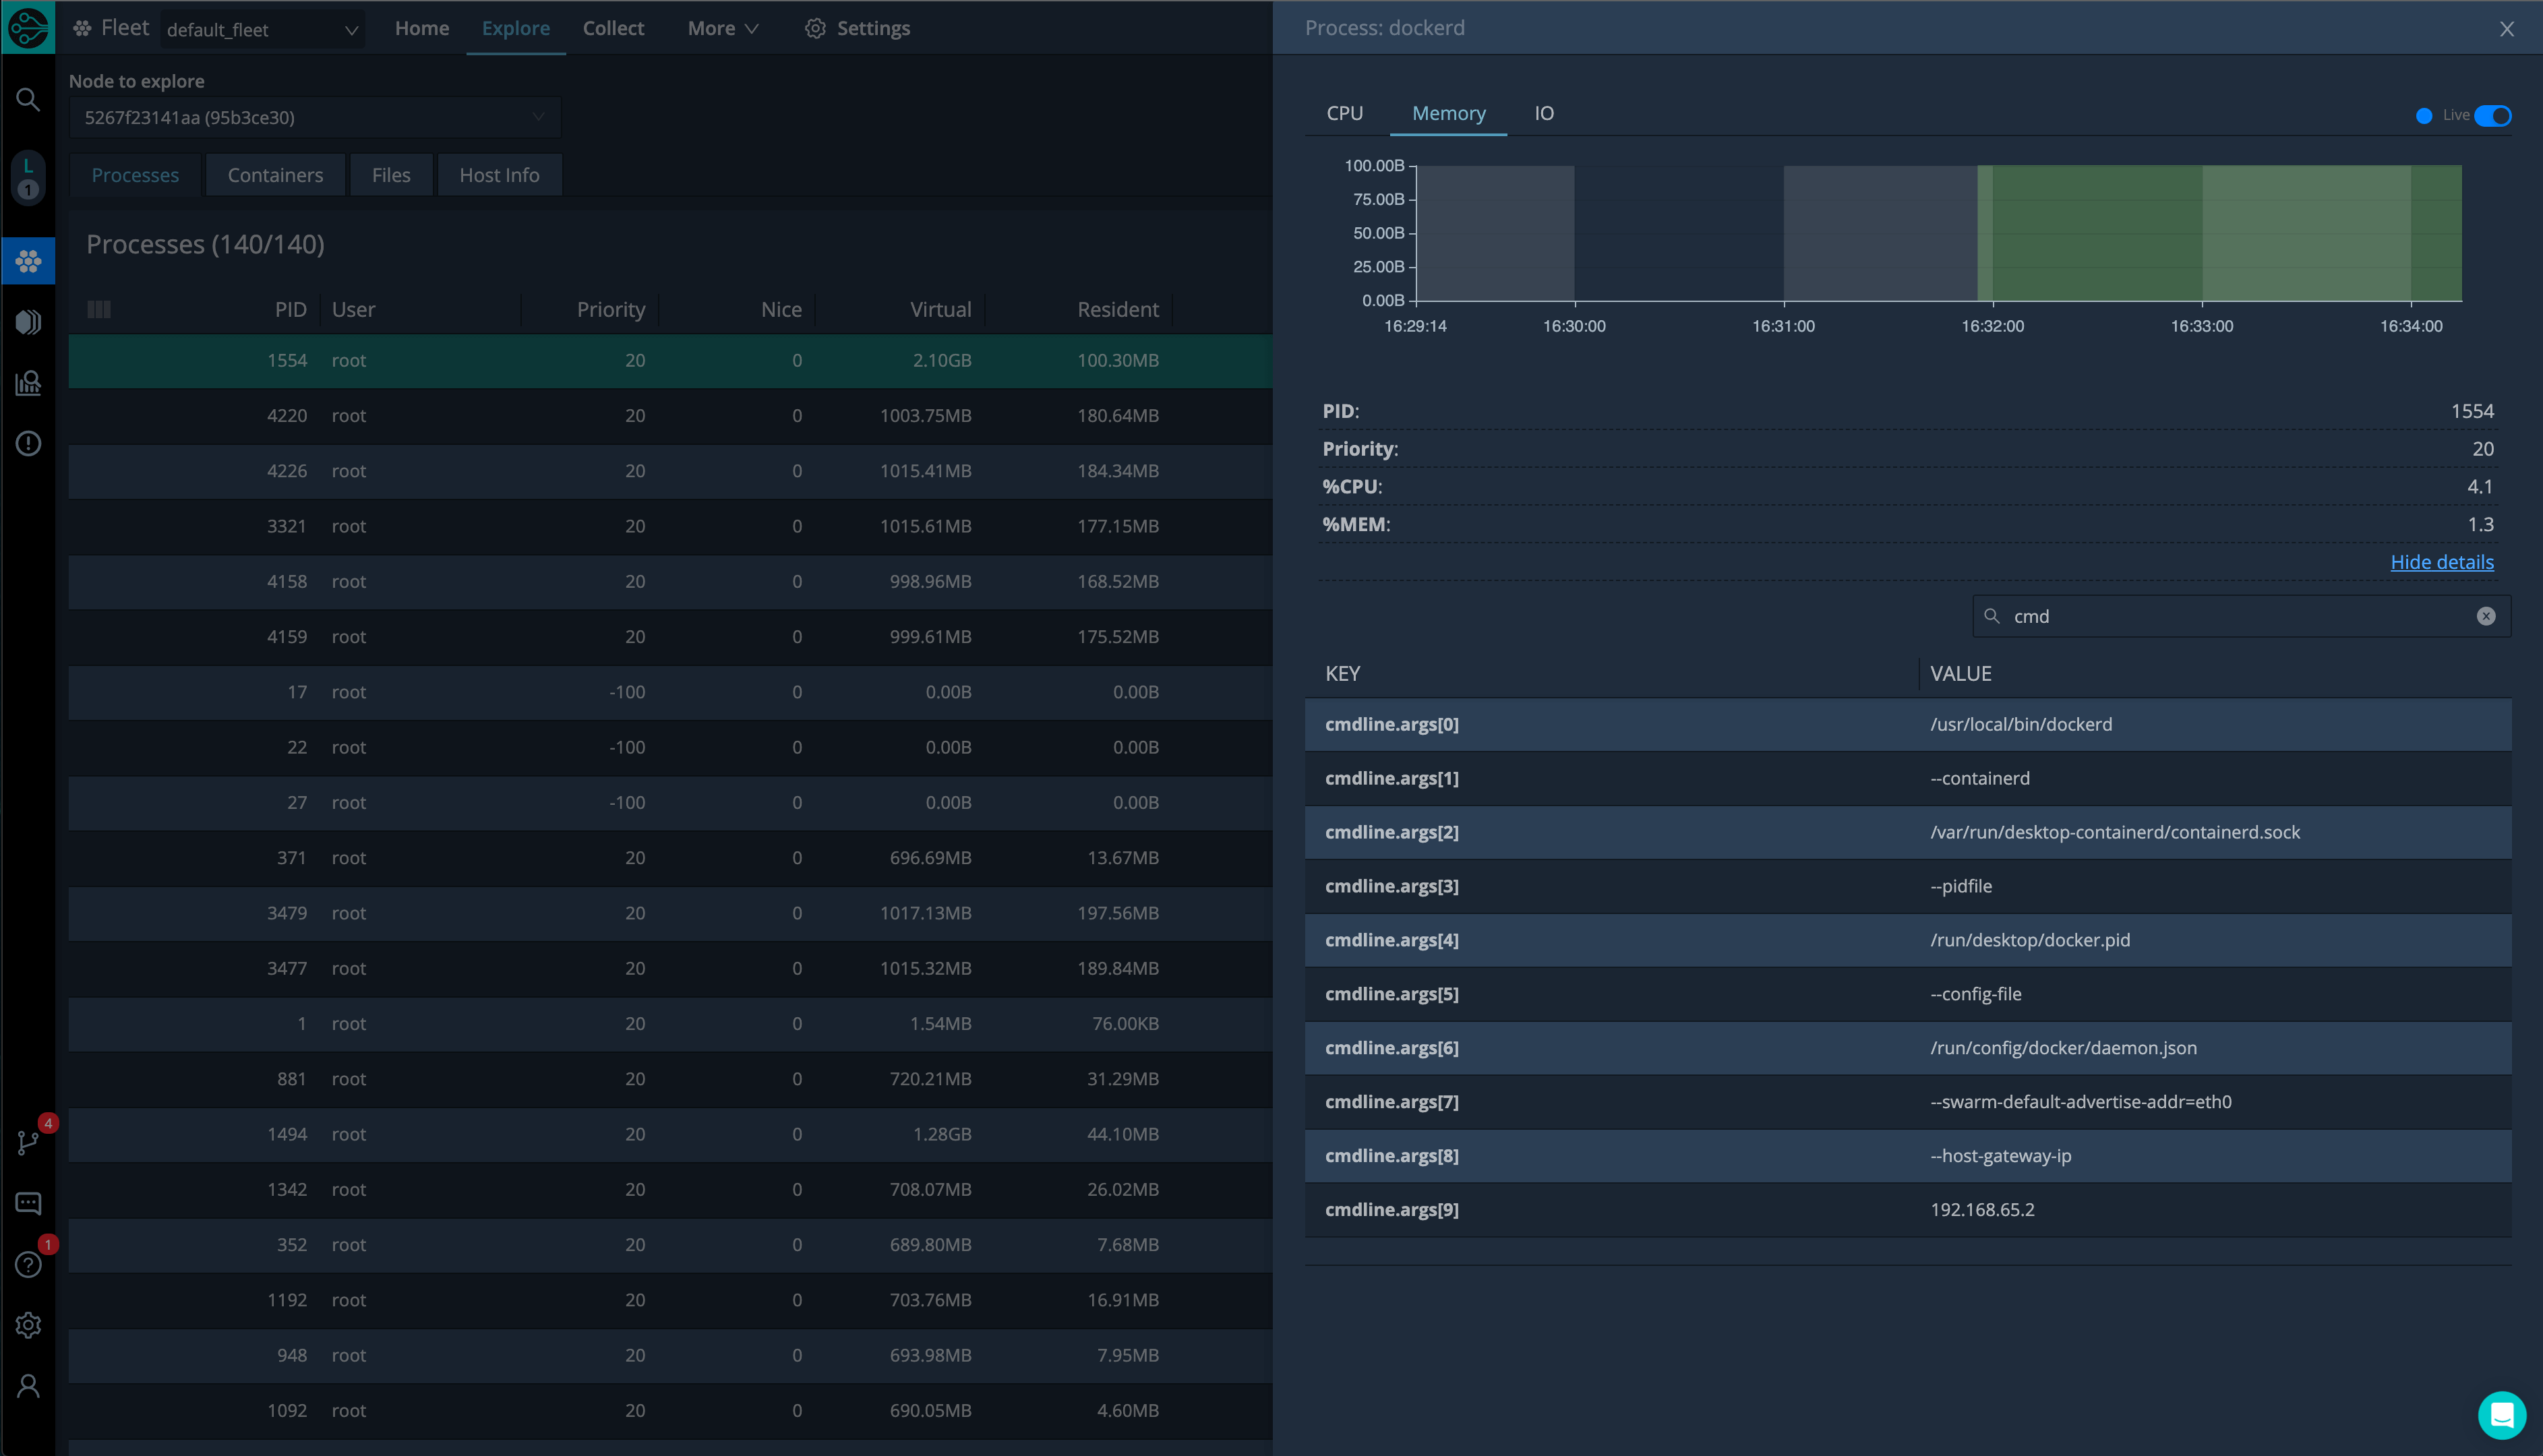
To address the pain of configuration by trial-and-error, we built Cribl Edge with a Web UI that allows users to discover, explore, process, and route data to 40+ destinations. We knew we wanted to let users see what metrics were discovered and give them a preview of what they were. We knew we wanted to let users see what log files were discovered and allow them to peek into them and assess if they were interesting candidates to be collected. We knew we wanted to give users the ability to do that on any Cribl Edge node directly from the central management layer (Leader). What we didn’t know is how powerful the combination of those features would be in providing a highly effective troubleshooting experience, all without moving a single byte from the endpoint!
The feedback we’ve received from our customers trying Cribl Edge falls into two broad buckets – “holy sh*t” and “this product gets me”. If your day is consumed by collecting observability data, I highly recommend taking Cribl Edge for a spin, you’ll love it! And if you are building new products or services, make sure to spend lots of time understanding your customers’ problems by breaking it down to the first principles and solutions from there.


