Very early on in my career, I worked for AT&T Wireless, before it became Cingular and then AT&T Wireless again. As a young engineer, I remember running across various technical situations I couldn’t explain. Why can’t we connect this network to that one if there is a legitimate business need? Why must we always allocate this much bandwidth to this use case? Often, the reasons for these hard and fast rules had long since been lost to time.
I feel like our little corner of the industry is trapped in the same situation when it comes to our pillars of observability: logs, metrics and traces. What are all of these if not just different kinds of documents with different shapes? Before its stored, observability data is just that: data.
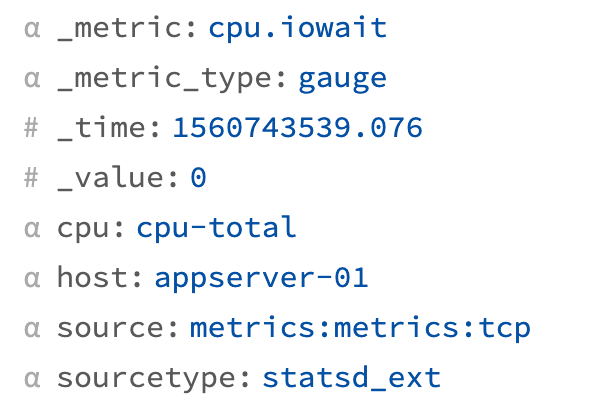
With Cribl LogStream 1.6, we’ve taken one big step towards evening out all these pillars of observability and giving machine data engineers the tools they need to control their data. LogStream now supports metrics protocols, Statsd, DogStatsd, and Graphite in and out. In addition, LogStream now ships with aggregation capabilities, allowing users to do real-time, tumbling window aggregations on events. Aggregations can be output as events or as metrics, with support for the above protocols as well as Splunk Metrics and Prometheus. Put together, Cribl LogStream can convert any type of data it can ingest, including data from Kafka or Kinesis, and publish aggregations of that data to any destination, including Prometheus!
Every release gives me an excuse to find one of these
By treating all data as events, LogStream truly allows for unification of all types of Observability Data. Metrics can be converted to Logs, or Logs can be converted to Metrics. Cribl allows working with all data equally.
Practically, this has real world implications. Similar to problems we are solving in Logging systems, Metrics systems cost are directly proportional to the full cardinality of the data. Metrics shapes can easily be modified, allowing administrators to control for example when developers send in Metrics where fields are too high cardinality. Full fidelity metrics can be converted to logs and stored in a log system where high cardinality is not an issue.
Aggregation
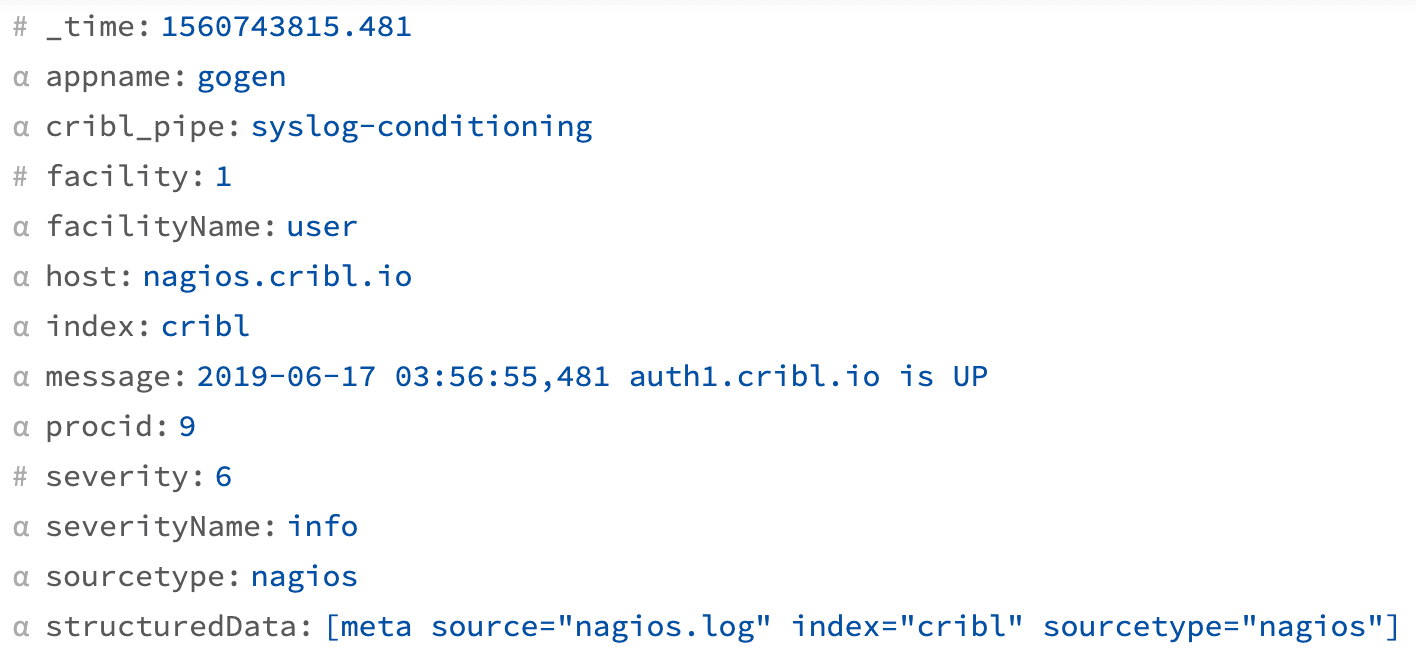
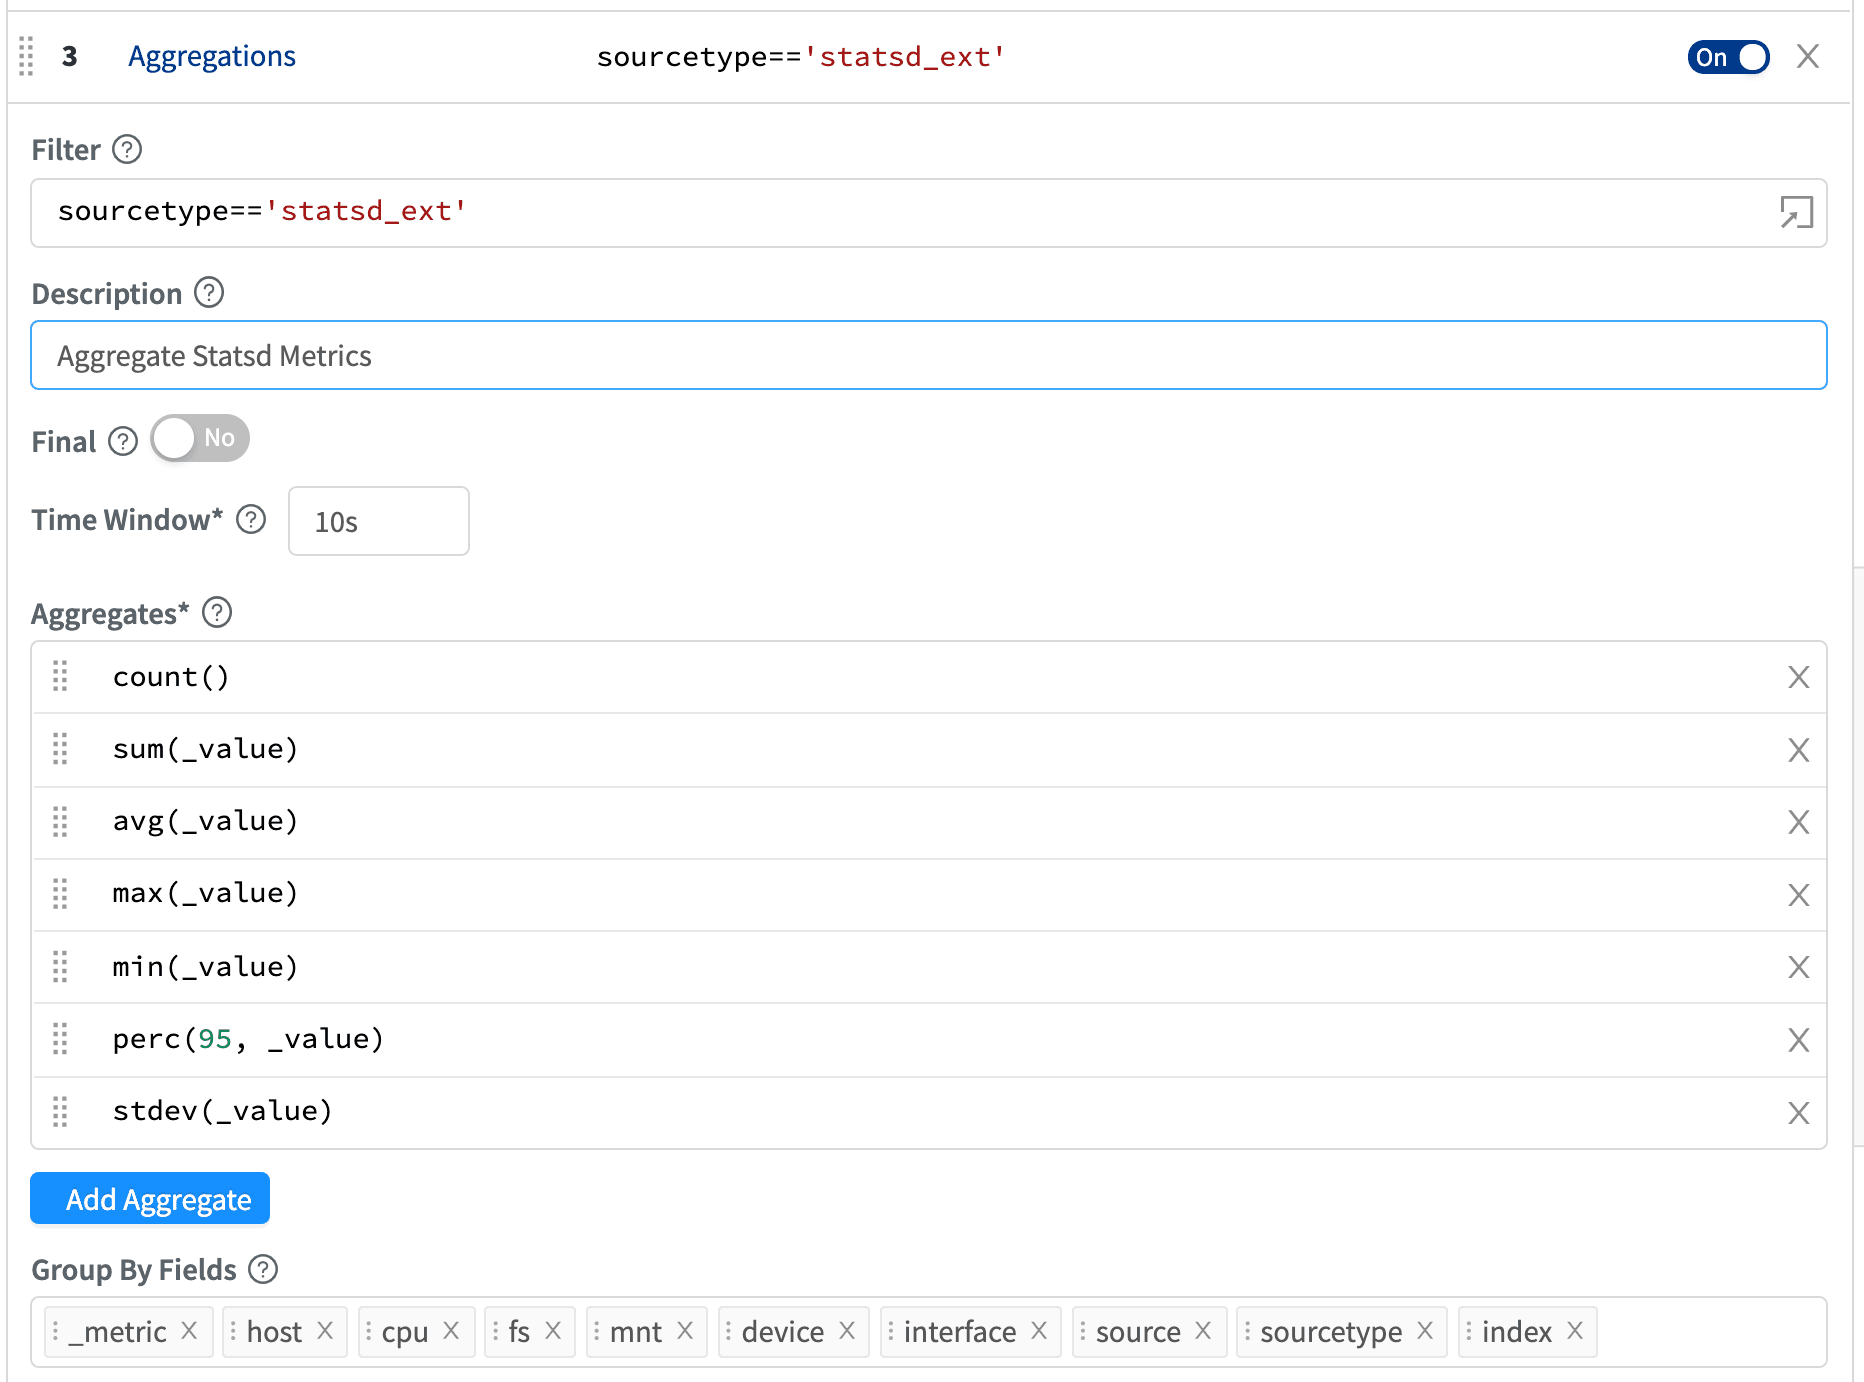
LogStream 1.6 ships with a new Aggregation function. Aggregation allows you to take any event and create new events for a given window with a series of calculations like sum, count, avg, perc, stdev, and more. Calculations are expressed using a new expression type in Cribl, an “Aggregation Expression”. Aggregations can be split by an arbitrary number of fields.
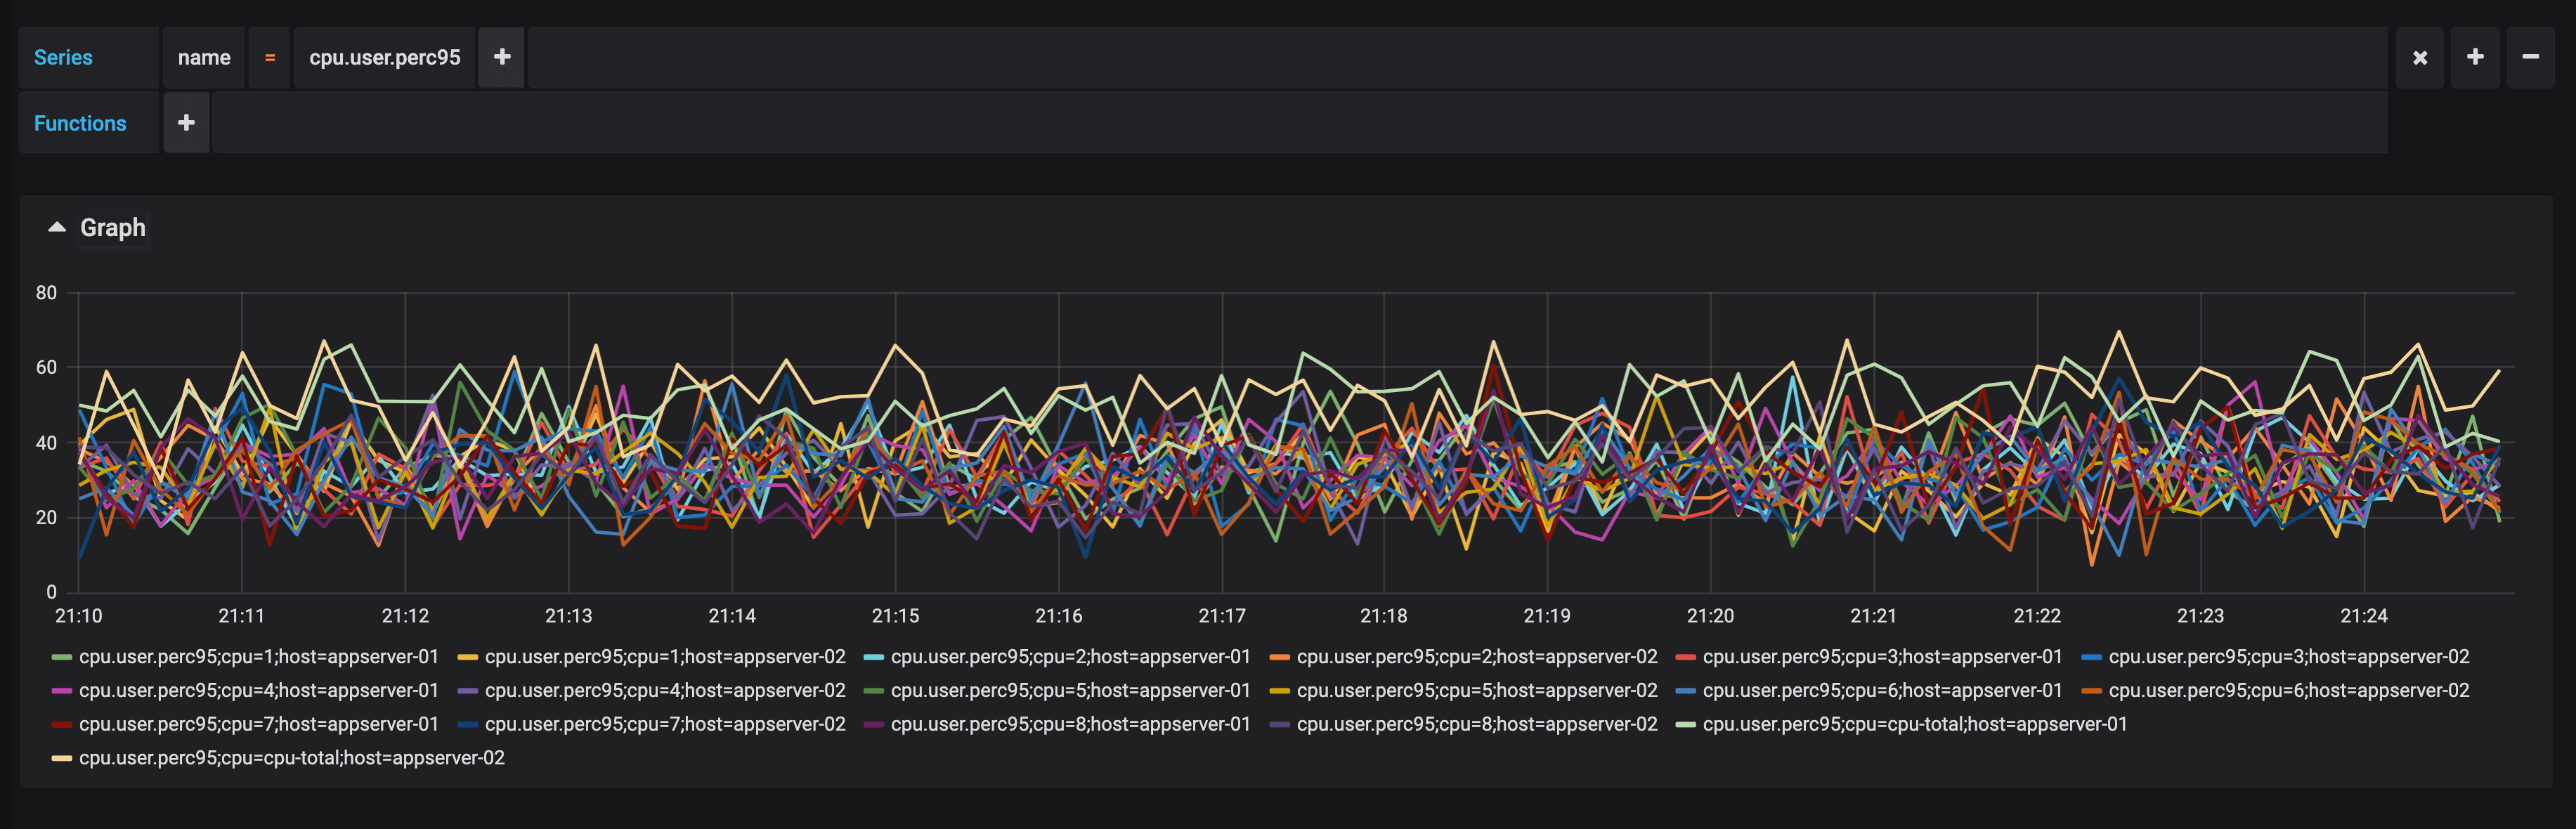
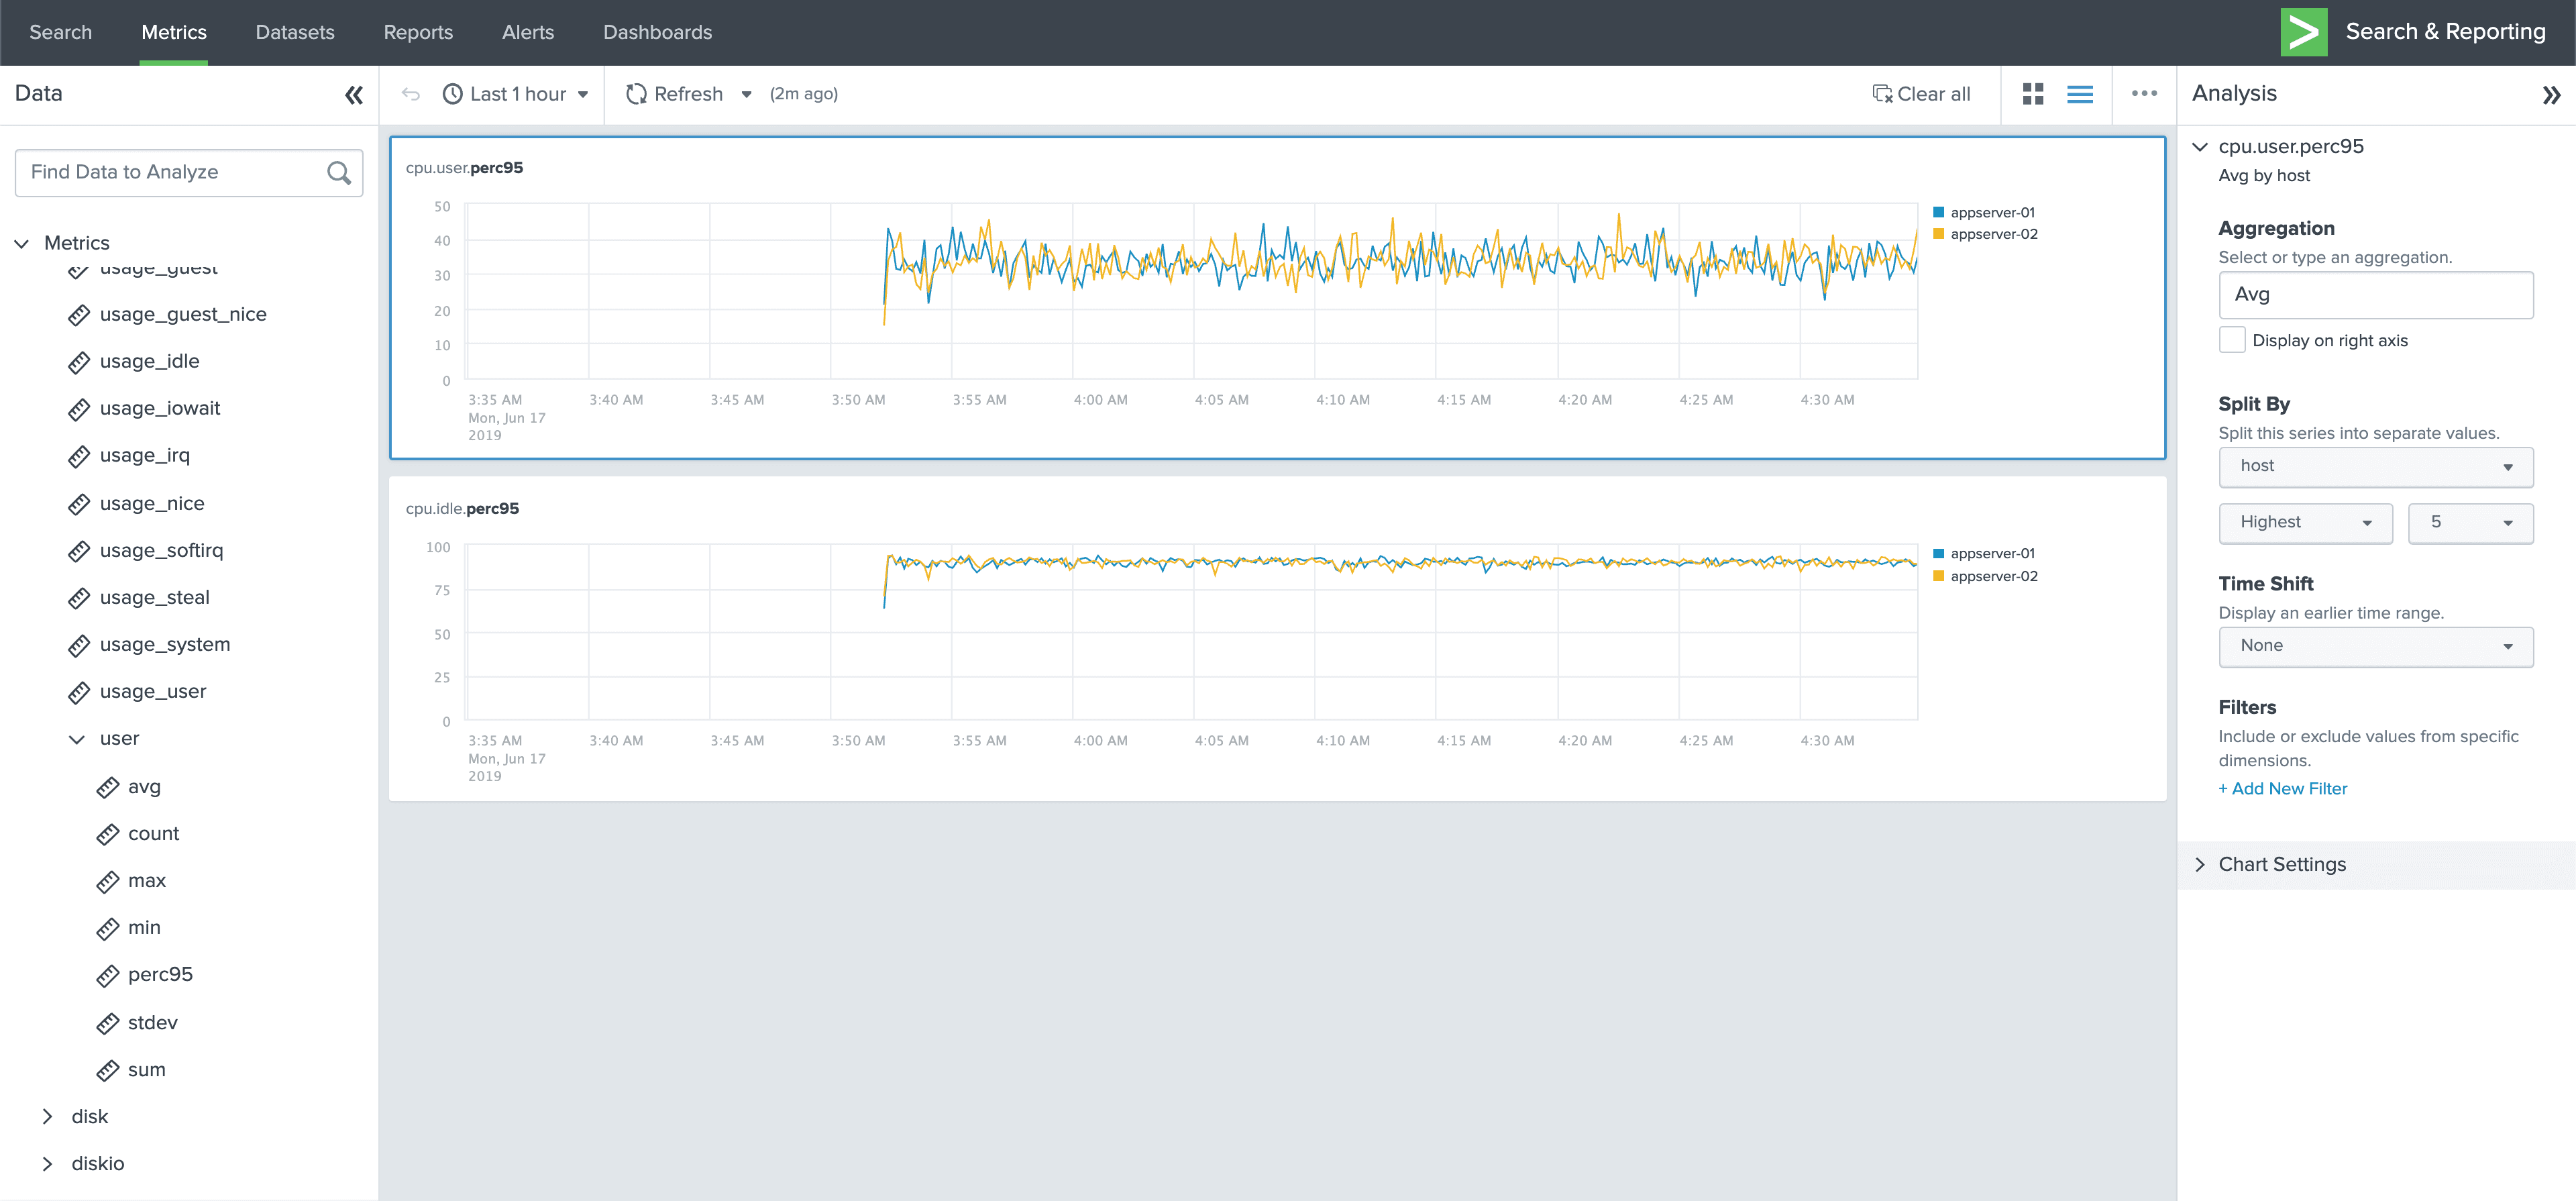
By default, aggregations create new events, which can be consumed by event destinations like Splunk or ElasticSearch. Aggregate events are passed through and original events are dropped, although a passthrough mode is also available. Aggregations can also create metric events for metric destinations like Splunk Metrics, Statsd, or Graphite. Metrics solutions allow for easy browsing and visualization, with solutions like Grafana or Splunk Metrics Analytics Workbench.
Depending on the cardinality of the data aggregated, aggregations can massively reduce the size of the dataset. Metrics are essentially lossily compressed events.
New Functions and Destinations
LogStream 1.6 ships with a number of other enhancements. Along with our other Metrics work, there is now a Publish Metrics functions which allows publishing any event as a Metrics Event for a Metrics destination. Along with the new Publish Prometheus (beta) function, this means essentially any data coming into LogStream can become a Prometheus metric or sent to any other metric destination.
In addition to the Aggregation Function and Metrics Sources & Destinations, LogStream 1.6 ships with a new Reverse DNS function for looking up any IP Address in DNS. Additionally, LogStream 1.6 now supports Amazon Cloudwatch Logs and Azure Monitor Logs as destinations.
That’s it for 1.6! Head to our website to download the latest.