As a product manager for Cribl Stream, I enjoy listening to customer challenges and bringing new features and enhancements into the product to help reduce pain points and better enable customers. In each release, we add new capabilities such as TCP syslog load balancing, expanded Open Telemetry support, pipeline profiling, Stream projects, new sources, destinations, and usability improvements (easier version upgrades, improved global navigation, etc.) Be sure to read the full set of release notes, as there are typically also “smaller” enhancements added to each release. Here are my top 10 favorite “smaller” Stream features you may not be familiar with:
Admin Custom Banner
The admin custom banner is a short, customizable text banner displayed across the top of all Cribl products. A Cribl administrator typically configures the banner, which can help identify the environment (development vs. production), add a legal disclaimer, “Authorized use of ACME GOAT Corp,” or provide a short custom message to all users, “I’ll be away on vacation next week.” You can customize the color and text and optionally include a hyperlink.


The “Comment” Function
Add comments to your pipelines and routes. Comments help document your building’s purpose and operation. Your future self or the next Cribl admin will thank you.


Notifications
Notifications enable Cribl admins to be aware of conditions which may require attention such as no data received on an incoming syslog Stream source, a destination which may be unhealthy resulting in backpressure, or when Cribl Search detects a result in a saved search. Notifications can be sent to one or more delivery targets such as Pagerduty, Slack, a webhook, via email, or AWS SNS

Have a notification target configuration you want to reuse across environments? Simply use the “Manage as json” to save the target configuration as a file and simply export or import the target configuration file.


Customizable Rows
Many Cribl table row headers have additional options to show or hide specific columns. Here’s an example of the Cribl Stream worker node display. To see the hostname and IP address, simply toggle them on. If you don’t care about the number of CPUs, toggle them off.

Also, on the Stream worker or Edge node views, you can export the data in either CSV or JSON format using the “Export list as” button. This is helpful for comparing inventory to ensure you have all your Edge nodes onboarded in a new deployment or getting an inventory of all your Stream worker nodes.


Git History
Did you forget the change you deployed right before vacation? Use the built-in Git history to see recent commits and deployments and understand what configuration files might have been modified.


Copy and Paste
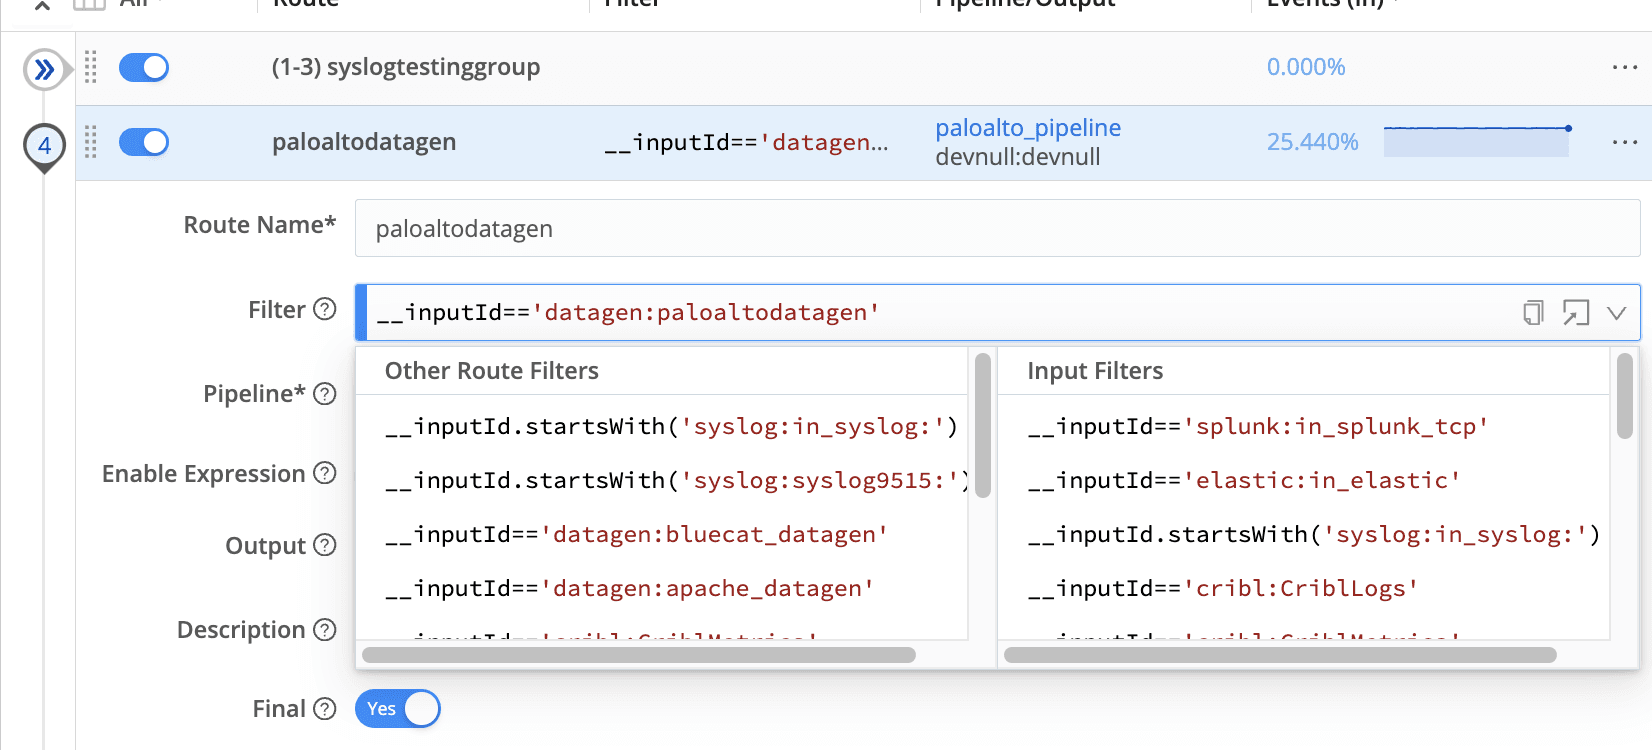
Trying to craft a filter – use the copy to clipboard icon. For example, after configuring a new source such as a datagen, I typically use the “copy to clipboard” button, commit and deploy the change, then head to the routes view to set up a new route and simply paste in the filter.

.

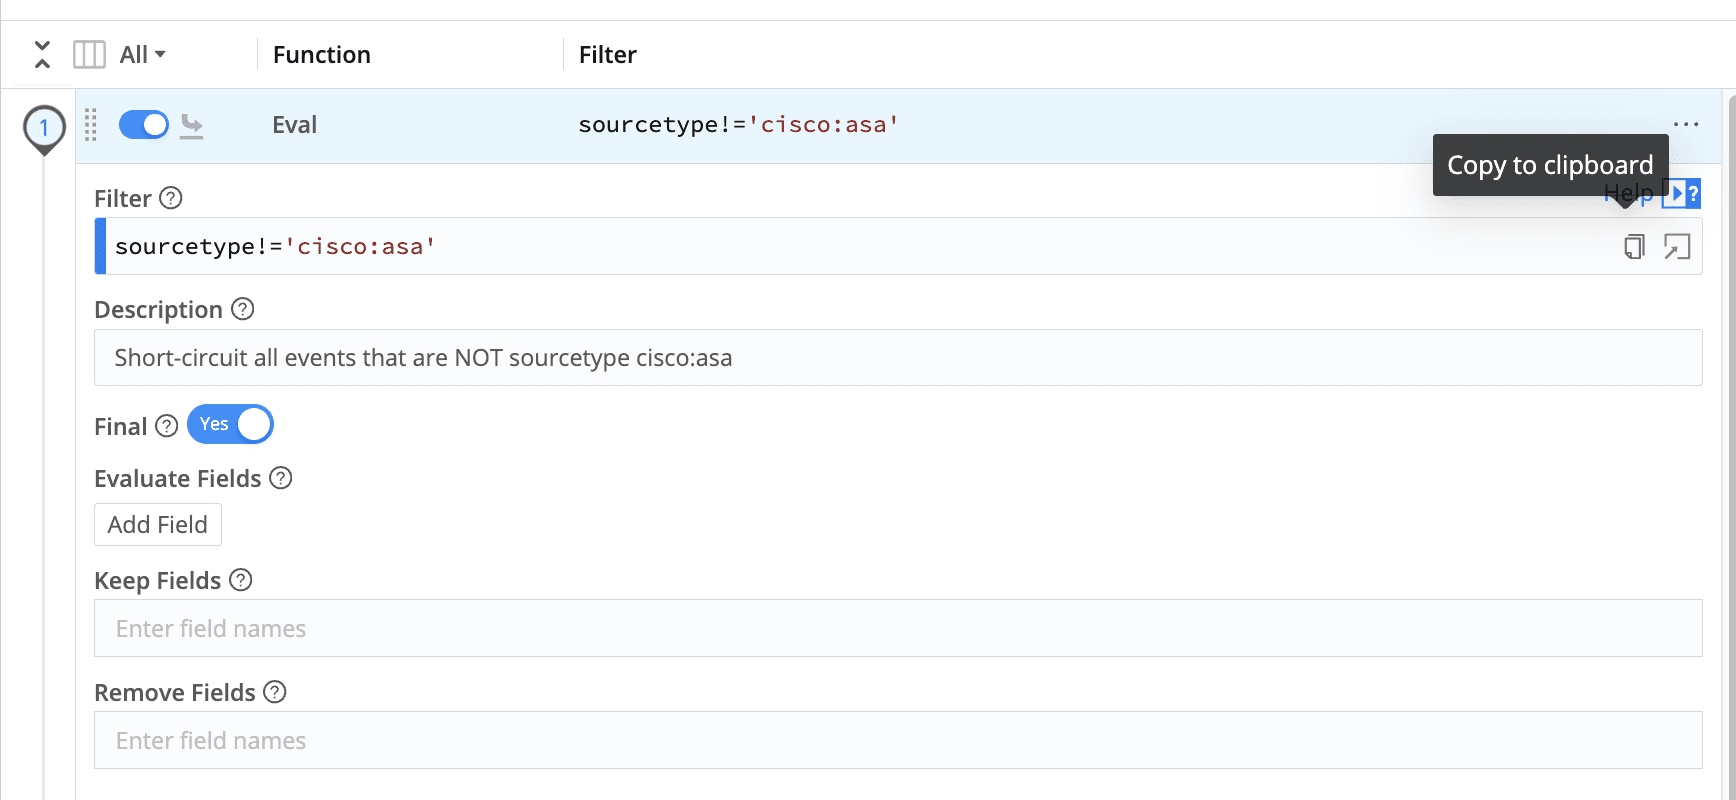
Similarly, in pipelines – do you want to copy a pipeline from one worker group to another worker group? You can copy the pipeline via the copy icon and then paste it in the desired worker group. Keep an eye out as the “copy” capability appears in many places throughout the product. Here are a few more examples of finding the “copy” capability:


Pipeline Diagnostics
Pipeline diagnostics can be accessed by clicking the bar graph icon in the data preview pane, which displays basic statistics about the pipeline processing results. This provides a quick overview of the number of events in/out, the number of fields in/out, and the length of the fields in/out. It’s super handy for showcasing a pipeline’s impact.


Top Talkers
Examine the five highest volume sources, destinations, pipelines, and routes by navigating to the “Top Talkers” report. This is found in Stream Monitoring -> Reports -> Top Talkers

For a more visual flow representation, instead of just the top talkers, try the view of the flow (Monitoring -> Flows), where you select sources, destinations, routes, or quick connects and visualize events/bytes in/out flowing through the system with a Sankey-style diagram.

Inline Help
Are you building a pipeline and need help understanding a function or looking for examples of how to use a function? Click the built-in help button on any pipeline function, and a drawer will display on the right pane, providing quick assistance.


API Reference
Are you curious to try driving the product via the Cribl API? The API reference is accessible under Settings -> API Reference. Here, you can see full details about all the API capabilities and easily try out various calls to see results.
Do you have a feature or enhancement you would like to see in the product? Let me know—you can find me in the Cribl community Slack.


