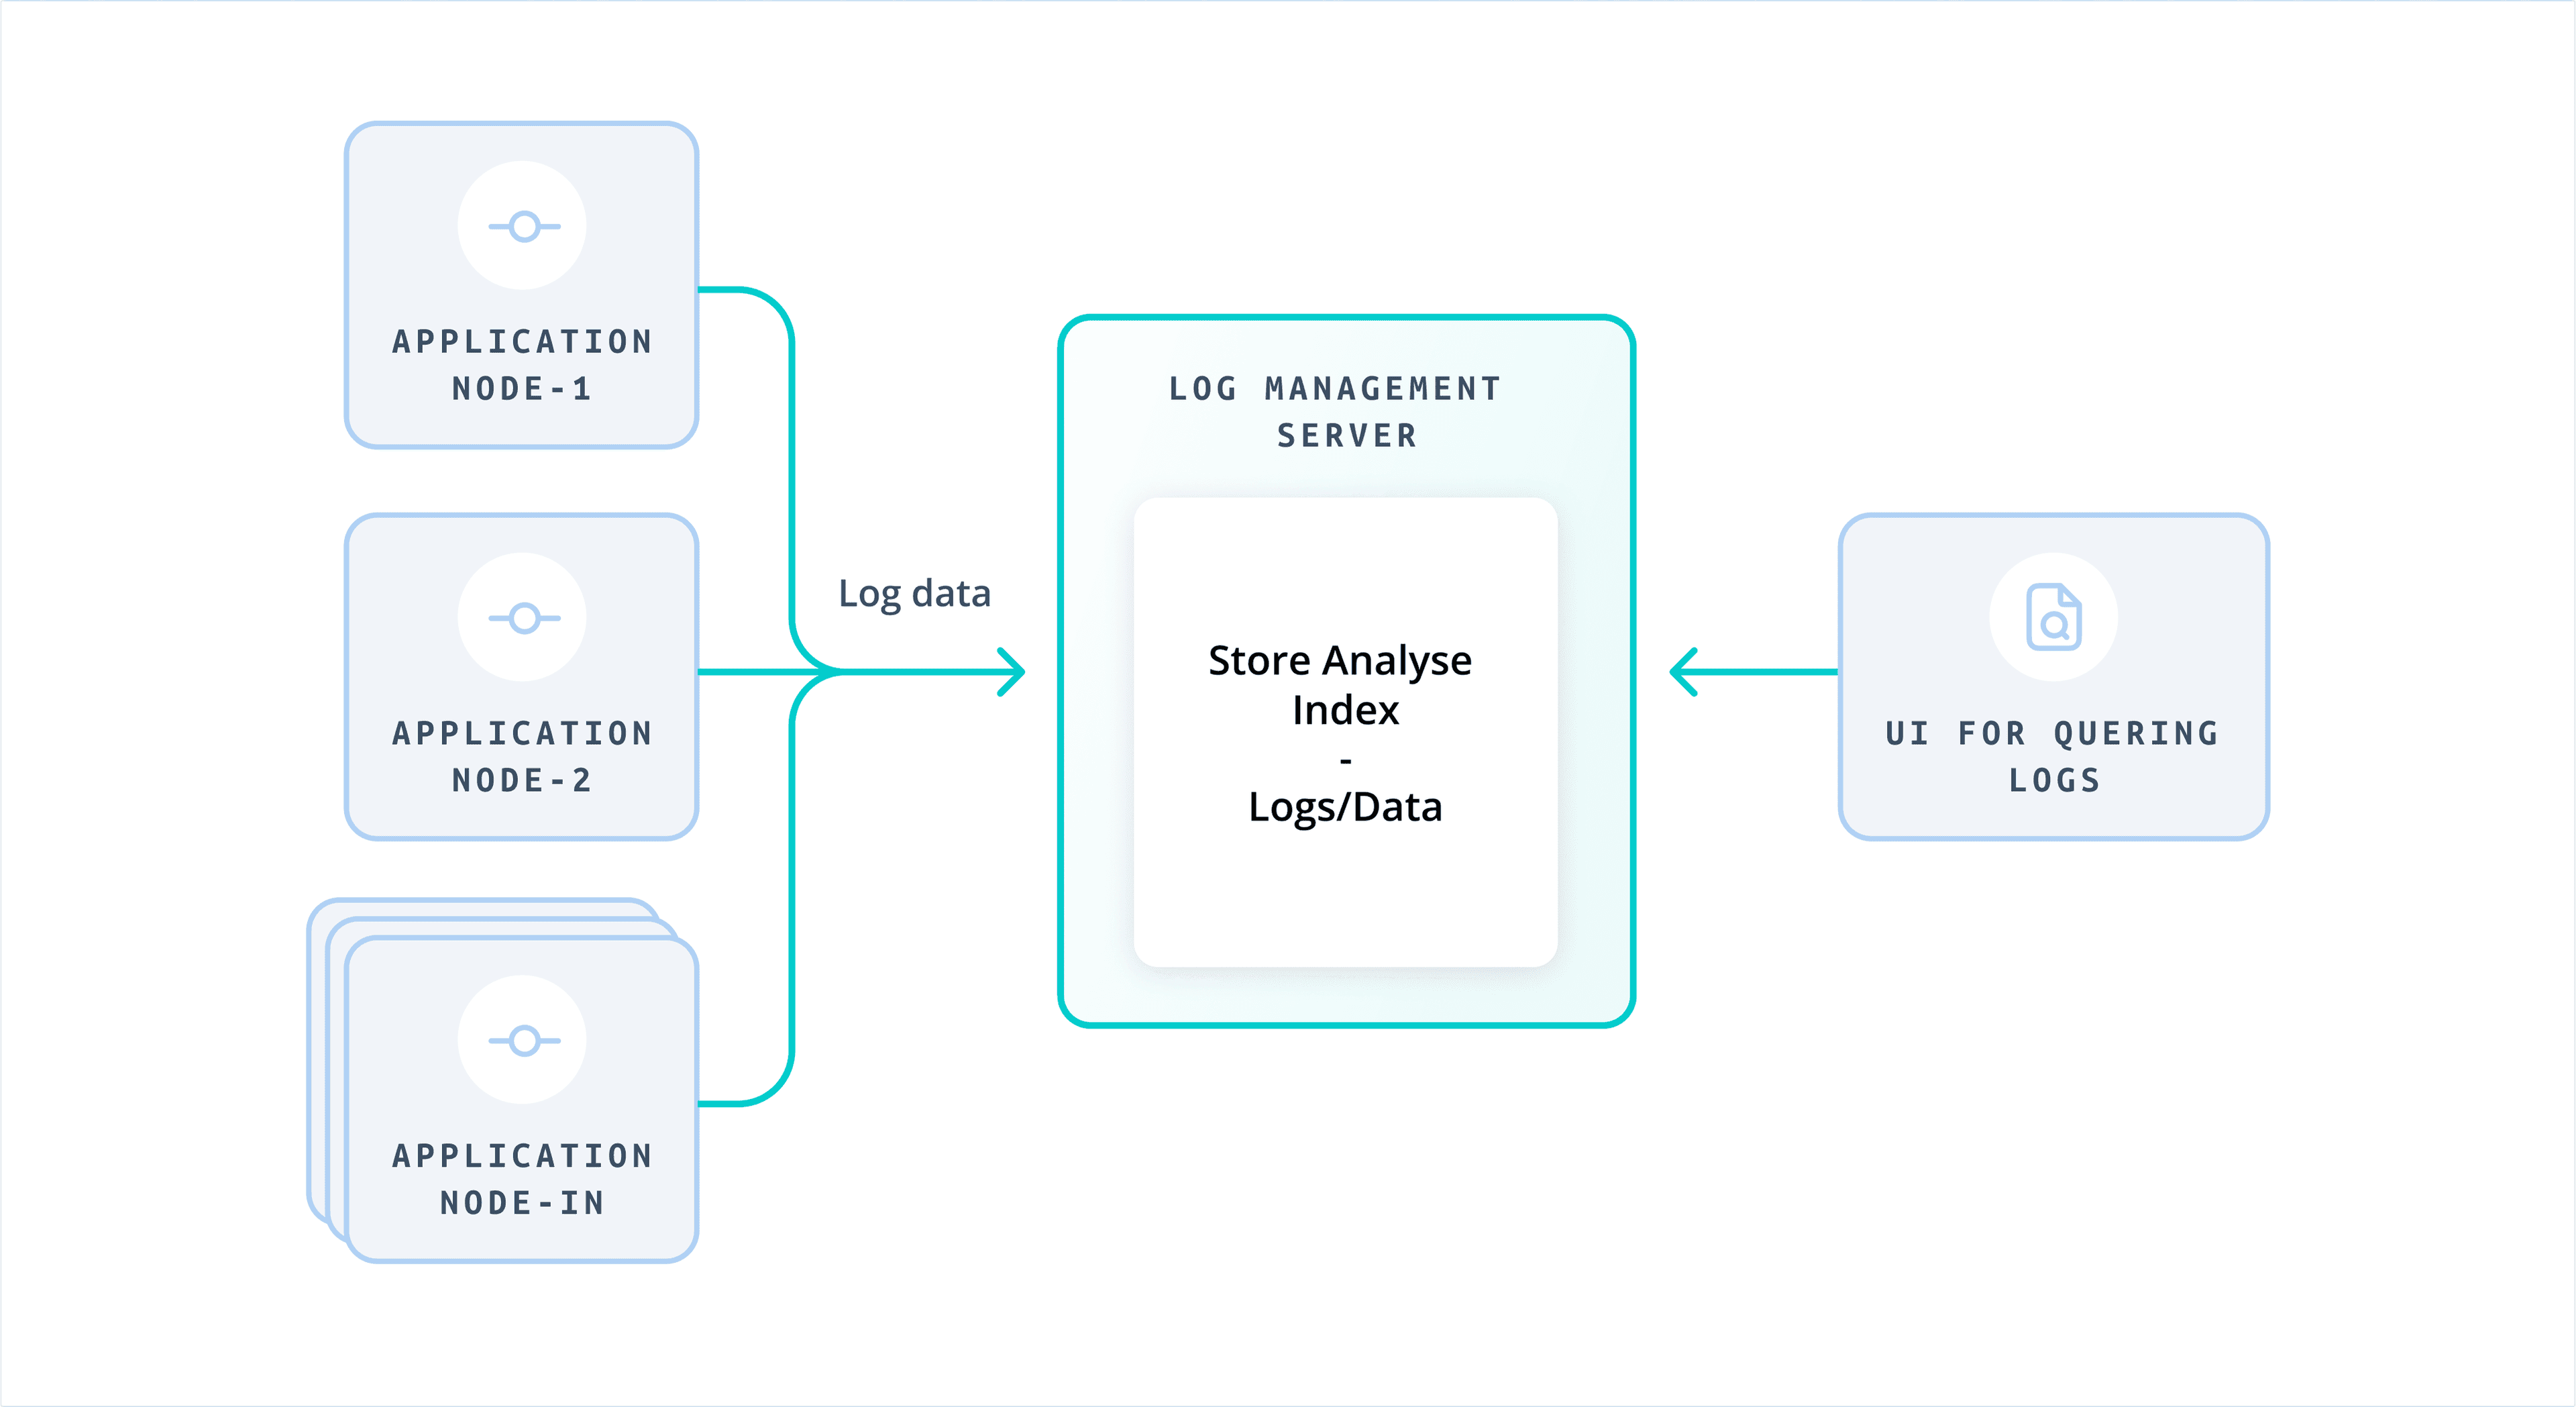
Log monitoring refers to the process of collecting, analyzing, and managing logs generated by systems, applications, users, etc. to gain insights into system operations, performance, and potential issues. It is normally a continuous process of tracking, analyzing, and acting upon log data generated by systems, applications, and devices. This data, which includes system events, error messages, performance metrics, and security alerts, provides valuable insights into system health, performance, and security.
Whether it's spotting unauthorized access, abnormal user behavior, or early signs of a data breach, log monitoring provides the context you need to take action. By continuously analyzing the data your systems generate, it surfaces root causes, speeds up troubleshooting, and keeps your environment stable and secure. In short, it’s an essential tool for any IT team aiming to stay ahead of issues before they spiral out of control.
Ok, let's back-up, what are logs?
Logs are timestamped records of events or messages generated by systems, applications, or processes. They offer a behind-the-scenes look at what’s happening: system performance, user activity, errors, and other operational details. From debugging to detecting security incidents, logs are essential for understanding and managing complex environments.
In the context of Cribl, logs play a key role in monitoring and troubleshooting the behavior of components like Leaders, Workers, and Edge Nodes. These include:
API Server Logs: Capturing events from API processes, including telemetry and license checks;
Worker Process Logs: Tracking data processing activities;
Leader Node Logs: Logging API calls, audit actions, and system notifications;
Special Logs: Like cribl_stderr.log, which flags critical issues such as out-of-memory errors.
These logs are typically stored in $CRIBL_HOME/log/ and managed via log rotation to optimize disk usage. By collecting and analyzing them, teams can spot issues early and understand what’s going on under the hood.
Why is log monitoring important?
Log monitoring is important because it provides critical insights into the performance, health, and operational status of systems and applications. In the context of Cribl products, log monitoring helps:
Troubleshooting and Issue Resolution - Logs capture detailed information about system events, errors, and warnings, enabling users to identify and resolve issues quickly. For example, logs can help pinpoint configuration errors, connectivity issues, or resource bottlenecks.
Proactive Problem Detection - By monitoring logs in real-time, users can detect anomalies, potential failures, or performance degradation before they escalate into critical problems.
System Health and Performance Insights - Logs provide visibility into resource utilization (e.g., CPU, memory, and network bandwidth) and data processing metrics, helping users optimize system performance and plan for future capacity needs.
Compliance and Auditability - Logs serve as a record of system activity, which is essential for compliance, auditing, and forensic investigations.
Centralized Management - Consolidating logs from multiple sources into a single platform simplifies analysis, troubleshooting, and reporting.
Customizable Detail Levels - Cribl allows users to adjust logging verbosity (e.g., info, debug, silly) to balance the need for detailed information with system performance and storage considerations.
Benefits of log monitoring
Log monitoring is more than just tracking errors—it's the backbone of system health, security, and operational agility. Here’s how it helps your team stay ahead:
Proactive Issue Detection: Log monitoring helps identify anomalies, errors, or performance degradation early, allowing you to address issues before they escalate into critical problems.
Efficient Troubleshooting: Logs provide detailed insights into system operations, making it easier to diagnose and resolve issues quickly. Adjusting logging levels (e.g., debug or silly) can provide even deeper insights when needed.
System Health and Performance Optimization: By monitoring logs, you can track resource utilization (CPU, memory, network) and data processing metrics, enabling you to optimize system performance and plan for future capacity needs.
Centralized Log Management: Consolidating logs from multiple sources into a single platform simplifies analysis, troubleshooting, and reporting. Cribl supports centralized monitoring by forwarding logs to external platforms like Elastic, Grafana, or Loki. Read more about Centralized Log Management.
Compliance and Auditability: Logs serve as a record of system activity, which is essential for compliance, auditing, and forensic investigations.
Real-Time Alerts and Notifications: Log monitoring enables you to set up alerts for specific conditions, such as high error rates or node failures, ensuring timely responses to critical events.
Customizable Logging Levels: Cribl allows you to adjust logging verbosity to balance the need for detailed information with system performance and storage considerations.
Enhanced Visibility Across Deployments: In distributed deployments, Cribl consolidates logs from Leaders and Workers, providing a deployment-wide view of system health and operations.
The real-world challenges of traditional log monitoring tools
Traditional log monitoring tools often face several challenges. Let’s break them down for clear understanding.
Scalability Issues
Traditional log monitoring tools often hit a wall when it comes to scaling. As log data grows in volume, variety, and velocity, many tools struggle to keep up—leading to lag, dropped logs, or performance bottlenecks that slow down analysis and response.
Limited Flexibility
Most legacy tools offer limited options for customizing how logs are filtered, processed, or routed. This makes it hard to tailor log management workflows to specific teams or business needs, especially in complex environments.
High Storage Costs
Storing raw log data long-term can be costly. Without built-in features like field suppression, sampling, or compression, organizations end up paying more for storing data they may never use. Learn more about Long-Term Storage.
Complex Configuration
Getting traditional tools set up correctly is often a slow and manual process. Dealing with varied log formats and sources can introduce errors, delays, and a steep learning curve for teams trying to get value quickly.
Lack of Real-Time Insights
Not all tools are built for real-time log processing. This delay in surfacing issues can have real-world impacts—like missing early signs of a system failure or security event.
Inefficient Resource Utilization
Legacy systems can be resource hogs. They often require significant CPU, memory, or storage to function, which adds overhead—especially when scaling across large or distributed environments.
Duplication and Overlap
When configurations aren't optimized, duplicate log entries can flood your system. This not only wastes storage but also slows down processing and makes analysis less reliable.
Limited Integration
Many older tools weren’t built with cloud or hybrid environments in mind. As a result, integrating them with modern observability stacks or third-party platforms is often clunky or unsupported.
Difficulty in Handling Complex Log Formats
Non-standard or nested log formats are common today. Traditional tools often fall short when parsing these logs, requiring manual interventions to clean or normalize the data.
Compliance and Audit Challenges
Meeting compliance requirements is tough if your log tools don’t support robust auditing, metadata tagging, or retention policies. Without these features, proving accountability or responding to audits becomes much harder.
Modern solutions like those offered by Cribl, address these challenges by offering scalable, flexible, and efficient log monitoring capabilities, including real-time processing, customizable pipelines, and integration with various destinations. For example, Cribl Stream can reduce log volume by 20–30% through data optimization techniques, making it more cost-effective and efficient.
Why using data pipelines to control log data matters more than ever
Using pipelines to control logs, like in Cribl Stream offers several advantages, particularly for optimizing, managing, and routing log data effectively. Here are the key reasons:
Data Optimization
Pipelines allow you to reduce log volume by removing redundant fields, dropping unnecessary events, or downsampling frequent logs. For example, dropping debug-level logs from VMware ESXi servers can reduce data volume by 80–90%.
Custom Processing
Pipelines enable tailored processing for different subsets of data. For instance, you can enrich firewall logs with DNS or GeoIP data, while applying different transformations to DHCP or authentication logs.
Improved Performance
By filtering and processing only the necessary data, pipelines reduce the workload on downstream systems, improving their performance and responsiveness.
Flexibility and Scalability
Pipelines can be configured for specific use cases, such as pre-processing, processing, or post-processing, to handle diverse log sources and destinations. This modular approach ensures scalability in large or complex environments.
Metadata Management
Pipelines can add or modify metadata fields (e.g., sourcetype, index) to ensure logs are properly categorized and routed to the correct destinations.
Real-Time Processing
Pipelines process logs in real-time, enabling immediate transformations, enrichments, and routing decisions.
Centralized Management
Using pipelines, you can centralize log processing logic, reducing the need to replicate configurations across multiple sources or destinations.
Compliance and Auditability
Pipelines can standardize logs, ensuring they meet compliance requirements and are easier to audit.
Cribl Stream best practices recommend using pre-processing pipelines to normalize incoming syslog data, and processing pipelines to handle specific log types—like firewall or load balancer logs. This setup helps streamline log management and ensures your data is processed efficiently and in a way that fits your environment.
How does Cribl unlock the value of log monitoring?
Cribl simplifies and strengthens log monitoring through its products like Cribl Stream and Cribl Edge, offering powerful tools to collect, analyze, and manage logs across distributed systems. Here’s how Cribl helps teams get the most out of their log data:
Centralized Log Management: Cribl allows users to monitor logs from Leaders, Workers, and Edge Nodes in distributed deployments. Logs can be accessed and searched from a single location, such as the Monitoring > Logs page.
Log Types: Cribl supports various log types, including:
- API Server Logs: Capturing telemetry and license validation.
- Worker Process Logs: Emitted by Worker processes handling data processing.
- Fleet Logs: Logs related to configuring Worker Groups or Fleets.Customizable Logging Levels: Users can adjust logging verbosity (error, warn, info, debug, silly) to control the detail captured. This ensures efficient troubleshooting without overwhelming the system with excessive data.
Real-Time Log Search: Logs can be queried using JavaScript expressions, filtered by fields, and searched across time ranges. Cribl also provides tools like typeahead assist and field-based query building for ease of use.
Log Rotation and Retention: Logs are rotated every 5 MB, with the most recent 5 logs retained. For long-term storage, Cribl recommends forwarding logs to external destinations.
External Forwarding: Cribl supports forwarding internal logs and metrics to external monitoring solutions using the Cribl Internal Source. Logs can be routed through pipelines for further processing or enrichment before being sent to destinations.
Pipeline Integration: Pipelines allow users to filter, enrich, and route logs efficiently. For example, logs can be enriched with metadata or filtered to reduce unnecessary data volume.
Exporting Logs: Logs can be exported as JSON files for further analysis or archival purposes.
Monitoring Health and Metrics: Cribl provides tools to monitor system health, inputs, outputs, and traffic, offering a deployment-wide view of operations.
For more details, see Cribl Stream Monitoring Documentation or Cribl Edge Monitoring Documentation.
FAQ about Log Monitoring
What’s the difference between log monitoring and log analytics?
Log monitoring focuses on real-time tracking of logs to detect and resolve system issues quickly. Log analytics digs into historical log data to uncover trends and optimize performance. They’re complementary: monitoring handles immediate issues; analytics supports long-term insights and decision-making.
What are best practices for optimizing log volume in Cribl?
Reduce log volume by removing redundant fields and dropping low-value logs. Use the Drop or Suppress functions to manage noise and avoid unnecessary data storage. This helps improve performance and lower storage costs without sacrificing log fidelity.
How should I use pipelines in Cribl for better log monitoring?
Use dedicated pipelines for specific data types like firewall or DHCP logs. Enrich logs with context such as GeoIP or DNS data. Add metadata fields to improve categorization, routing, and downstream usability.
What’s the best way to centralize log management in Cribl?
Collect logs close to their source to reduce latency. Use load balancers to evenly distribute ingestion across Worker Nodes for high availability and scalable performance in large environments.
How do I manage logging levels effectively in Cribl?
Set logging verbosity to info by default, and use debug or silly levels only during troubleshooting. This ensures logs remain informative without overwhelming storage or processing capacity.
Why is timestamp accuracy important in log monitoring?
Accurate and standardized timestamps are crucial for correlation and troubleshooting. Ensure logs from different time zones or systems are normalized to maintain timeline consistency across your monitoring tools.
How can I monitor system health using Cribl?
Analyze logs regularly to detect anomalies, resource constraints, or operational issues. Forward logs to external observability platforms for deeper analytics and long-term trend monitoring.
What is log rotation, and why does it matter?
Log rotation manages disk usage by archiving or deleting old logs. Cribl rotates logs every 5 MB and retains the five most recent files, ensuring storage is used efficiently while retaining recent data for troubleshooting.
How should I plan for high-volume log senders?
Use load balancers and plan capacity for large-scale sources like firewalls. Distribute load across multiple Workers to avoid bottlenecks and ensure consistent log ingestion.
How does Cribl integrate with downstream systems?
Cribl can forward enriched and filtered logs to platforms like Splunk, Elasticsearch, or cloud storage. This supports compliance, analysis, and long-term retention, while reducing unnecessary data transfer.
How does Cribl help with syslog management?
Cribl Stream can replace traditional syslog servers. It offers real-time enrichment, filtering, and routing of syslog data—making it easier to manage, scale, and customize log pipelines.