

In this post, we’ll discuss two functions in the Cribl Stream arsenal: The Aggregations function, which allows you to perform stats and metrics collection in flight, and the Chain function allows you to call one Pipeline from within another. The event flow will continue when the Chained Pipeline returns. To demonstrate their use, we’ll answer this question: How long did it take for Cribl to process events using your pipeline?
The preview interface included in Cribl Stream is fantastic for getting feedback on what your filters and tweaks are going to do to your data:
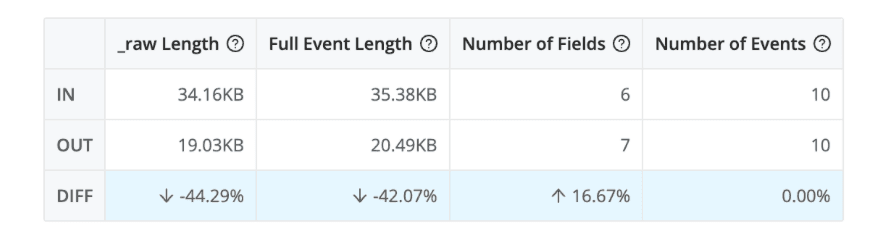
These stats, and the preview OUT of your sample file, are excellent. But sometimes you want a larger sample or even a different measurement. What if you wanted to measure and track how long your pipeline is taking to process real, live data?
First, let’s see how we can measure time. Then we’ll see how to aggregate that new metric in flight. And finally, we’ll demo how to use Chain to organize and re-use functions.
The simple overview:
Get current time in milliseconds
Do Work™
Get the difference between the current time and the time above in ms
The Details:
First, I’m going to assume you have a functioning pipeline you’d like to measure the performance of.
Next, add an Eval function to the Pipeline and slide it up to the first slot. Add a single field as below:
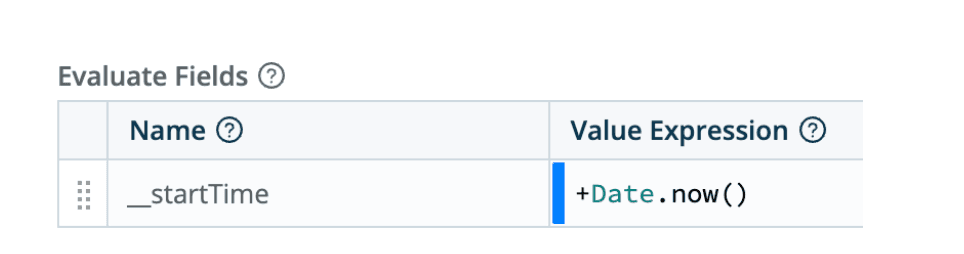
What this does: We are creating an internal field, as indicated by the double underscore. Internal fields are not passed along to the destination. They only exist while the pipeline is handling the event. We are setting this field equal to the current time, in milliseconds since Epoch. The prepended plus sign tells the processor we want the numeric version of the date, not a date object.
Then, add another Eval function to the end of the Pipeline. Add a single field as below:
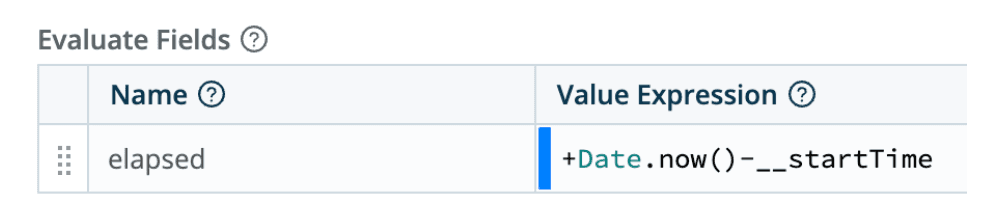
What this does: We are creating a field containing the difference between the current time, in ms, and the __startTime field we created in the previous step. So each event will now have a top-level field called elapsed that will show how long, in ms, it took Stream to process.
Noice. Click Save, Commit & Deploy, and Bob’s your aunt’s husband!
You can now use this new data in your log analysis tier to grab extremes and averages and percentiles and more. For example, in Splunk it would be quick and easy to run:
| tstats max(elapsed) as max p95(elapsed) as perc95where index=someindex by _time span=1m
Aggregation Magix
Let’s kick it up a notch. We’ll have Stream do the stats functions before sending to the destination.
The shiny new plan:
Get current time in milliseconds
Do Work™
Get the difference between the current time and the time above in ms
Create aggregation stats in Stream
Let’s go!
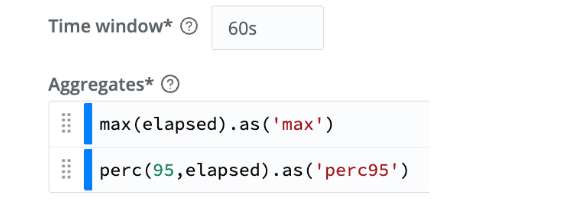
Add an Aggregations function after the last Eval. Set the time window to 60s, and add 2 Aggregates, 1 for max and 1 for 95th percentile as shown:
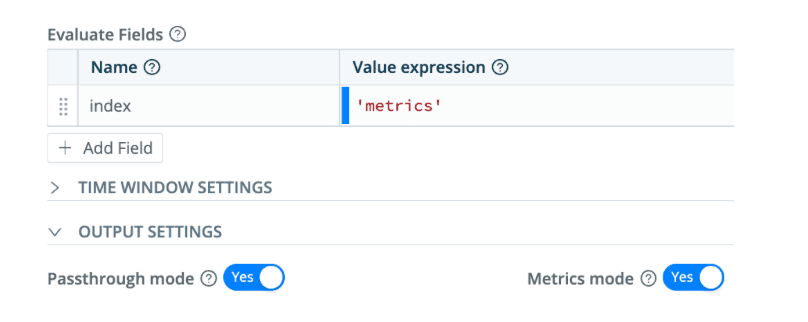
Add an entry under Evaluate Fields to set the index, and under OUTPUT SETTINGS, toggle Passthrough mode to yes, and Metrics mode also to yes.
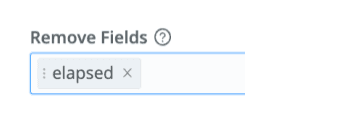
Almost there… add another Eval function to the end and drop the elapsed field:
Click Save, then Commit & Deploy.
What this does: We are aggregating the events coming through the pipeline in 60 second blocks, tracking max and 95th percentile readings on elapsed. We redefined the destination index as ‘metrics’ so the new events will land there, and we toggled Metrics mode to ‘yes’. (Change the index name as required.) Because we checked Passthrough mode ‘yes’, a new event will be generated every 60 seconds with the stats you’ve specified above, max and perc95, and the original events will be delivered as normal.
And finally, in the last Eval we drop the elapsed field from the original events since we’ve already used it to get what we need.
Testing
In Stream, start a capture with a filter of perc95 && max, and be sure to select stage 4, “Before Destination”. Following carefully, you should see an event every 60 seconds with the requested stats. Or you can use your analysis tool, search there, and even trend the results over time. Or set-up alerts to identify pipelines that are taking too long.
Alas, in Chains
Let’s take it one step further still. Chains were introduced in Cribl Stream 3.2.0. They allow you to reference other pipelines (or Packs) from within the working pipeline. In this case, we want to create a wrapper around your original pipeline (before we started working on it above).
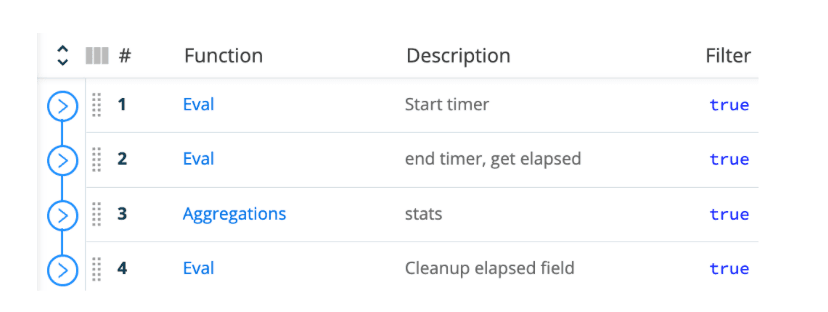
Create a new pipeline with the functions we discussed above:
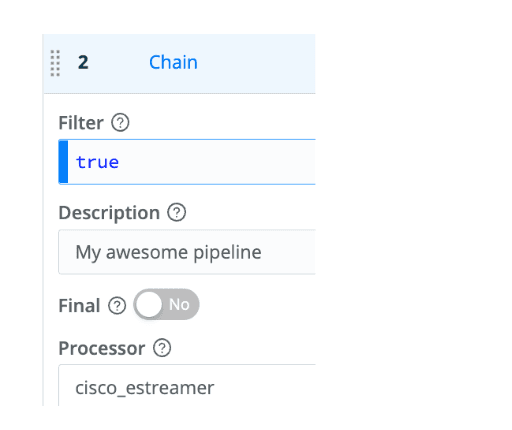
Now add a Chain function and place it between steps 1 and 2. Set the Chain function’s Processor field to your original pipeline.
Your new pipeline should look something like this:
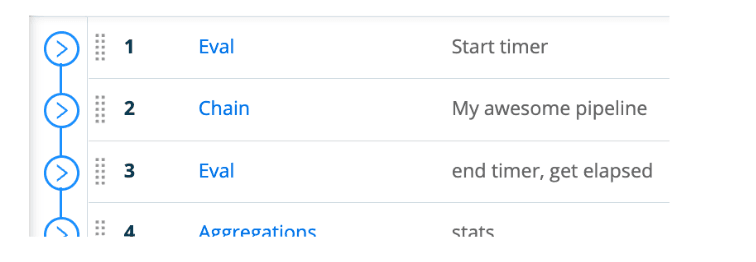
Save.
Finally, in your routing table or Quick Connect, reconfigure the route for your data to point to this new pipeline.
Click Save, then Commit & Deploy.
What this does: Events will travel into this new pipeline. First, they will trigger the timer, then your target, the original pipeline will handle the event. When done, the event will return to this pipeline, and the timer will stop, we’ll aggregate elapsed, and finally publish both the original event and the once-per-60-seconds aggregated event.
Next Steps
You could do more than check elapsed time. Counts, event length, the sum of a field’s value, group by host, or client ID… there are quite a few functions available in Aggregations. If you come up with an interesting use case, join us in our Slack Community and share the story!
Conclusion on Aggregations and Chains in Cribl Stream
The Aggregation function allows you to offload many workloads you may currently be running in scheduled summary searches, or worse, running at search time on raw data. Ew! The Chain function gives you more flexibility to reuse code and how you organize your Pipelines in Cribl Stream.
With the simple dog food example of measuring Cribl Stream performance, I hope this post helped you understand these 2 functions and maybe shed some light on how events flow through the system.
The fastest way to get started with Cribl Stream and Cribl Edge is to try the Free Cloud Sandboxes.