$ scope /bin/echo “sushi”
It’s that easy to get visibility into an application. As engineers, we tend to love complexity, and I’m no different. I know complicated: I spent my last 4 years at AppDynamics working my way up to leading a team of specialist technical ninjas.
This team was the best of the best, we parachuted into the most complex landscapes to put out fires and build success. (Thankfully, I’ve managed to hire a few of these ninjas here at Cribl as well!) We supported massive deployments and automated rollouts with round-the-clock change windows, hybrid architectures, and containers as far as the eye could see.
But complex isn’t always necessary; in fact, it’s often the enemy of success. My primary job was actually to take a very powerful technology and boil it down to a dashboard or two that an executive could look at, while sipping their morning coffee, and understand how their business was running.
Let that sink in. I supported a tool that could give you line-of-code visibility into how an application stack was performing, and I spent the majority of my time working with senior leaders to build a single dashboard that reported whether or not an application was negatively impacting their KPI of the year. Let’s just say I’m now sold on the idea of keeping things simple.
Two-Tier Architecture
Every visibility tool I’m familiar with today uses a two-tier model. You have something that gets the data (an agent collector or tracer), and a system of analysis (an indexer controller or dashboard). This means that to get any sort of visibility, you have to buy into the vendor’s ecosystem and that new data stays locked within that ecosystem.
How do you integrate all of this valuable new data into your existing processes? The NOC only has so many screens, so you need to get this new data into the old dashboards. Where do you put the new system of analysis? Do you provision new servers, or do you replace old stuff? Can you put it in the cloud?
Wouldn’t it be great if you could get additional visibility without having to completely buy into a new way of reporting, alerting, and dashboarding? That’s something that Cribl AppScope will give you. It isn’t dependent on any one system of analysis. AppScope frees you to collect data from anywhere, and send the data anywhere. If you like, you can use it with Stream to easily route and shape the data for whatever dashboarding tool you are using today.
Too Much Visibility?
Don’t get me wrong, bytecode instrumentation is insanely cool. Being able to see the timing all the way down to individual lines of code. So is looking at the memory dump off an IC chip – and just like pulling the firmware off a chip, bytecode instrumentation is difficult. It’s also really verbose, and by verbose, I mean noisy.
Different vendors have different approaches to managing this. Some use a blacklist approach. (Give me all the data first. I hope you know what you’re looking for.) Others use a whitelist approach. (What are you looking for? I can probably show it to you.) Either way, you spend a huge amount of time having to predefine success. At the scale of most enterprises, this means that rolling out traditional APM takes a long time.
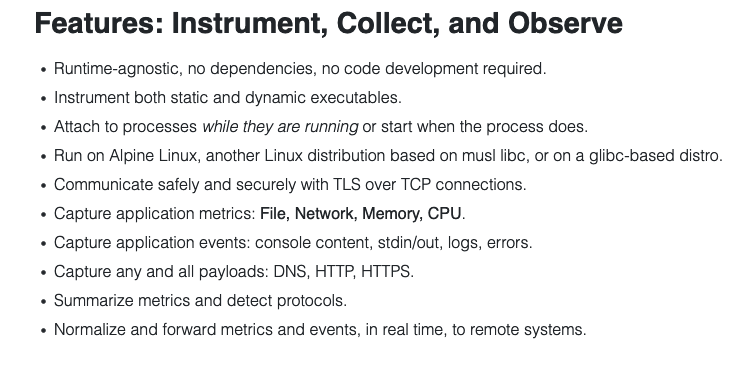
AppScope is changing that. It’s easy to get up and running, it provides a ton of visibility – everything you’d expect – but it’s bundled, such that the data collected can be easily shipped off to any tool you are using today. Push the data into Stream, route it to your existing tools, and show it on the dashboarding tool you are already using.
AppScope
In order for instrumentation to be successful, it needs to provide 100% penetration of the landscape. All of your machines, on-prem or in the cloud, virtualized or containerized. It needs to provide enough visibility to be useful, but not overwhelmingly so. It has to be easy enough that enterprise organizations can deploy it. It should be open source.
AppScope is doing all of the above. AppScope is lightweight enough and easy enough to use, that it can be deployed across an entire landscape. It’s agnostic to the application it’s monitoring. It’s Apache-licensed, open-source, black-box instrumentation technology; and when you couple AppScope with Stream, you can send the data anywhere you want.
Try It Yourself!
AppScope is just that easy and powerful. I challenge you to try Cribl’s free, hosted 30-minute AppScope sandbox and not be impressed. I’d love to hear your feedback; after you run through the sandbox, connect with me on LinkedIn, or join our community Slack and let’s talk about your experience!
The fastest way to get started with Cribl Stream is to sign-up at Cribl.Cloud. You can process up to 1 TB of throughput per day at no cost. Sign-up and start using Stream within a few minutes.

