

SO GOOD YOU WON’T BELIEVE IT’S REAL!
If you’re reading this, you’re probably expecting a funny joke or some form of satirical product announcement. We know today is notorious for companies finally tickling their funny bones and shedding their formal go to market messaging in lieu of celebrating April Fools. Here at Cribl, we never take ourselves too seriously, so April 1st is just another day where we can marry our sense of humor with another game-changing innovation. Today we’re pleased to announce Cribl AppScope, a new open source black-box instrumentation technology which enables ubiquitous observability. In today’s world, infrastructure monitoring is universal. If you ask end users what percentage of their systems are being monitored, most will answer “100%”. Yet, when you ask what percentage of their applications have APM, are instrumented, or are observable, the answer is much closer to “10%”. AppScope makes observing an application as easy as monitoring infrastructure. And trust me, that’s not a joke.
Observability means being able to ask and answer questions that SREs, DevOps, and Security didn’t plan in advance. Observable systems thrive on well-instrumented applications. Ideally, developers modify their applications, perhaps with OpenTelemetry, deeply embedding instrumentation into the fabric of their applications. But, Operations and Security engineers are often tasked with being able to interrogate every application, including off-the-shelf software, applications no longer actively being developed, and applications which haven’t yet been instrumented. AppScope gives basic visibility at an application level to rate, error, and duration of HTTP requests, plus log collection, and resource consumption delivered as logs and metrics to existing tools.
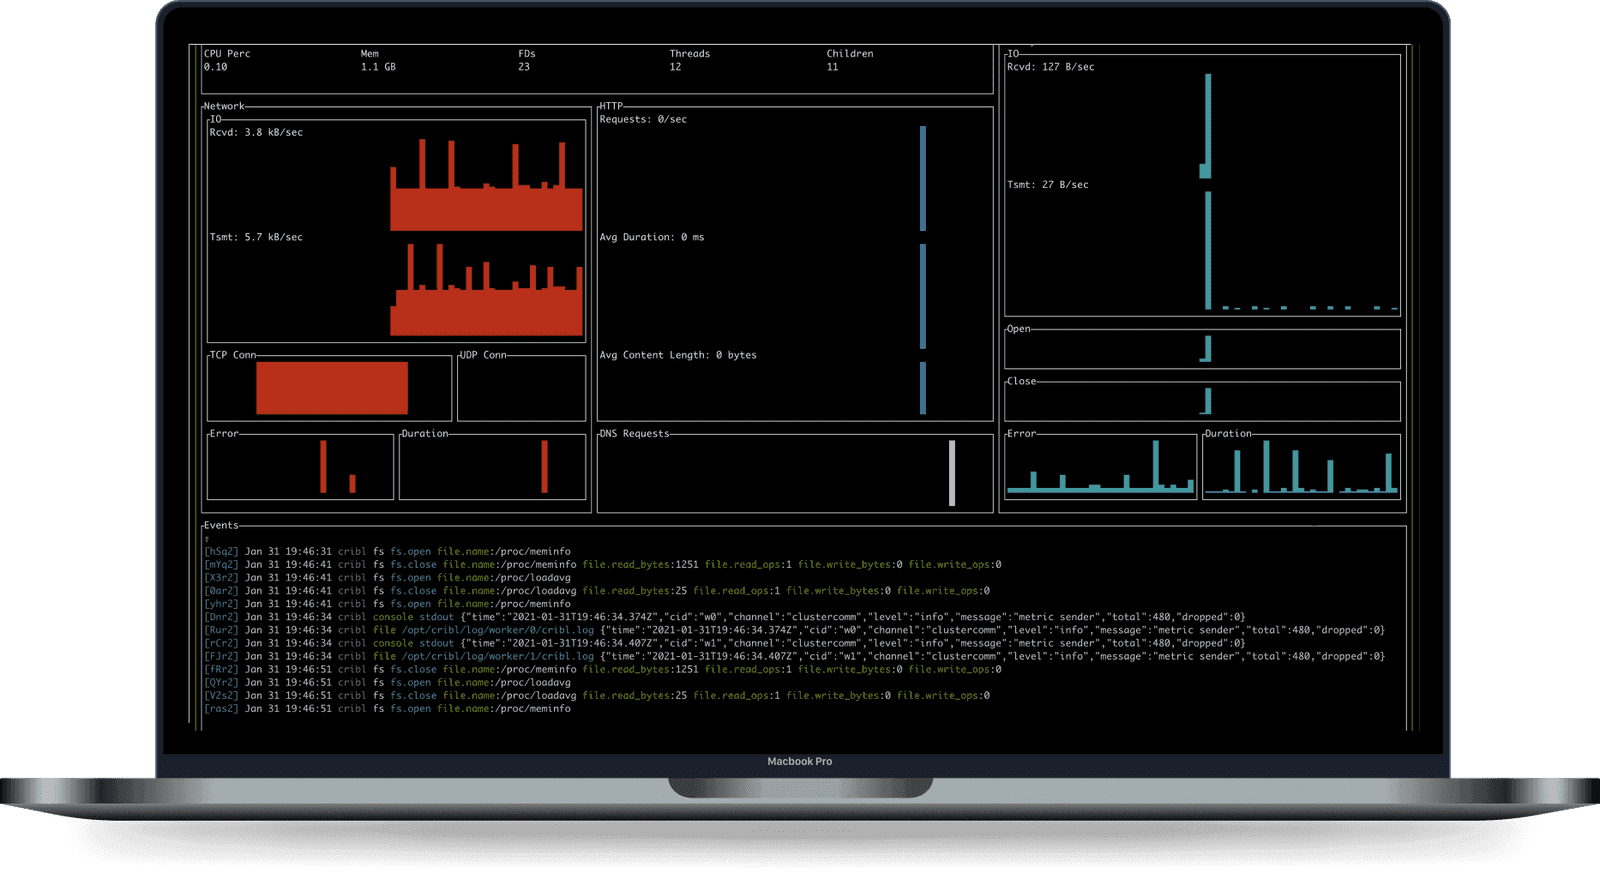
As an agent, AppScope delivers robust application visibility and also automatically collects application logs, without needing a side-car log collector. But, most people start learning a product on their local machine. AppScope scales down to investigating an application on an engineer’s laptop all the way to auto-instrumenting Kubernetes containers. The single user experience is like strace meets tcpdump, but designed to be consumed by a human. Simply prepend scope to any command and it’s instantly instrumented. It’s so remarkably simple we’ve had people not believe it was real, and so we thought it would be funny to release something real that people thought was fake on a day when people are usually releasing fake things trying to make you think they’re real!
In order to make observability as ubiquitous as infrastructure monitoring, we want you to use AppScope whether you use our commercial offerings or not. AppScope outputs data in open formats, which means you can send the output to your existing analytics applications. AppScope is easiest to use with Cribl Stream, which is free up to 1TB/Day to anywhere, but it can also send data to open source agents like Fluentd and Telegraf. The simplest way to get started with AppScope and kick the tires today is through our online sandbox, AppScope Fundamentals. Star the project on GitHub! Also, check out our website, and join us in the Cribl community. We’re friendly and we’d love to hear from you!
To learn more about the origins of AppScope, the problem we’re solving, how we compare to other offerings, and the status of the project, please read on.
AppScope Origins
My background wasn’t always as a vendor. The first decade of my career I spent as a practitioner, with my last role running Application Operations at a reasonably large telecommunications company. We were early believers in service-oriented architecture, a precursor to today’s thinking around microservices. SOA worked great in development, but struggled a lot in operations, where we suffered from massive availability challenges. When applications would crash, or users reported errors, we struggled to get the visibility we needed into our applications. Logs provide visibility, but they have to be planned in advance. What we really needed was visibility into application payloads.
Everything we tried had significant drawbacks. Debug logging was way more than payloads, but could only be turned on in extreme situations due to the load it added to the system. Instrumenting the load balancer with custom TCL and Lua scripts added some visibility, but the approach was esoteric, had high performance risks, and only one or two people could implement it. Fewer folks could understand the output. APM provided better visibility, but gave us little ability to dive into payloads, and we couldn’t afford to put it everywhere.
After moving to the vendor side at Splunk, I wanted to solve this challenge in a way that was universal, no matter the application runtime. Operators shouldn’t have to compromise on visibility because they didn’t write their app in Java, and they shouldn’t be forced to go back to their developers and beg to get SDKs and additional logging added for visibility. We wanted to be able to put operators in control of observability.
At Splunk, I helped create a product called Splunk Stream, which turned wire data (packet captures) into structured logs that were ingested into Splunk. Once again, though, I was stymied, because two problems emerged with this approach: perfect forward secrecy and data volume. In the mid 2010s, most TLS implementations began to favor perfect forward secrecy, which makes it nearly impossible to decrypt TLS-encrypted streams as a man in the middle. As a result, nearly all wire data companies which were using wire data for application intelligence have pivoted to security use cases, where flow-level information is sufficient. Additionally, outputting high fidelity log data for every flow is very voluminous, and customers balked at the costs of putting it into Splunk.
Fast forward to 2017, and I still wanted to find a way to solve ubiquitous application instrumentation. When Ledion and I left Splunk, we brainstormed on many potential ideas we might work on, and this one seemed like a fun challenge. Could we overcome the limitations of a wire data approach? Could we find a way to instrument any application, regardless of the runtime? We (well really Ledion) explored Linux kernel modules, eBPF, ptrace, and many other approaches to introspecting applications, but none of them allowed for seeing inside encrypted payloads. In order to get the data required to understand a user’s experience, to understand which microservice was running slowly, or to find potential malicious activity, we needed to be able to see what was happening on the wire in cleartext, performantly. There was only one approach that seemed viable: function interposition via shared library preloading.
Ledion built a prototype of a library which sat between an application and the shared libraries it was using, like libc or openssl. From this position, we could inspect all the function calls where applications were opening a file or sending data over the network, and most importantly, we could see the cleartext bytes coming from SSL libraries. We enthusiastically put together a very rough prototype (ask us for a demo some time – if you aren’t embarrassed by the first version of something, you shipped too late). We took it out to our network, and the feedback was universal: “This is amazing, but holy shit, what am I going to do with all this data?”
We tabled the idea, but 18 months later, after LogStream was gaining traction, we realized we had already solved the primary objection to universal application instrumentation: the data volume problem. Now, we could gather extremely high fidelity data, spool it in the stream, route it to cheap storage instead of an index, aggregate it, sample it, suppress it, and in general, give people the tools they need to manage high fidelity APM-like data delivered as logs and metrics.
Cribl Team – August 2019
I had met Donn Rochette during my Splunk days while he was the CTO of AppFirst. I knew he had taken a similar approach to Ledion’s prototype, and I reached out to see if he would be interested in creating a new, ubiquitous mechanism of getting application data. Thankfully, he was. Donn brought along John Chelikowsky, and together, they’ve spent the last nearly 2 years building what we call AppScope.
AppScope
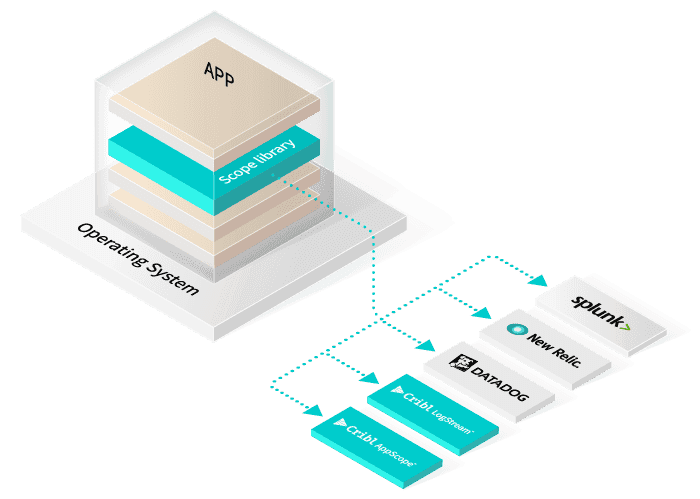
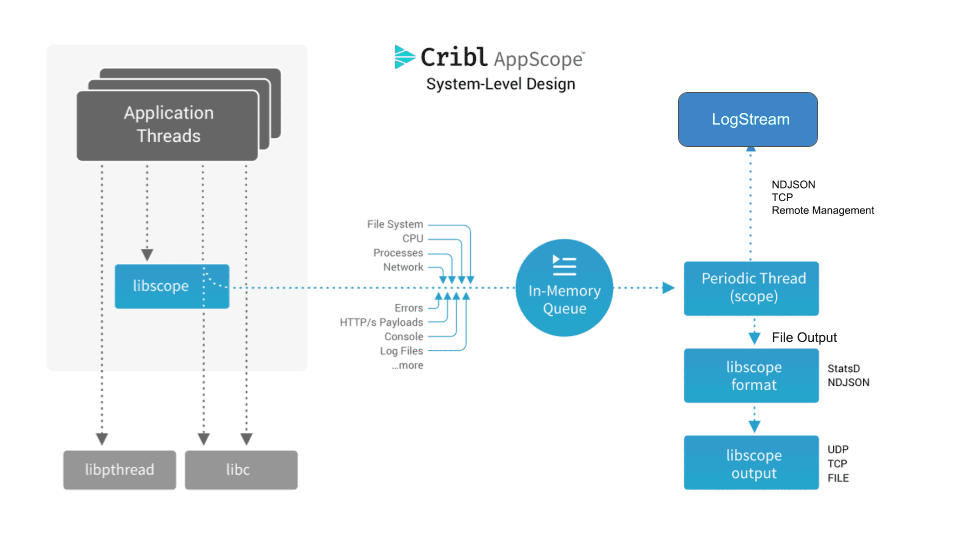
AppScope is Apache-licensed, open source, black-box instrumentation technology, which allows for universal instrumentation of any Linux process, no matter the runtime. AppScope provides a library, called libscope.so, which is embedded in every scope’d process, and it sees all application activity and emits consumable metrics and events. AppScope designed to process high fidelity signals, system and library calls, but output data in a way that’s meaningful to operators and troubleshooters. AppScope’s CLI makes it easy to introspect any Linux process and understand what it’s doing, and the library emits data as metrics and logs in open formats that can be sent to any time-series database or log indexing tool.
AppScope is lightweight, designed to run inside any and every process. AppScope, when paired with LogStream, can send data to dozens of tools: Datadog, Splunk, Elasticsearch, Grafana, Prometheus, Cortex, Thanos, Loki, New Relic, Wavefront, SignalFx, Honeycomb, and many more. But AppScope emits data in open formats, so it can be easily paired open source tools like Fluentd or Telegraf instead of using LogStream. We hope with AppScope, you’ll quickly see the value of an observability pipeline, but in order to achieve our vision of universal instrumentation, we also hope you’ll use it whether you use our commercial offerings or not. By the way, there’s also a free version of LogStream good up to 1TB a day to get you started on the journey to pervasive Observability.
AppScope takes a very different approach than other mechanisms of getting this data. Unlike traditional APM, AppScope is universal and does not require language-specific instrumentation. It works out of the box with everything, with no modification of the application required. It’s kind of magical.
Instrumenting an application can be done by simply prepending scope to any Linux command. Unlike a service mesh or proxy, AppScope does not require terminating one TCP connection and creating another, which adds latency to every request. But, like a service mesh, it’s universal, you can install AppScope in Kubernetes to easily instrument every pod automatically.
Unlike distributed tracing, AppScope can get visibility into your application without requiring developer time. It won’t replace the level of depth and context that hand-instrumenting your code can get you, but it gives just good enough visibility instantly, with zero effort. In addition, it automatically collects all your application’s logs, eliminating the need for sidecar log shippers.
AppScope is already available today. Check out the website, and get started by downloading it onto any Linux VM or container. If you want to learn more, I’d highly recommend our AppScope Fundamentals sandbox, which will walk you through how to use AppScope in an interactive shell right from your browser.
If you want to contribute, AppScope is open source, and we’d love to collaborate with you! Star us on GitHub! If you want to get some help or share what you’re doing with AppScope, we would love to have you in our #appscope channel on Cribl Community!
Check out these other articles on Cribl AppScope:
AppScope Design – Discover the core design principles that went into making AppScope and learn the basics of how it works.
Interposition Mechanisms – AppScope uses function interpositioning as a means to extract information from applications, in this article we delve deeper into application development details.
How AppScope helped resolve a DNS problem – Learn how we used AppScope to identify and resolve a DNS-related problem reported by one of our customers.
Analyzing gRPC and Protobuf – this article shows how AppScope can analyze gRPC protocol traffic, including traffic that is encrypted.
Cribl, the Data Engine for IT and Security, empowers organizations to transform their data strategy. Customers use Cribl’s suite of products to collect, process, route, and analyze all IT and security data, delivering the flexibility, choice, and control required to adapt to their ever-changing needs.
We offer free training, certifications, and a generous free usage plan across our products. Our community Slack features Cribl engineers, partners, and customers who can answer your questions as you get started. We also offer a hands-on Sandbox for those interested in how companies globally leverage our products for their data challenges.