
This blog demonstrates how to create “inputs” to Cribl Search dashboards. An Input is a control widget that we can add to our Dashboards to control how they execute. They allow the user to supply a range of inputs to customize one or many of the Searches in each of the panels on a given dashboard. Currently, there are four types of inputs: a time picker, a dropdown, a string, and a number. This blog shows how to create all four types of Inputs on a dashboard using built-in sample data.
Create a Dashboard
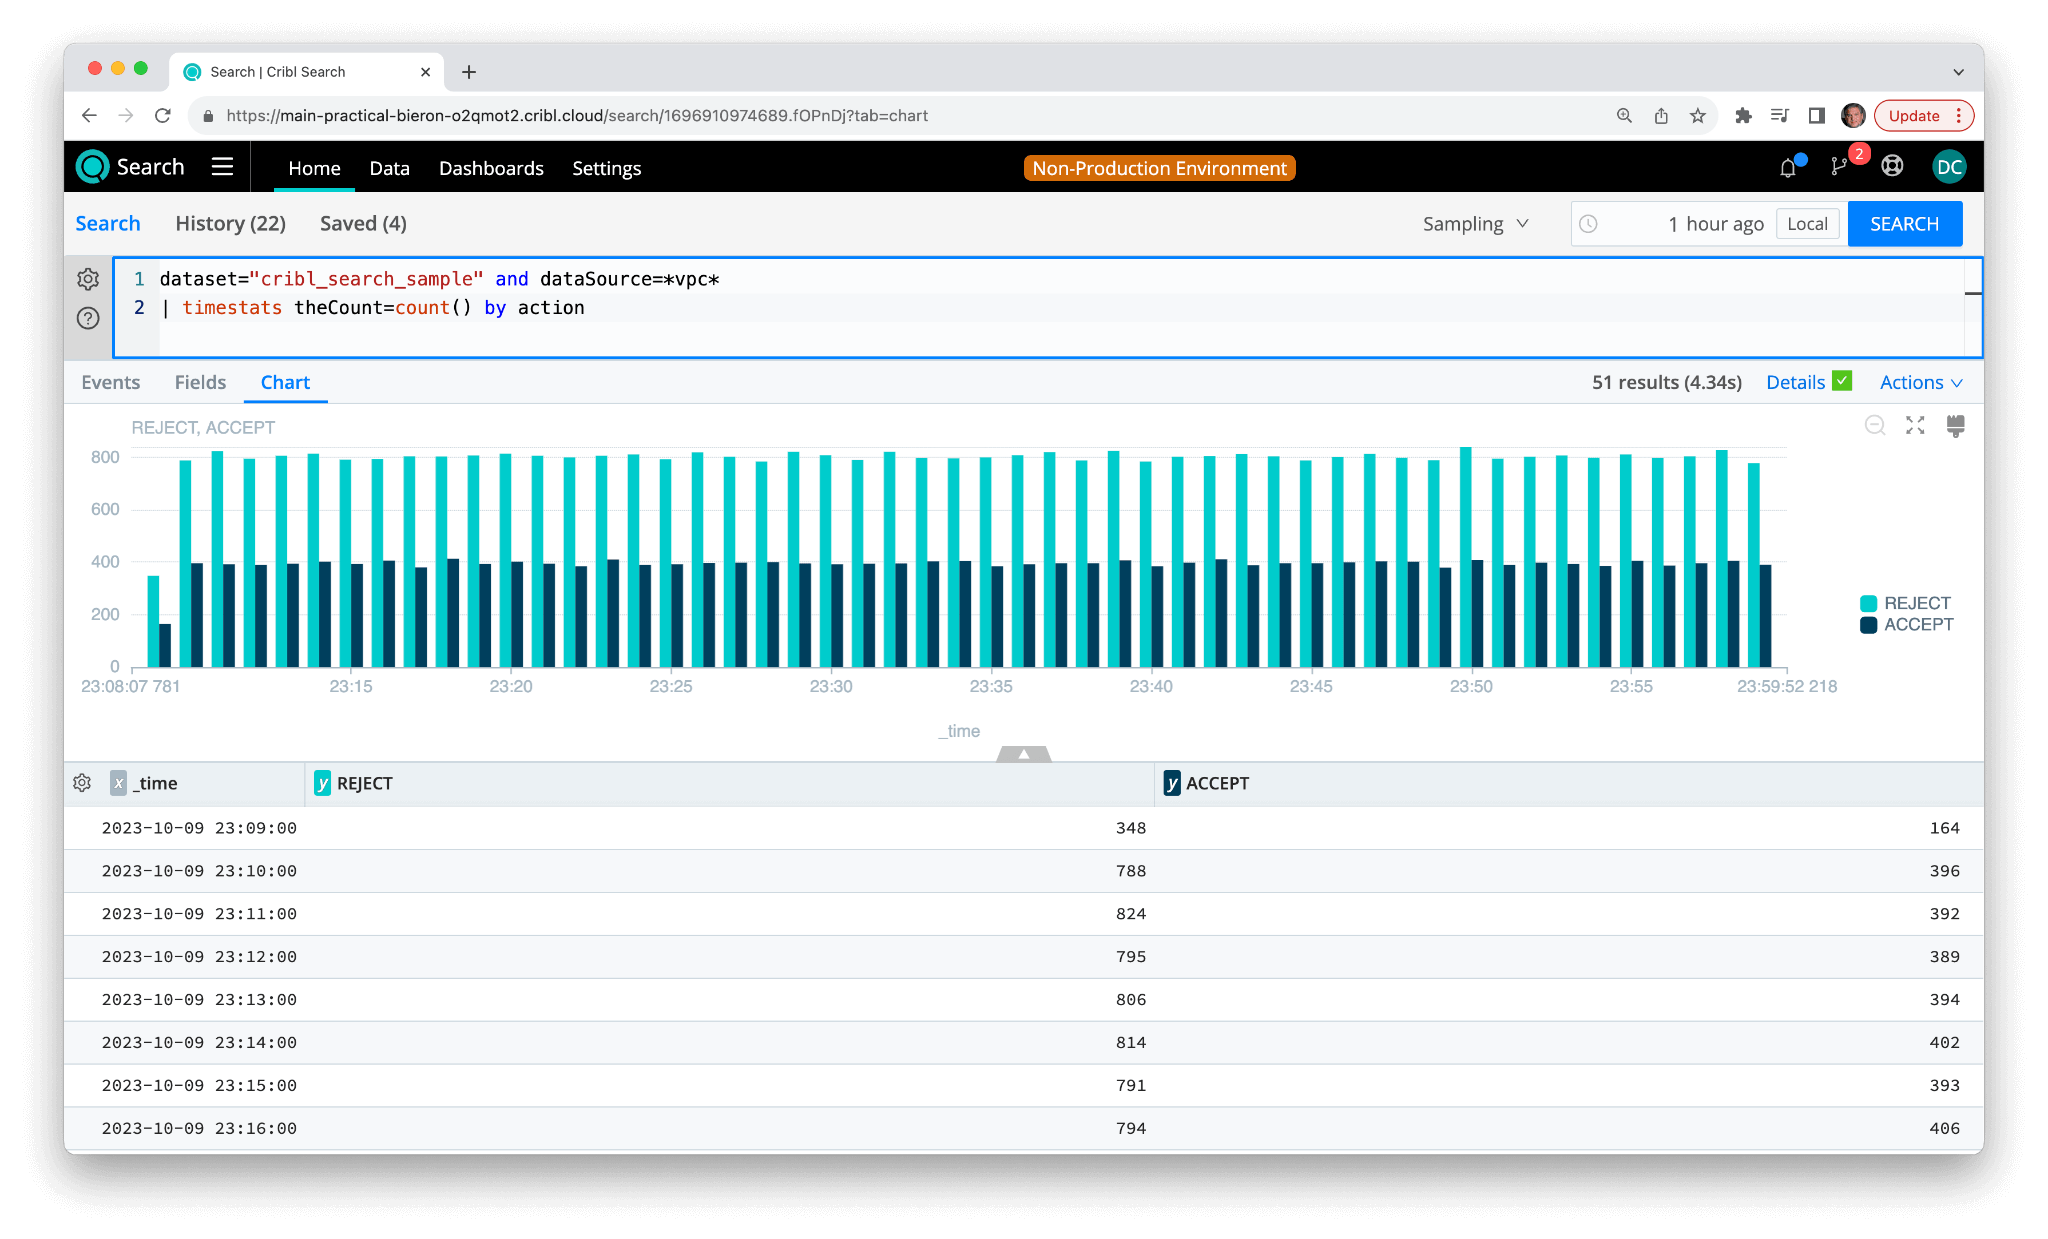
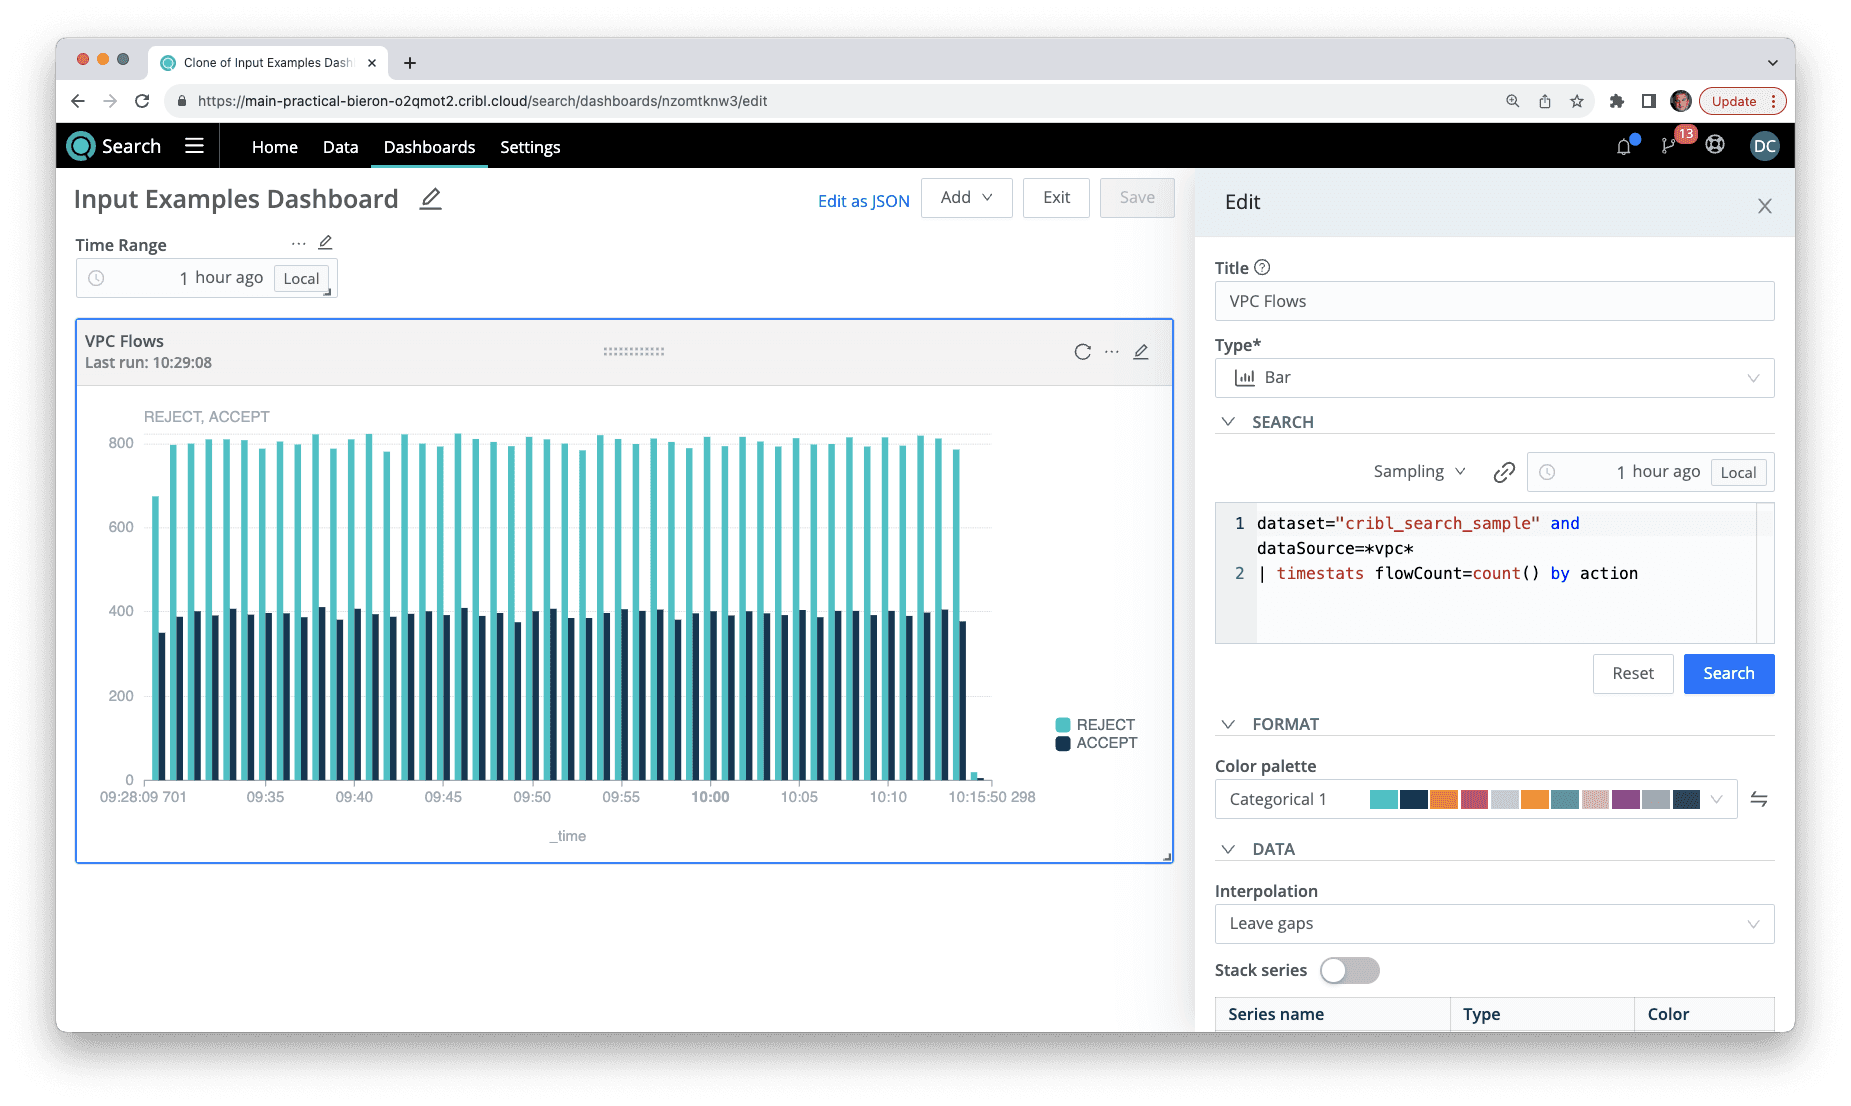
To begin, we create a new search. Let’s look, for example, at the VPC Flow Logs in the built-in “cribl_search_sample”. We can start with this search to count flows by their action, which can have two possible values: Accept or Reject.
dataset="cribl_search_sample" and dataSource=*vpc*
| timestats theCount=count() by action
This will give us a chart of VPC Flow logs broken out by action for the past hour (the default time range).
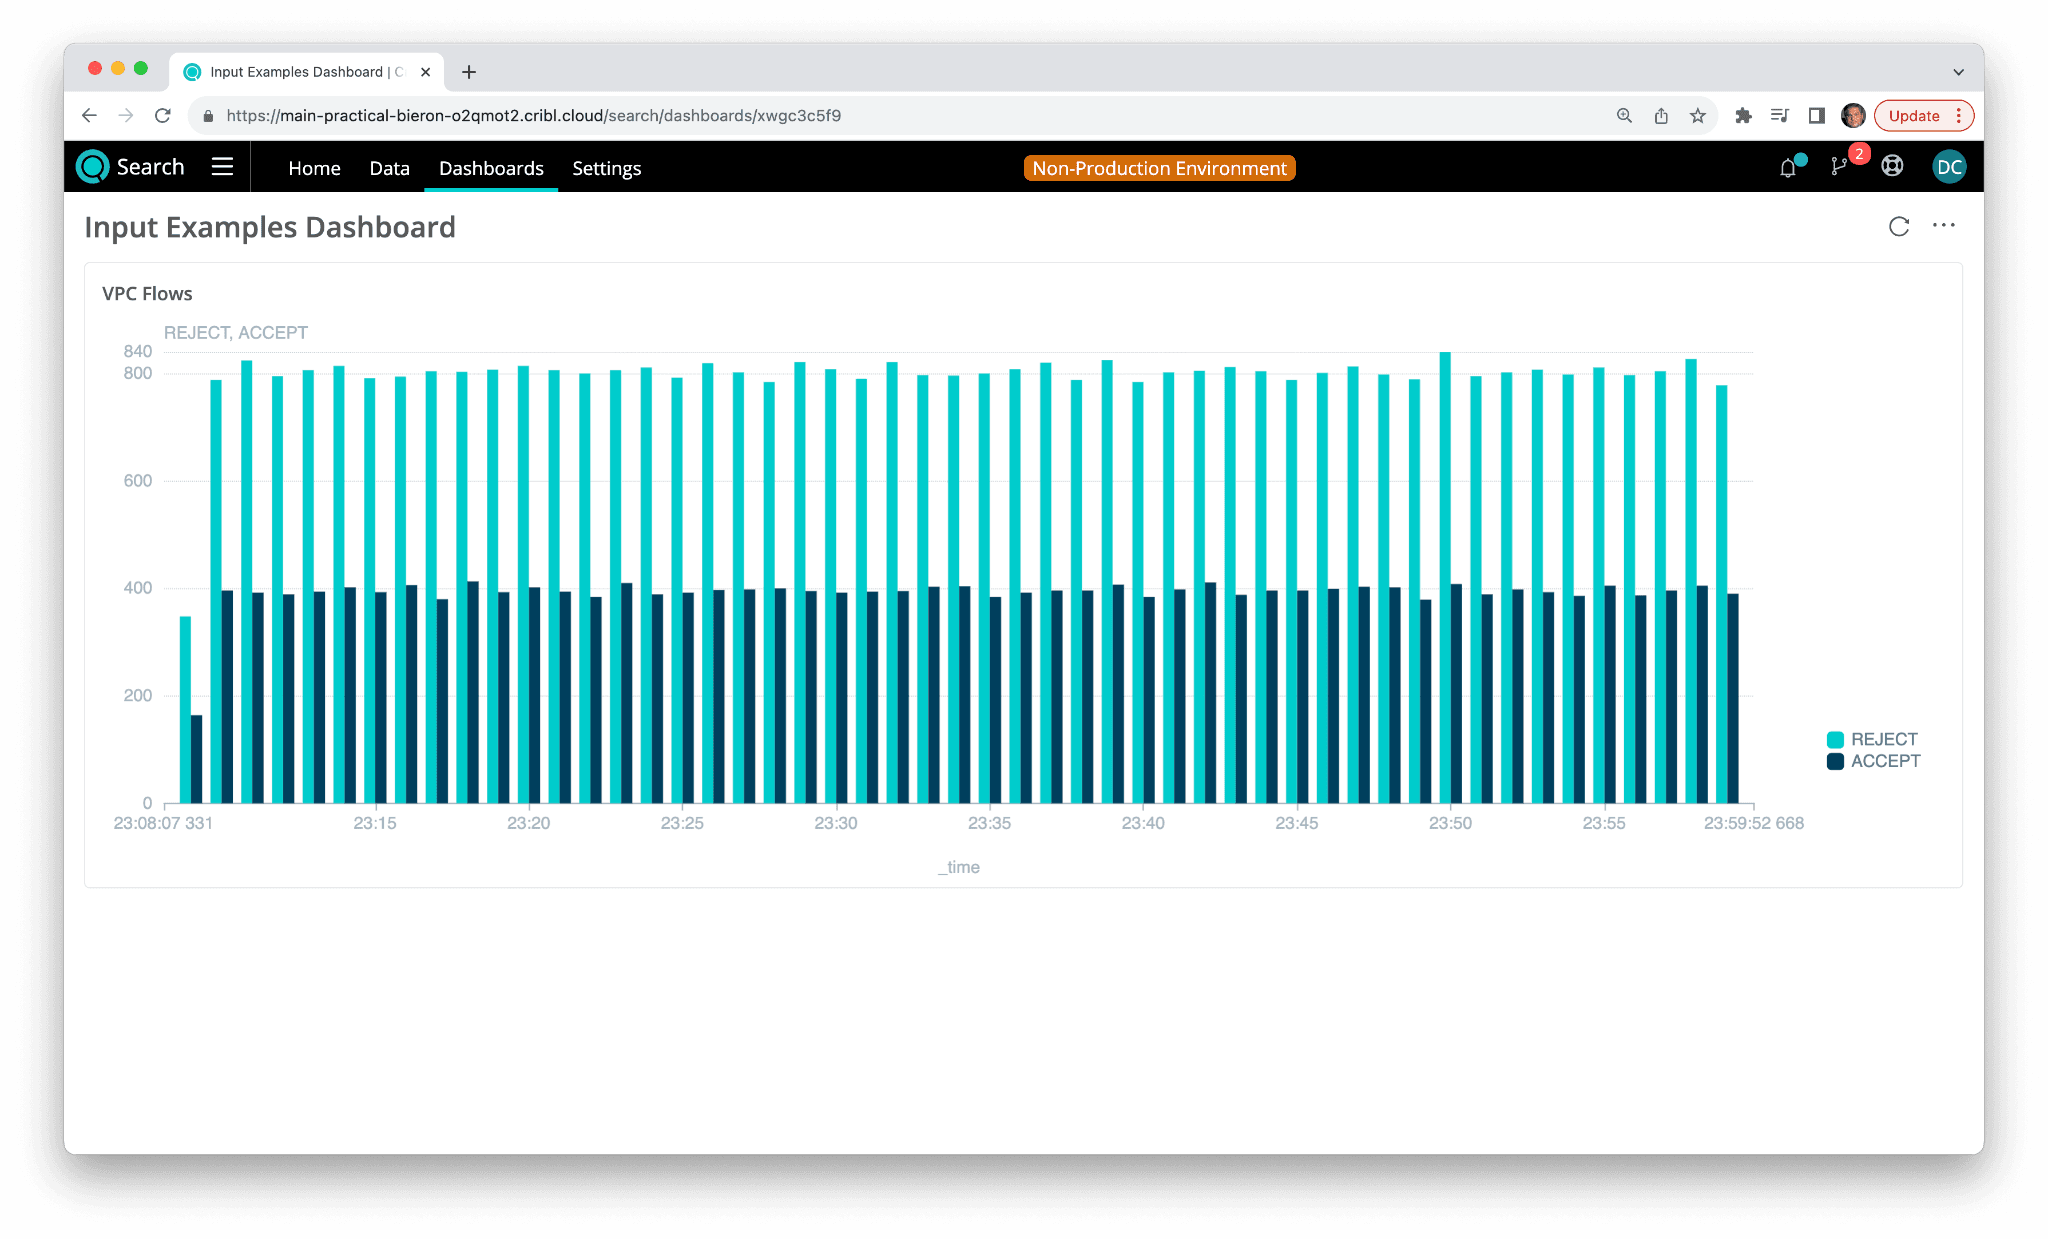
Now if we choose Actions -> Add to Dashboard, we can add this search to a new Dashboard. In the Panel Title text box, type: “VPC Flows”, select “Create New” and then in the “Dashboard Title” text box, type “Input Examples Dashboard”, then select “Add & Go to Dashboard”.
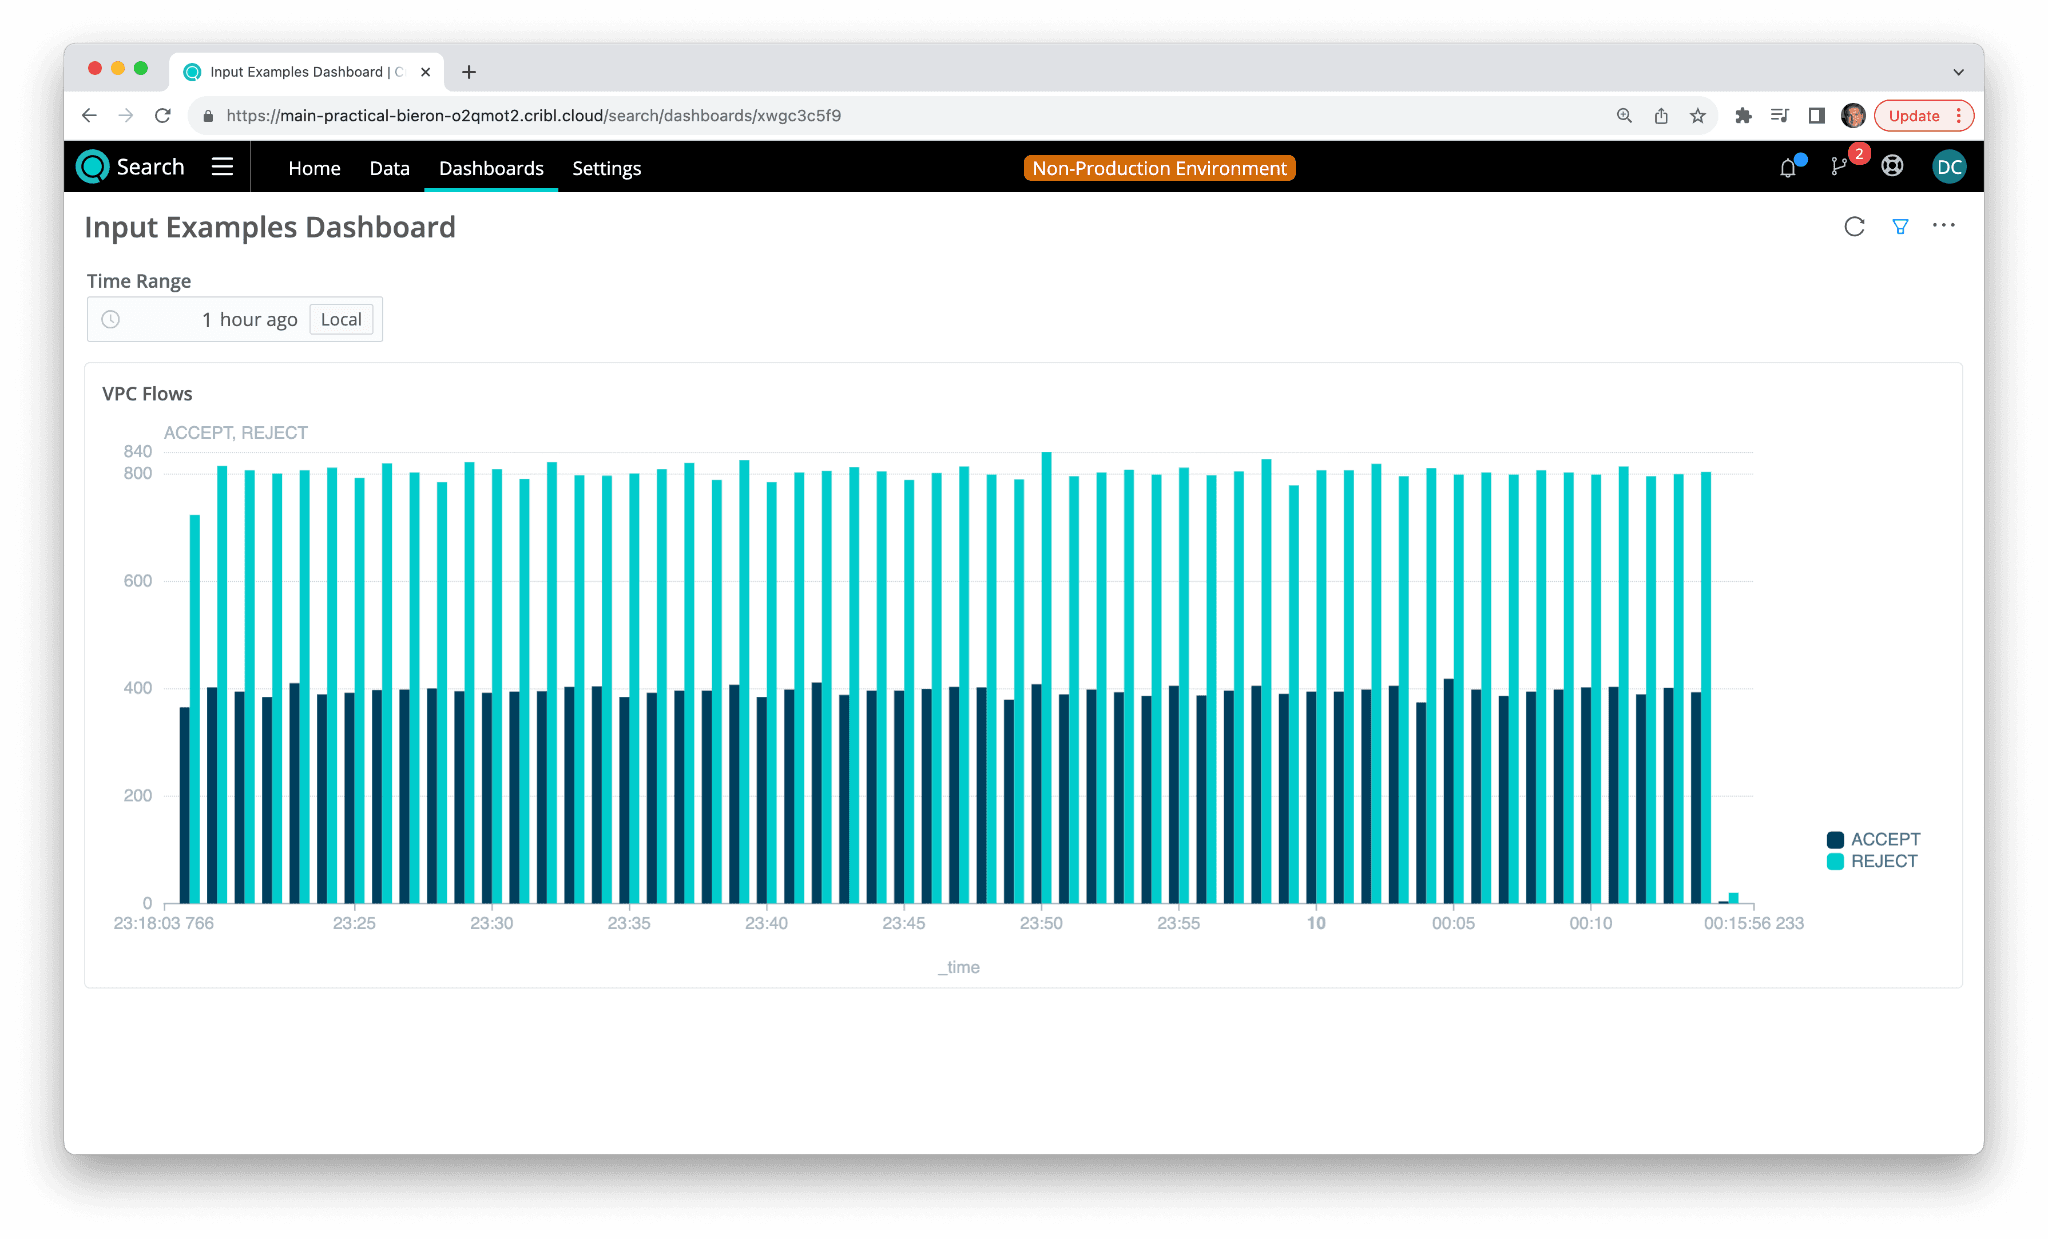
We should now see this dashboard:
Create Inputs
Next, we want to edit this dashboard and create some inputs to control the panel. First, let’s go into edit mode by clicking on the three dots menu on the upper right corner of the entire dashboard (not the one inside the search panel), Inside that menu, choose “Edit” and it will take you into the Dashboard Edit mode.
Now we can add Inputs to our dashboard.
Time Picker
The simplest input to add to your dashboard is a time picker. A time picker can be used to select a time range for one or many panels on a dashboard, including other inputs.
From the “Add” dropdown in the upper right, choose “Input”. You should see the Input Edit panel open on the right side of your dashboard. In the Title field, type “Time Range” , and in the Input ID field, type “time_range_1”. The Input ID must be unique for the entire dashboard, and conform to the normal rules of field naming in Search.
In the Type dropdown, choose “Time Range” and leave the Default Value set at 1 hour. Your time picker should appear in the upper left corner of your dashboard. Close the Input Edit panel by clicking on the X in the upper right corner; this should return you to the main Dashboard Edit panel.
Next, we have to link one or more searches to the time picker we just created. Since we have only one panel on our dashboard currently, let’s click on the Edit icon (a little pencil) in the upper right corner of the VPC Flows dashboard panel. This will bring us to the Dashboard Panel Edit panel on the right-hand side of your dashboard.
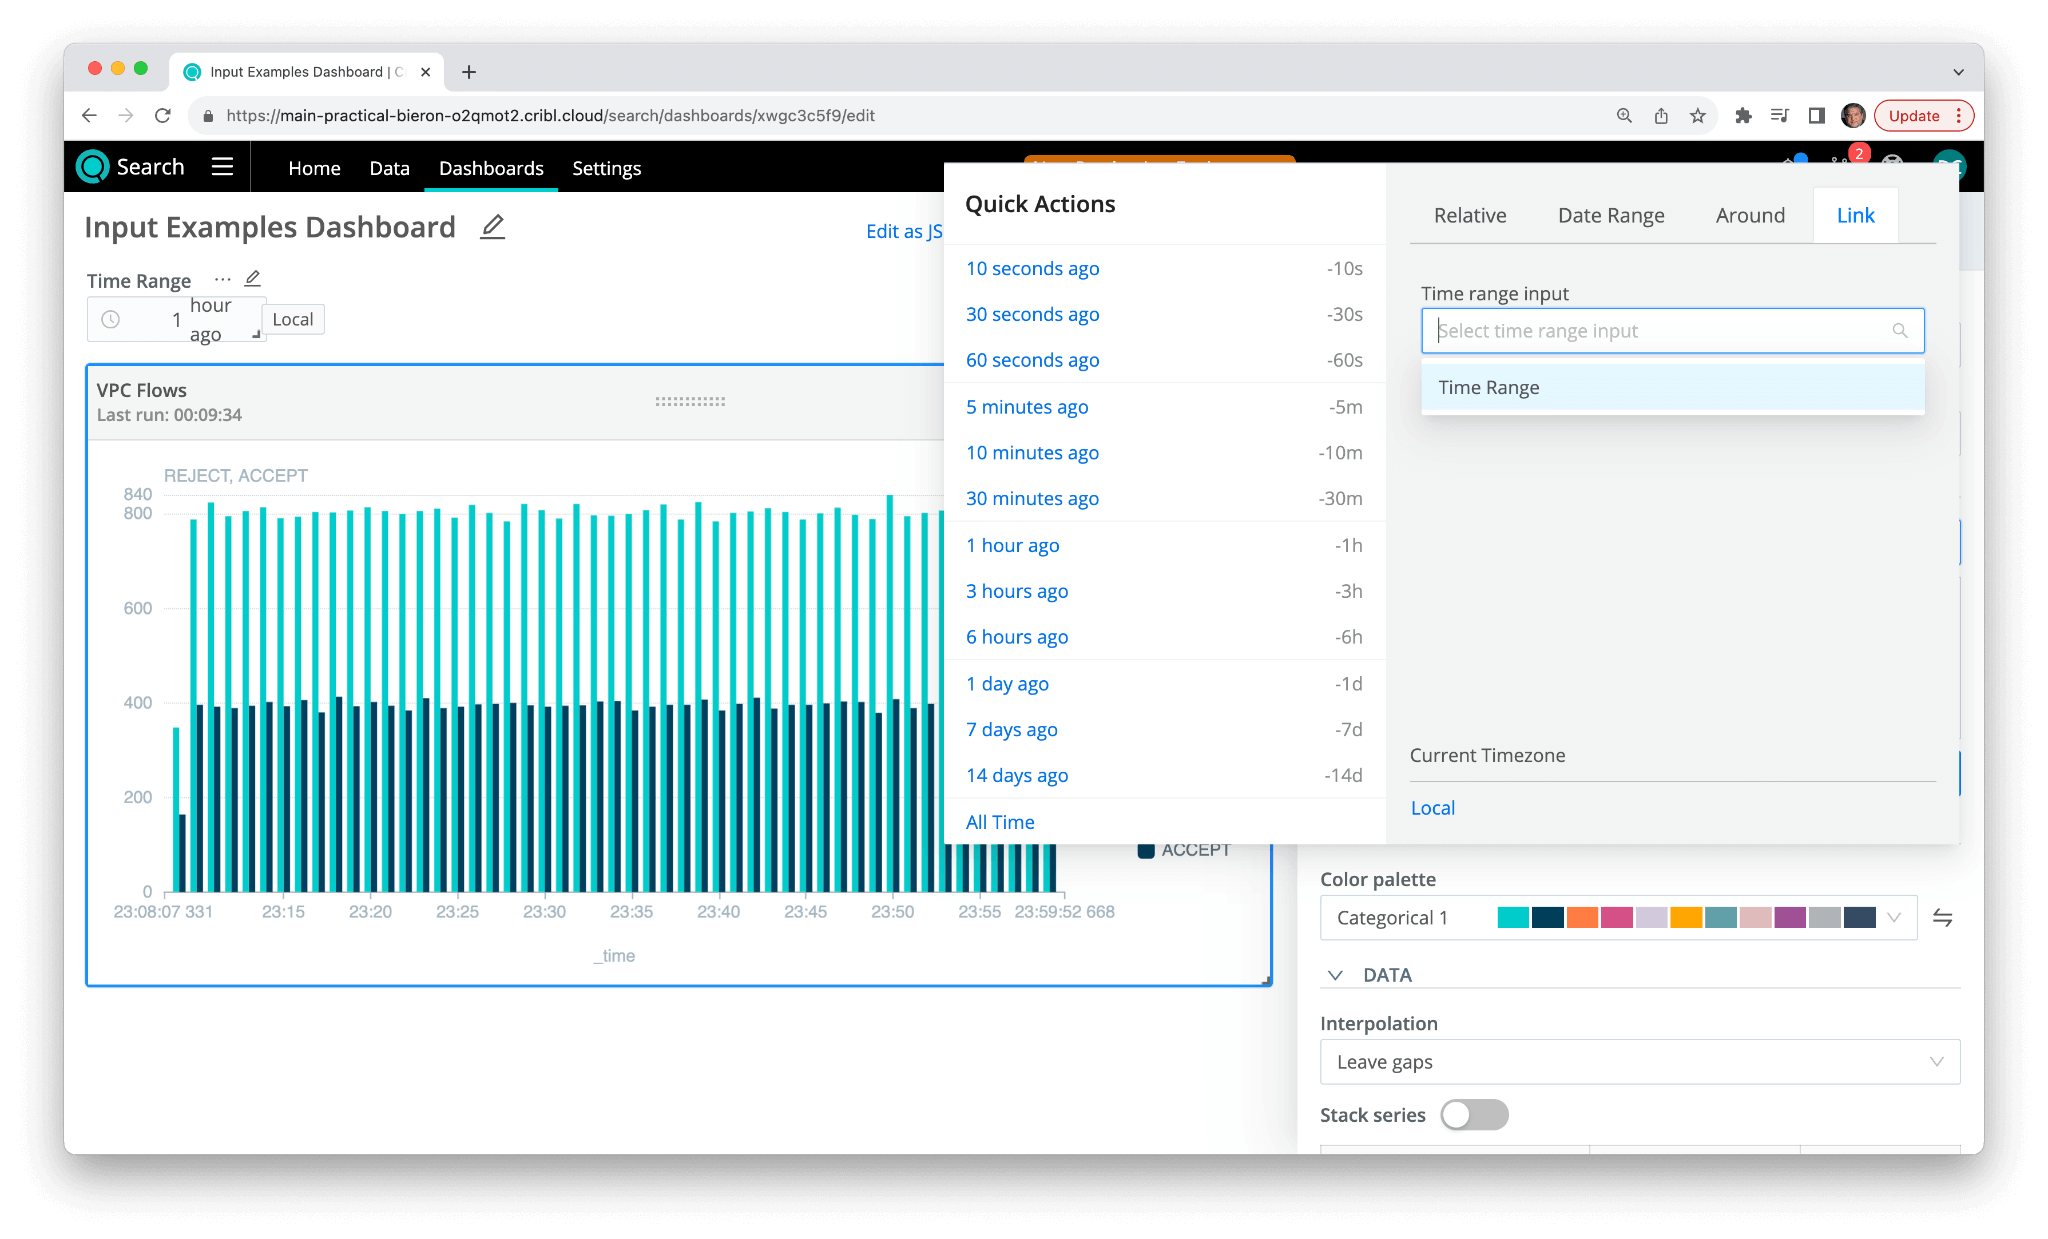
To link this Dashboard Panel search specifically to the Time Range picker we just created, click on the time picker in the Edit panel for this search. One of the tab options on the top should now read “Link”. Choose this option, then from the dropdown on this tab, choose “Time Range”, which refers to the input time picker we previously created. Click outside of the time range picker modal to dismiss it, then click on Save to save the entire dashboard. Click on the X to dismiss the Dashboard Panel Edit panel.
Now, you can click on Exit to exit the Dashboard Edit mode, and the dashboard should be live and operational. Changing the time range in the Time Range input you have created will re-execute the Search in the VPC Flows panel and update the values displayed for the newly chosen time range.
Note: You can show/hide inputs by clicking the filter funnel in the upper right corner of any dashboard with one or more inputs. If you can’t see the inputs, try selecting the filter.
This time range input can be simultaneously applied to several panels and inputs on the same dashboard, ensuring that all data on one dashboard is synchronized.
Text and Number Inputs
The next inputs we’re looking at are the text and number inputs. Both inputs are simple text areas that the user can type into. The main difference between them is that number inputs have validation to ensure the text entered is numeric, and there are optional maximum and minimum value input validations as well.
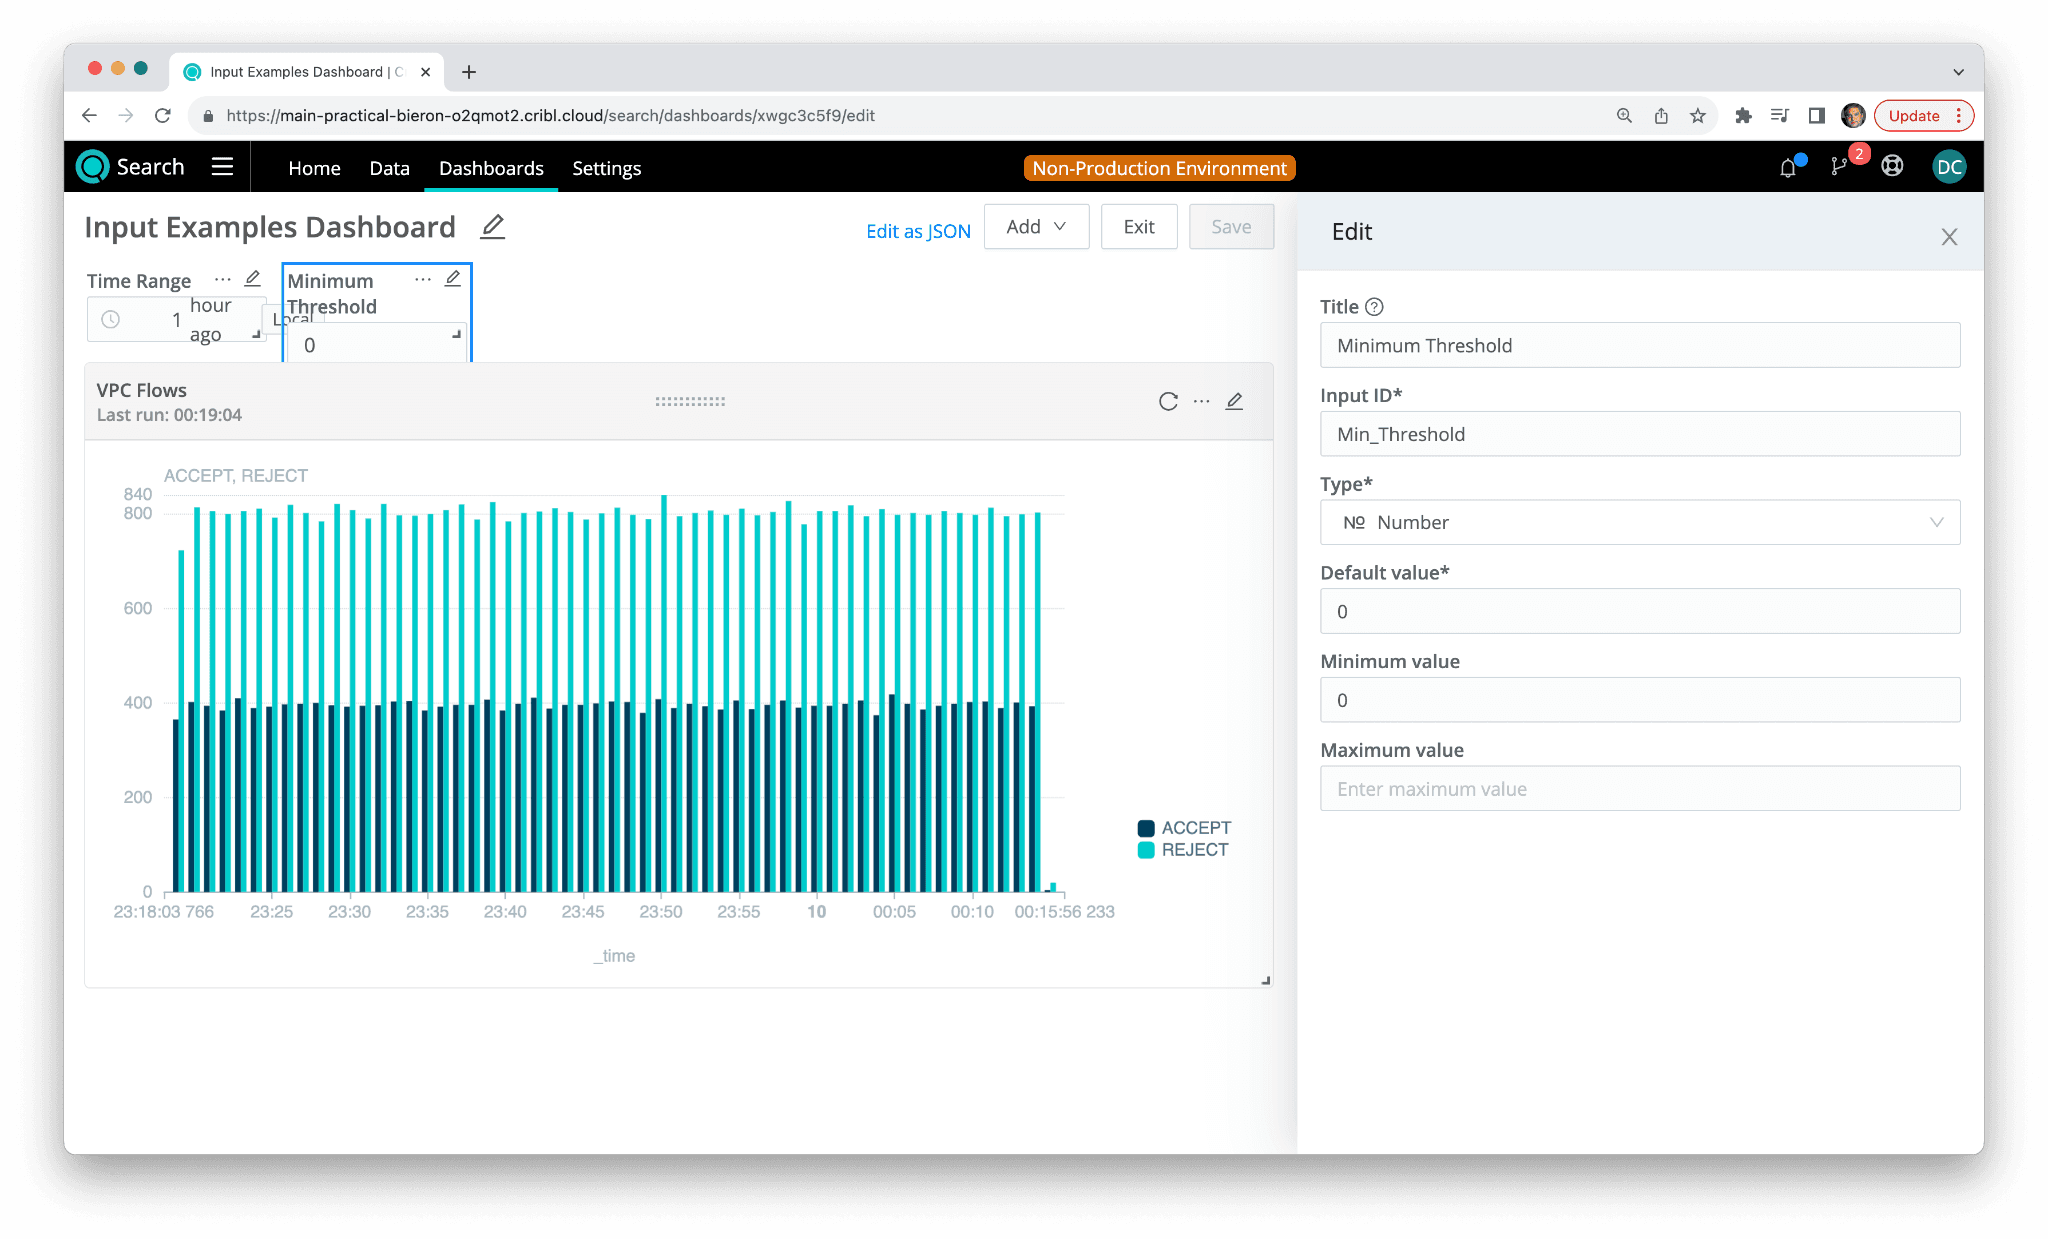
Let’s create an input that filters our VPC Flows chart for a minimum value of flows. From the “Add” dropdown in the upper right, choose “Input”. In the Title field, type “Minimum Threshold” , and in the Input ID field, type “Min_Threshold”. In the Type dropdown, choose “Number”.
Set the default value to 0, and set the Minimum Value to 0 as well (since there can’t be negative values for a counter). Leave the Maximum Value field blank since there’s no maximum value we want to provide as a limit.
Now we need to modify the search to use the input ID token inside the search itself. Tokens begin with a dollar sign ($) and will be substituted with the value supplied in the Input by the user at search time.
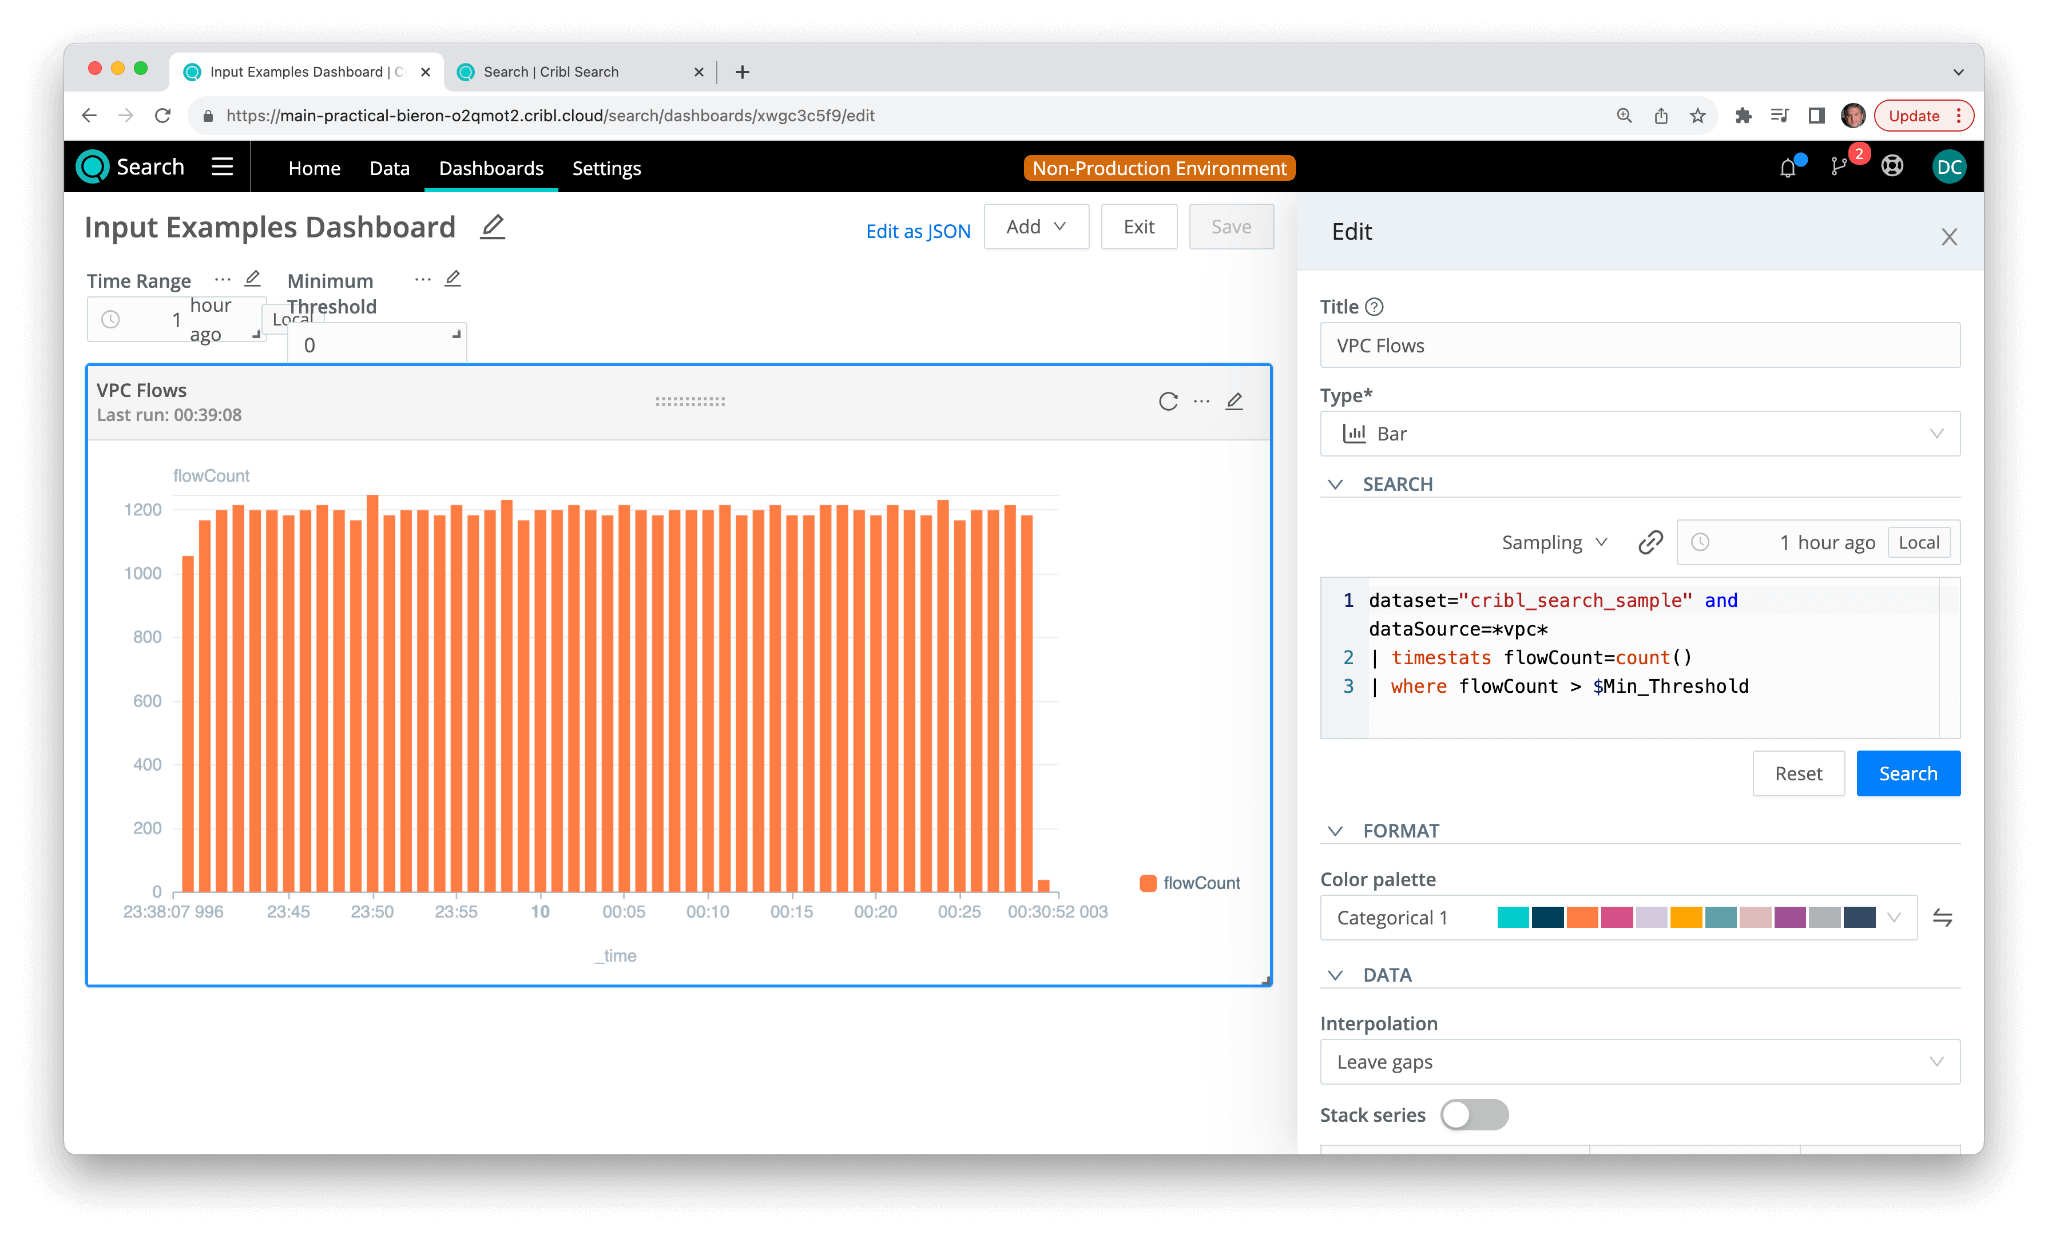
Click on the Edit icon in the upper-right corner of the VPC Flow Logs search panel. Then in the Search text, let’s modify the search to include the $Min_Threshold token as a filter.
dataset="cribl_search_sample" and dataSource=*vpc*
| timestats flowCount=count()
| where flowCount > $Min_Threshold
(Note that we removed the split-by-action clause to make the comparison simpler.)
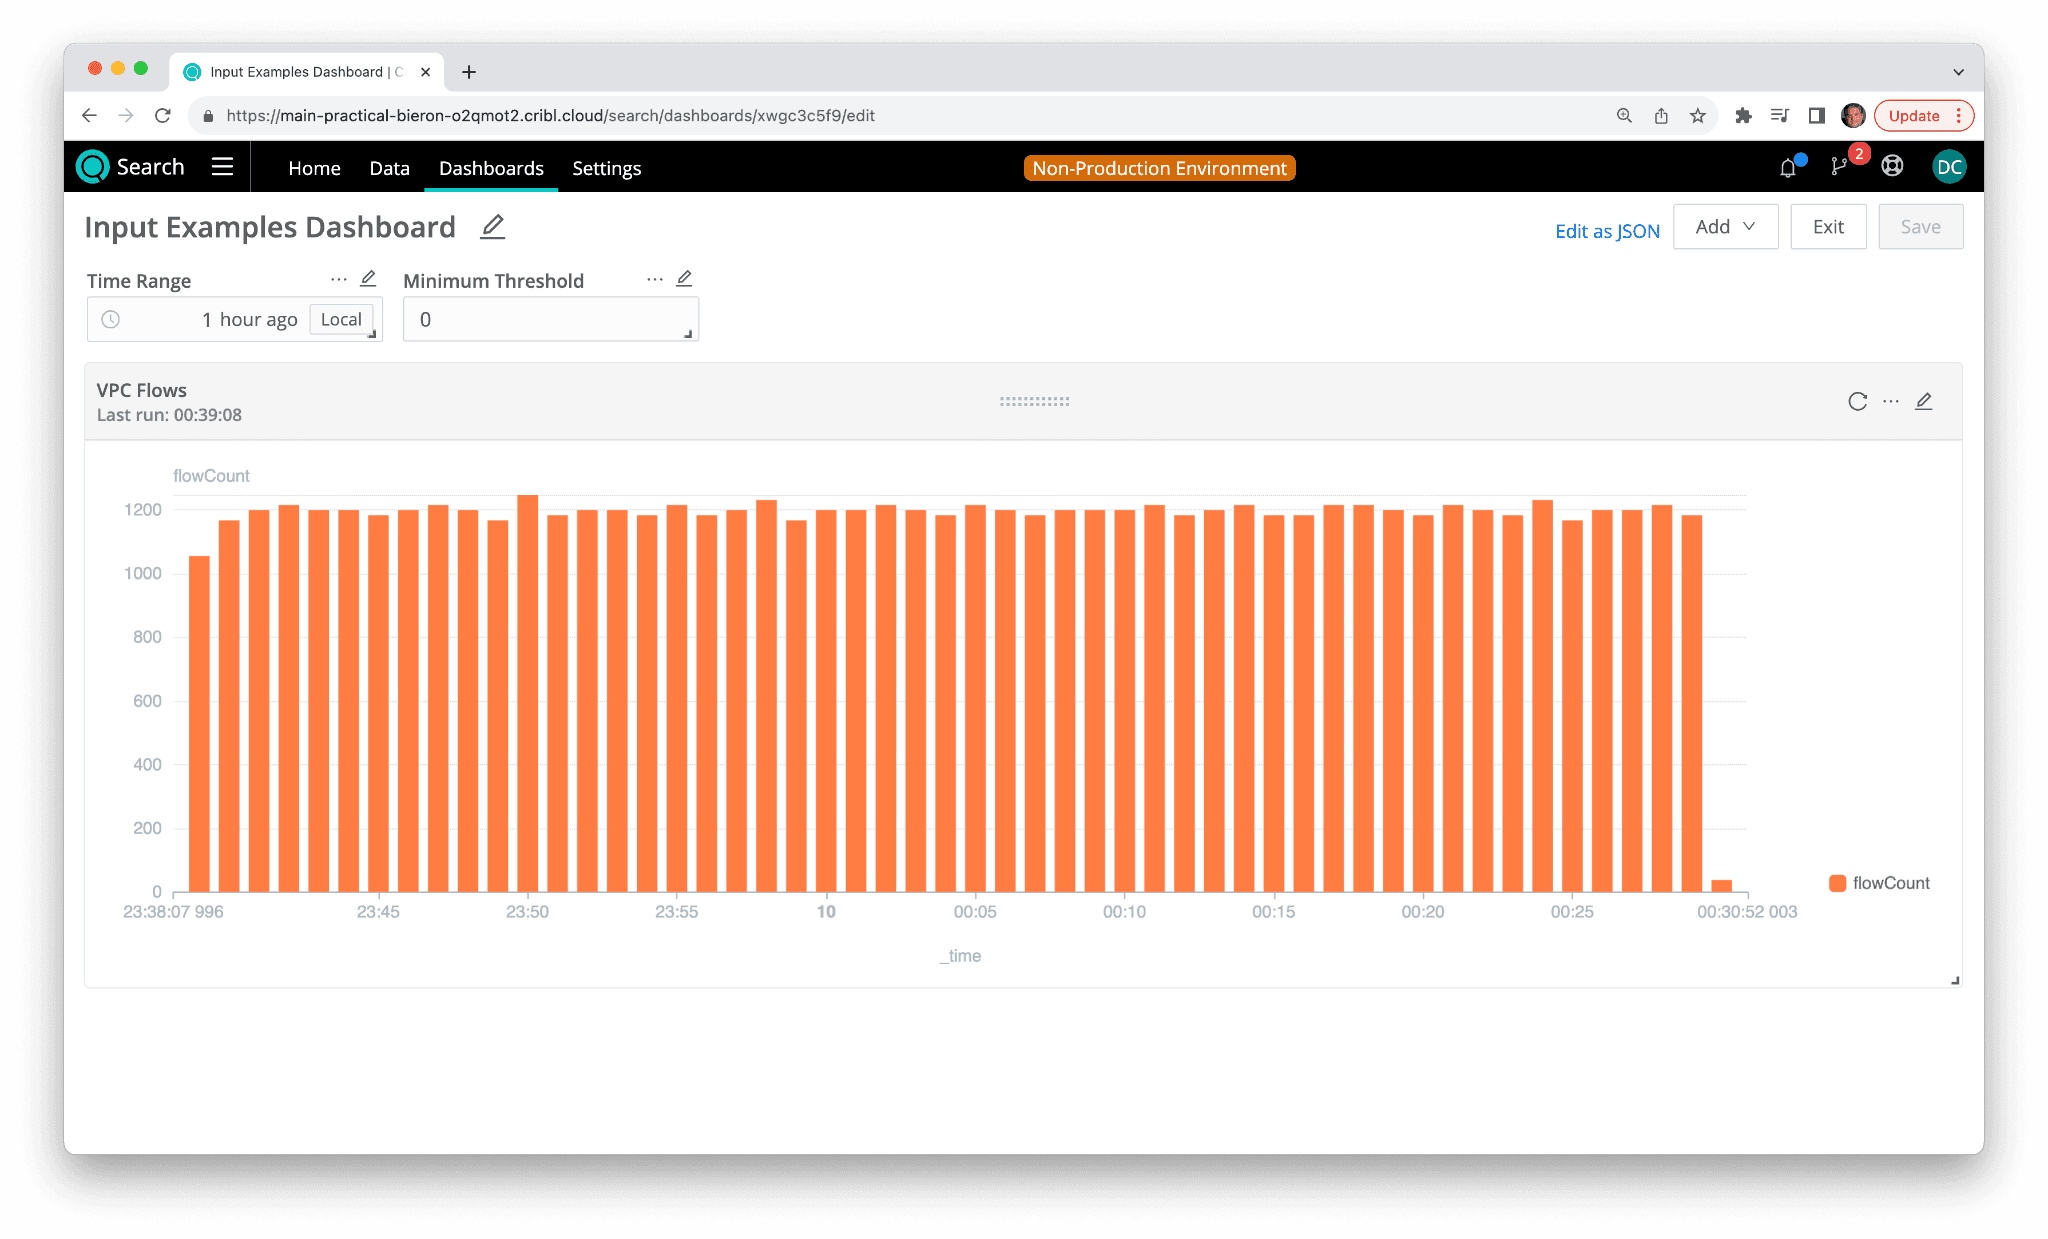
If you close the edit window, then save the dashboard, and click Exit, to exit edit mode, you should be able to see the dashboard in action. When you set the value for the Minimum Threshold to something larger than zero, the VPC Flow Logs panel will re-execute the search with the supplied filter value, and the visualization will reflect the new threshold.
We can also create a filter for the IP addresses in the VPC Flow Logs as well. Follow the same steps in the process but create a Text field called “Destination Address Filter” with an ID of “dstaddr_filter”. Set the default value to “0.0.0.0/0”.
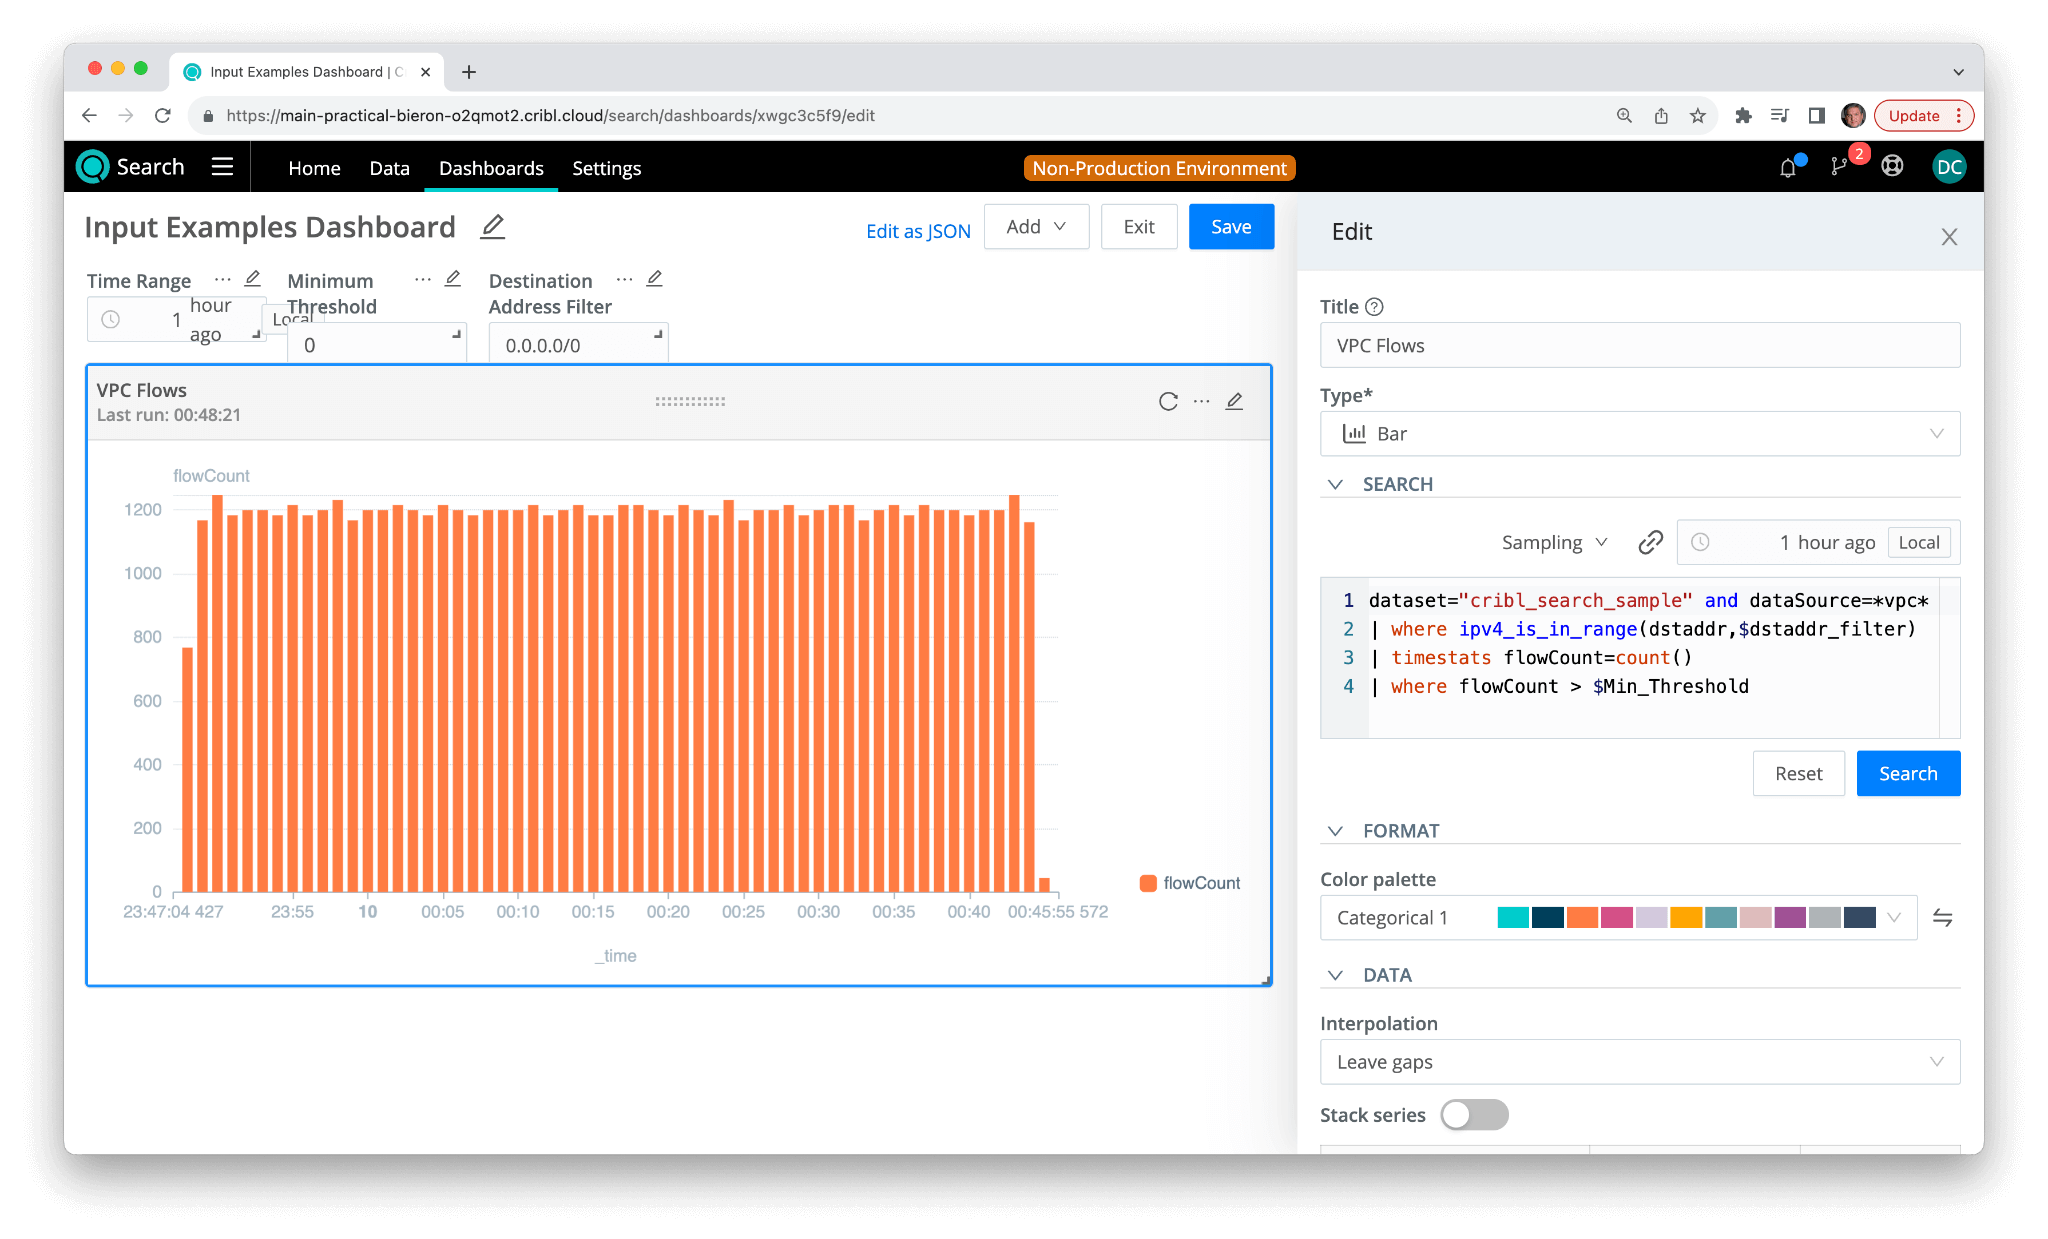
Next, we modify the search to use a built-in IP address function filter with the new token $dstaddr_filter.
dataset="cribl_search_sample" and dataSource=*vpc*
| where ipv4_is_in_range(dstaddr,$dstaddr_filter)
| timestats flowCount=count()
| where flowCount > $Min_Threshold
Now if you edit the Destination Address Filter to something like 10.0.0.0/8, you’ll see only the VPC Flow Logs that where the destination address in each Flow starts with 10.x.x.x.
To make it easier to choose Destination Addresses, we can optionally create a separate panel that has the top-N values of the Destination Addresses in VPC Flows. Go back into Edit mode for the dashboard, and add another Panel. Add this search:
dataset="cribl_search_sample" dataSource="vpcflowlogs"
| summarize theCount=count() by dstaddr, action
| top 10 by theCount
| render table
and set the Type to ‘Events”. This will supply a formatted table of events. Remember to link the Time Picker in this new panel back to the main Timepicker input we created above, so this panel will reflect the actual top-10 addresses in the time range we’re looking at.
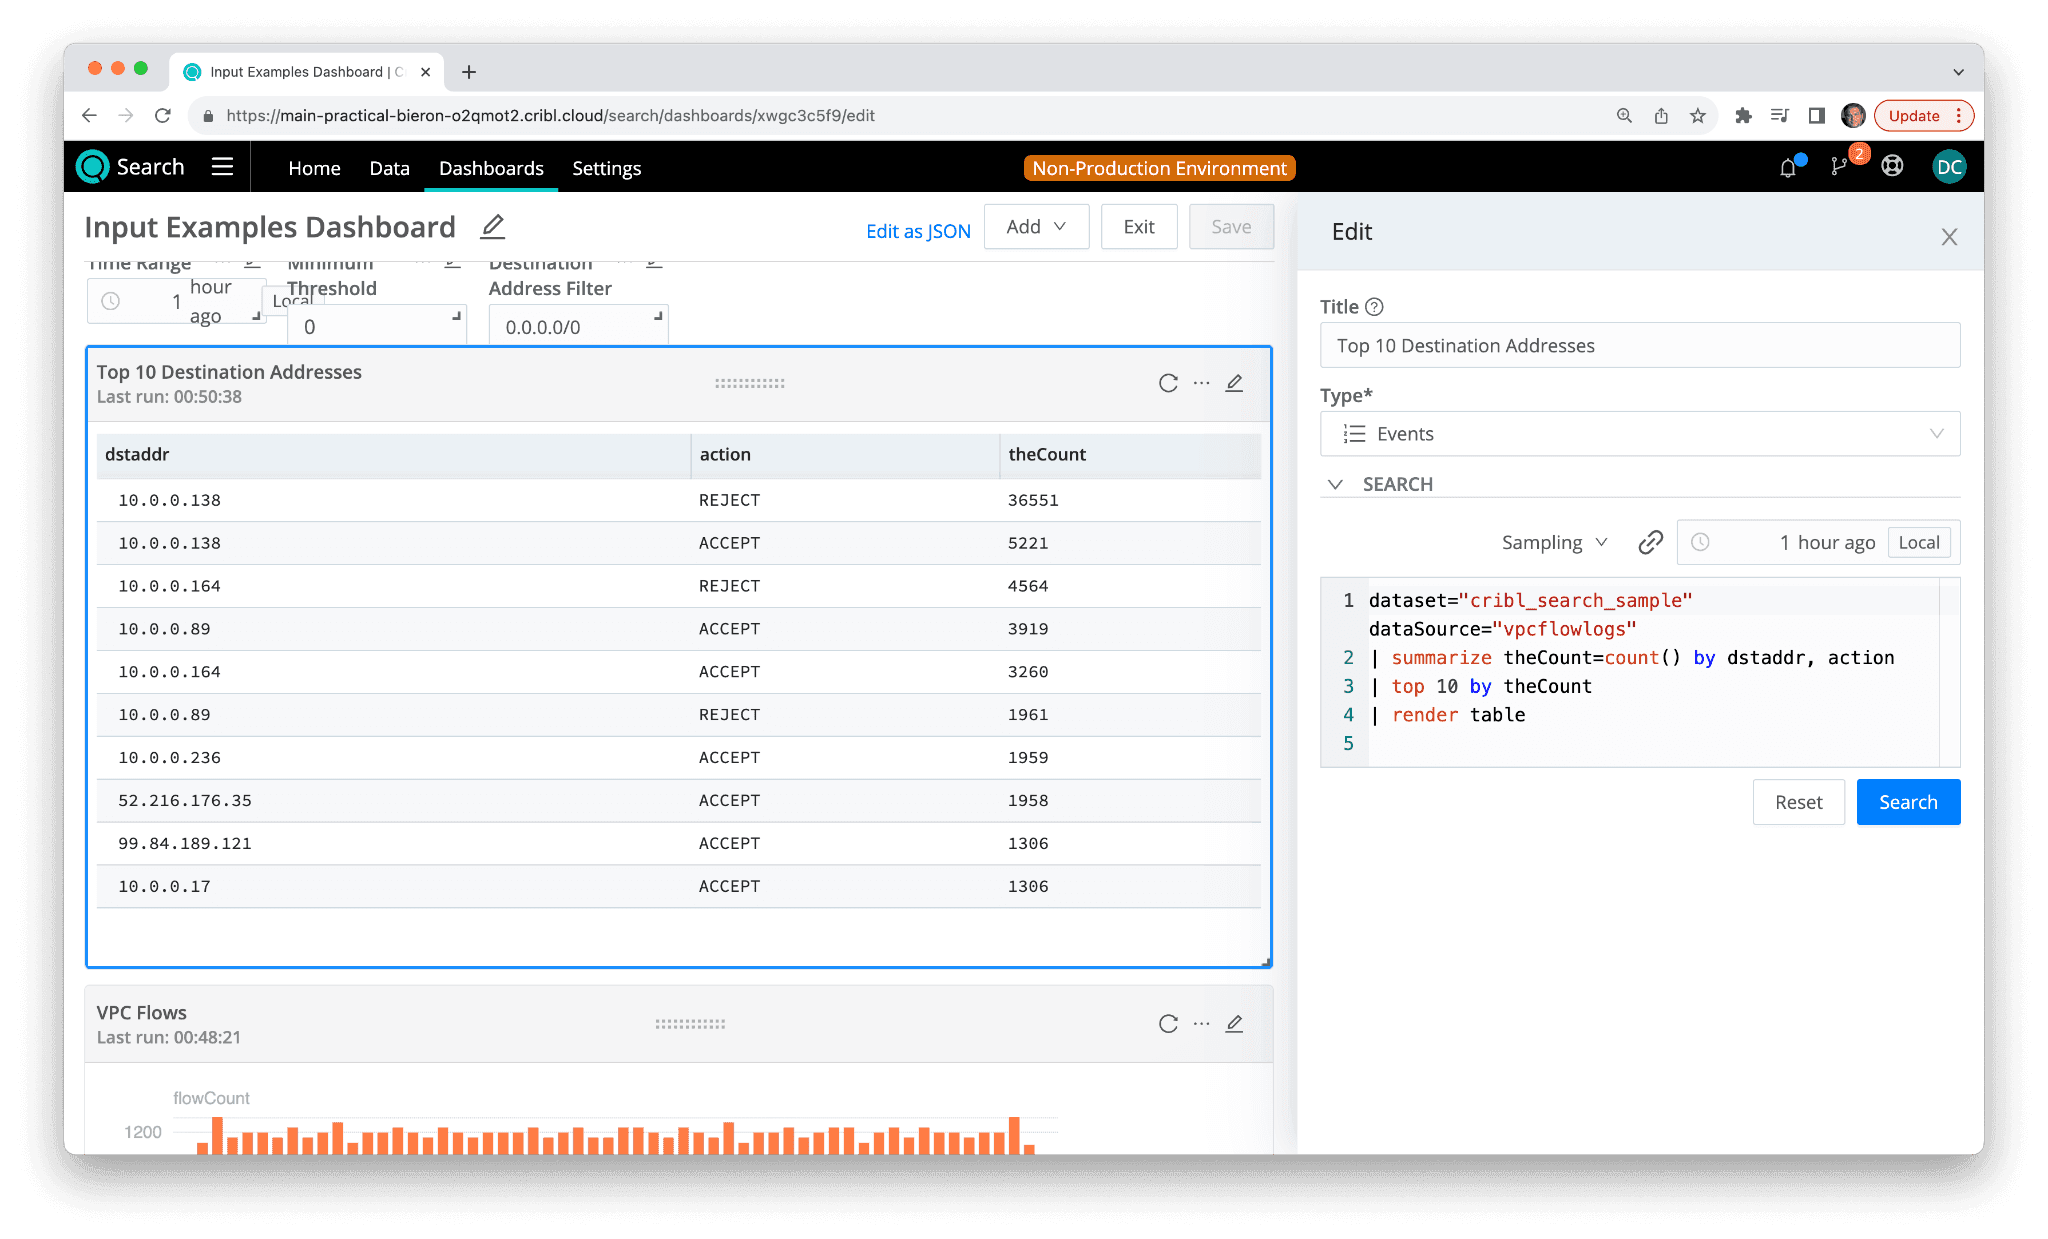
Now the user has some guidance as to how to populate the Destination Address filter. They can enter single IP addresses, or they can enter a range in CIDR notation (eg. 10.0.0.138/24)
Dropdown Input
The last input we’re going to create is a dropdown. A dropdown is more complex than the other three inputs we already created in that it has a set of possible values that must be populated.
The simplest option for dropdown values is to simply prepopulate a list of values. However, more commonly, the user would want to populate the values for the dropdown from a list of values in their data. The Dropdown input also allows the user to specify a Search and populate the values in the dropdown from those search results.
Let’s add a Dropdown to help us filter our VPC Flow Logs by their action, instead of splitting out each series.
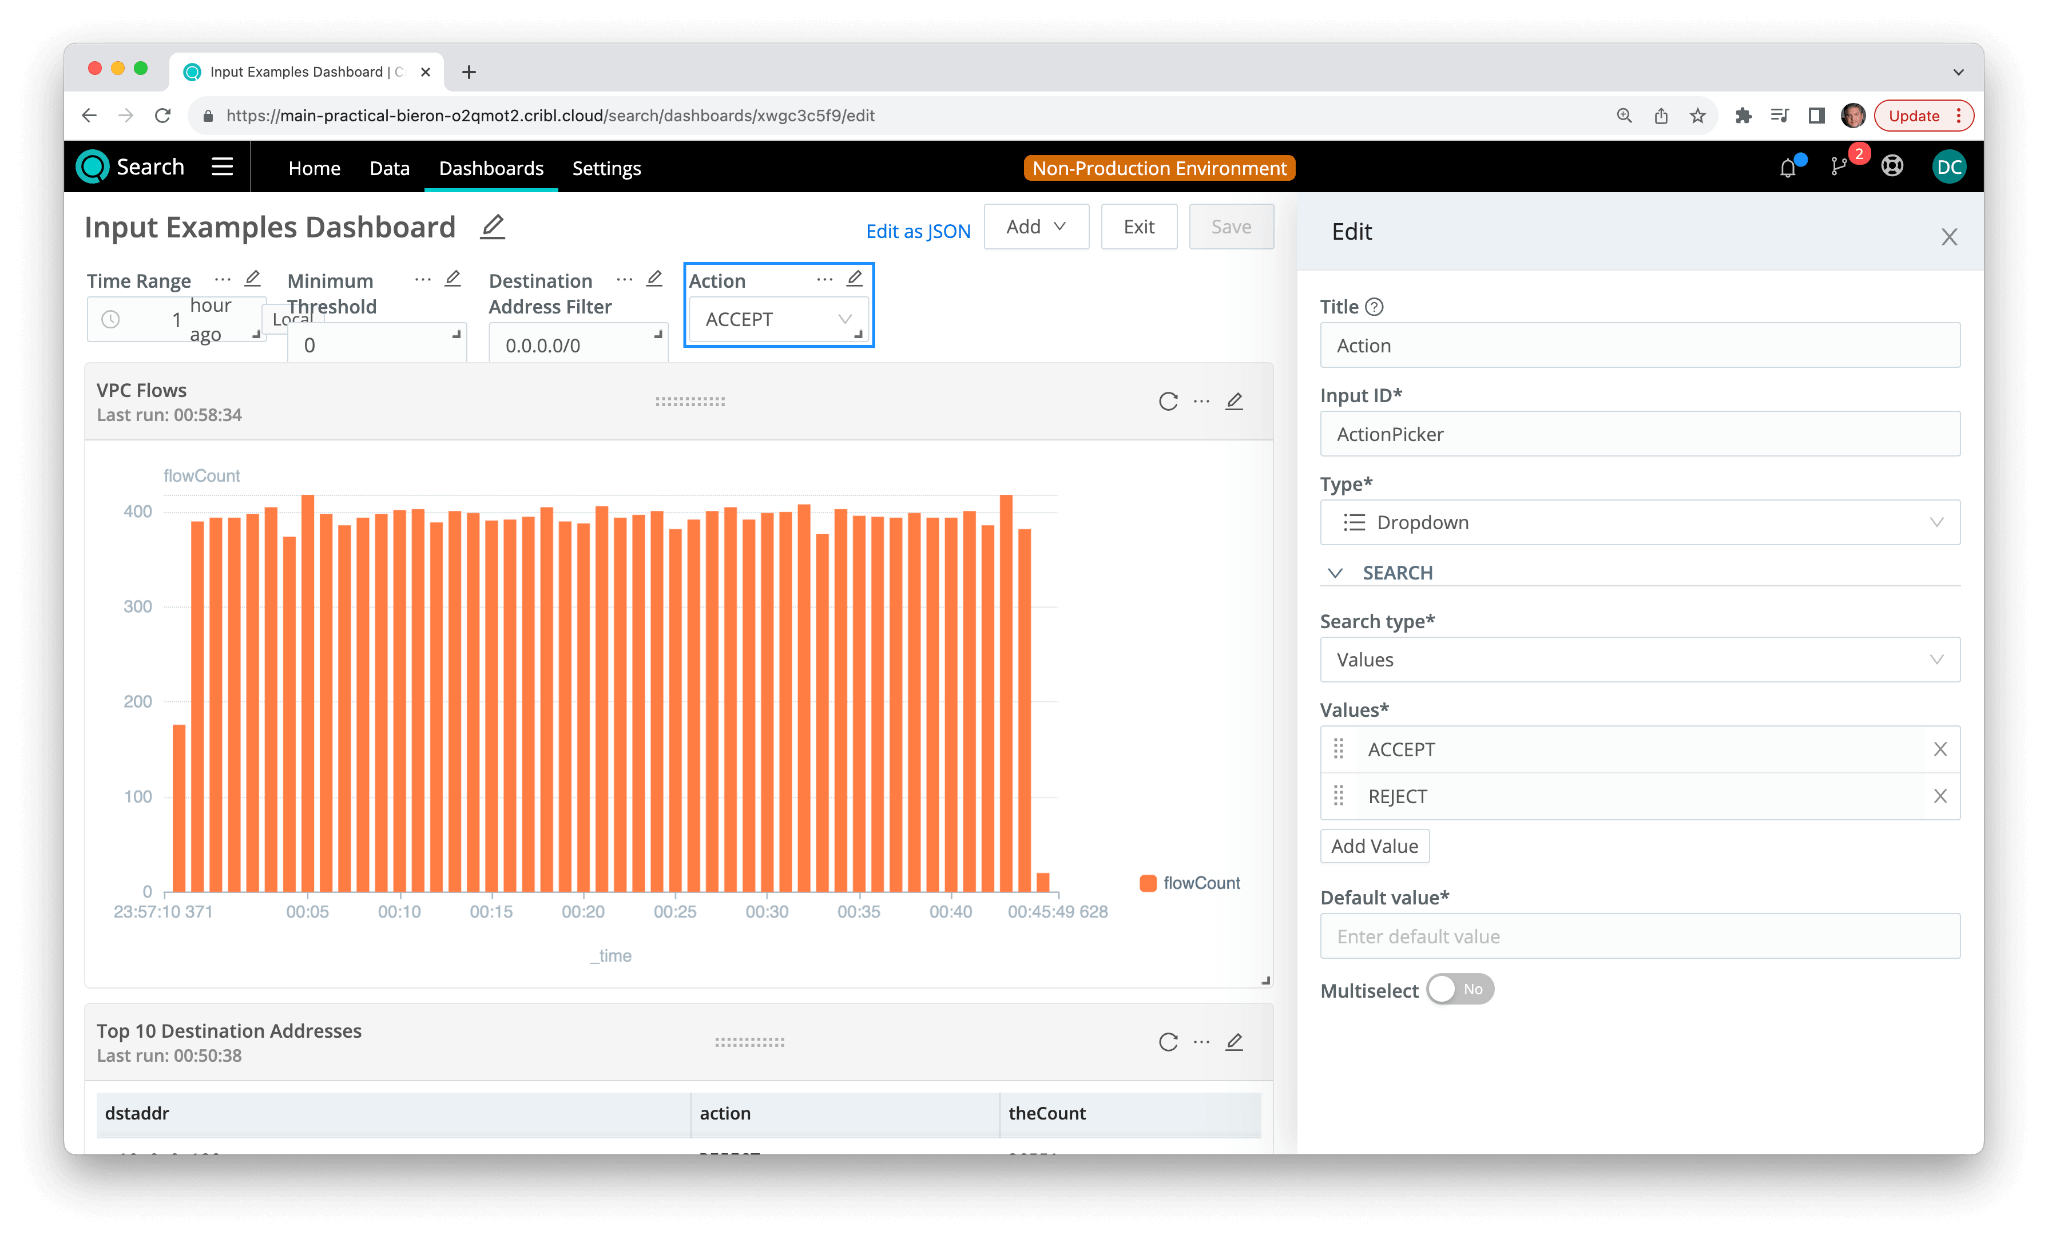
Now, from the “Add” dropdown in the upper right, choose “Input”. In the Title field, type “Action” and in the Input ID field, type “ActionPicker”.
In the Type dropdown, choose “Dropdown”. From our previous experience we VPC Flows, we know that the two possible values for Action are “ACCEPT” and “REJECT”. So let’s choose “Search Type” and set it to “Values”. Then let’s type “ACCEPT” in the first value row, click on “Add Value” and then type “REJECT” in the second value row. (Note that capitalization is important as that’s how it appears in the data.)
Close the Input Edit panel by clicking on the X in the upper right corner; this should return you to the main Dashboard Edit panel. Now we should have a dropdown with the two values “ACCEPT” and “REJECT”. We can leave the Default Value empty, and also enable the slider for “Multiselect”.
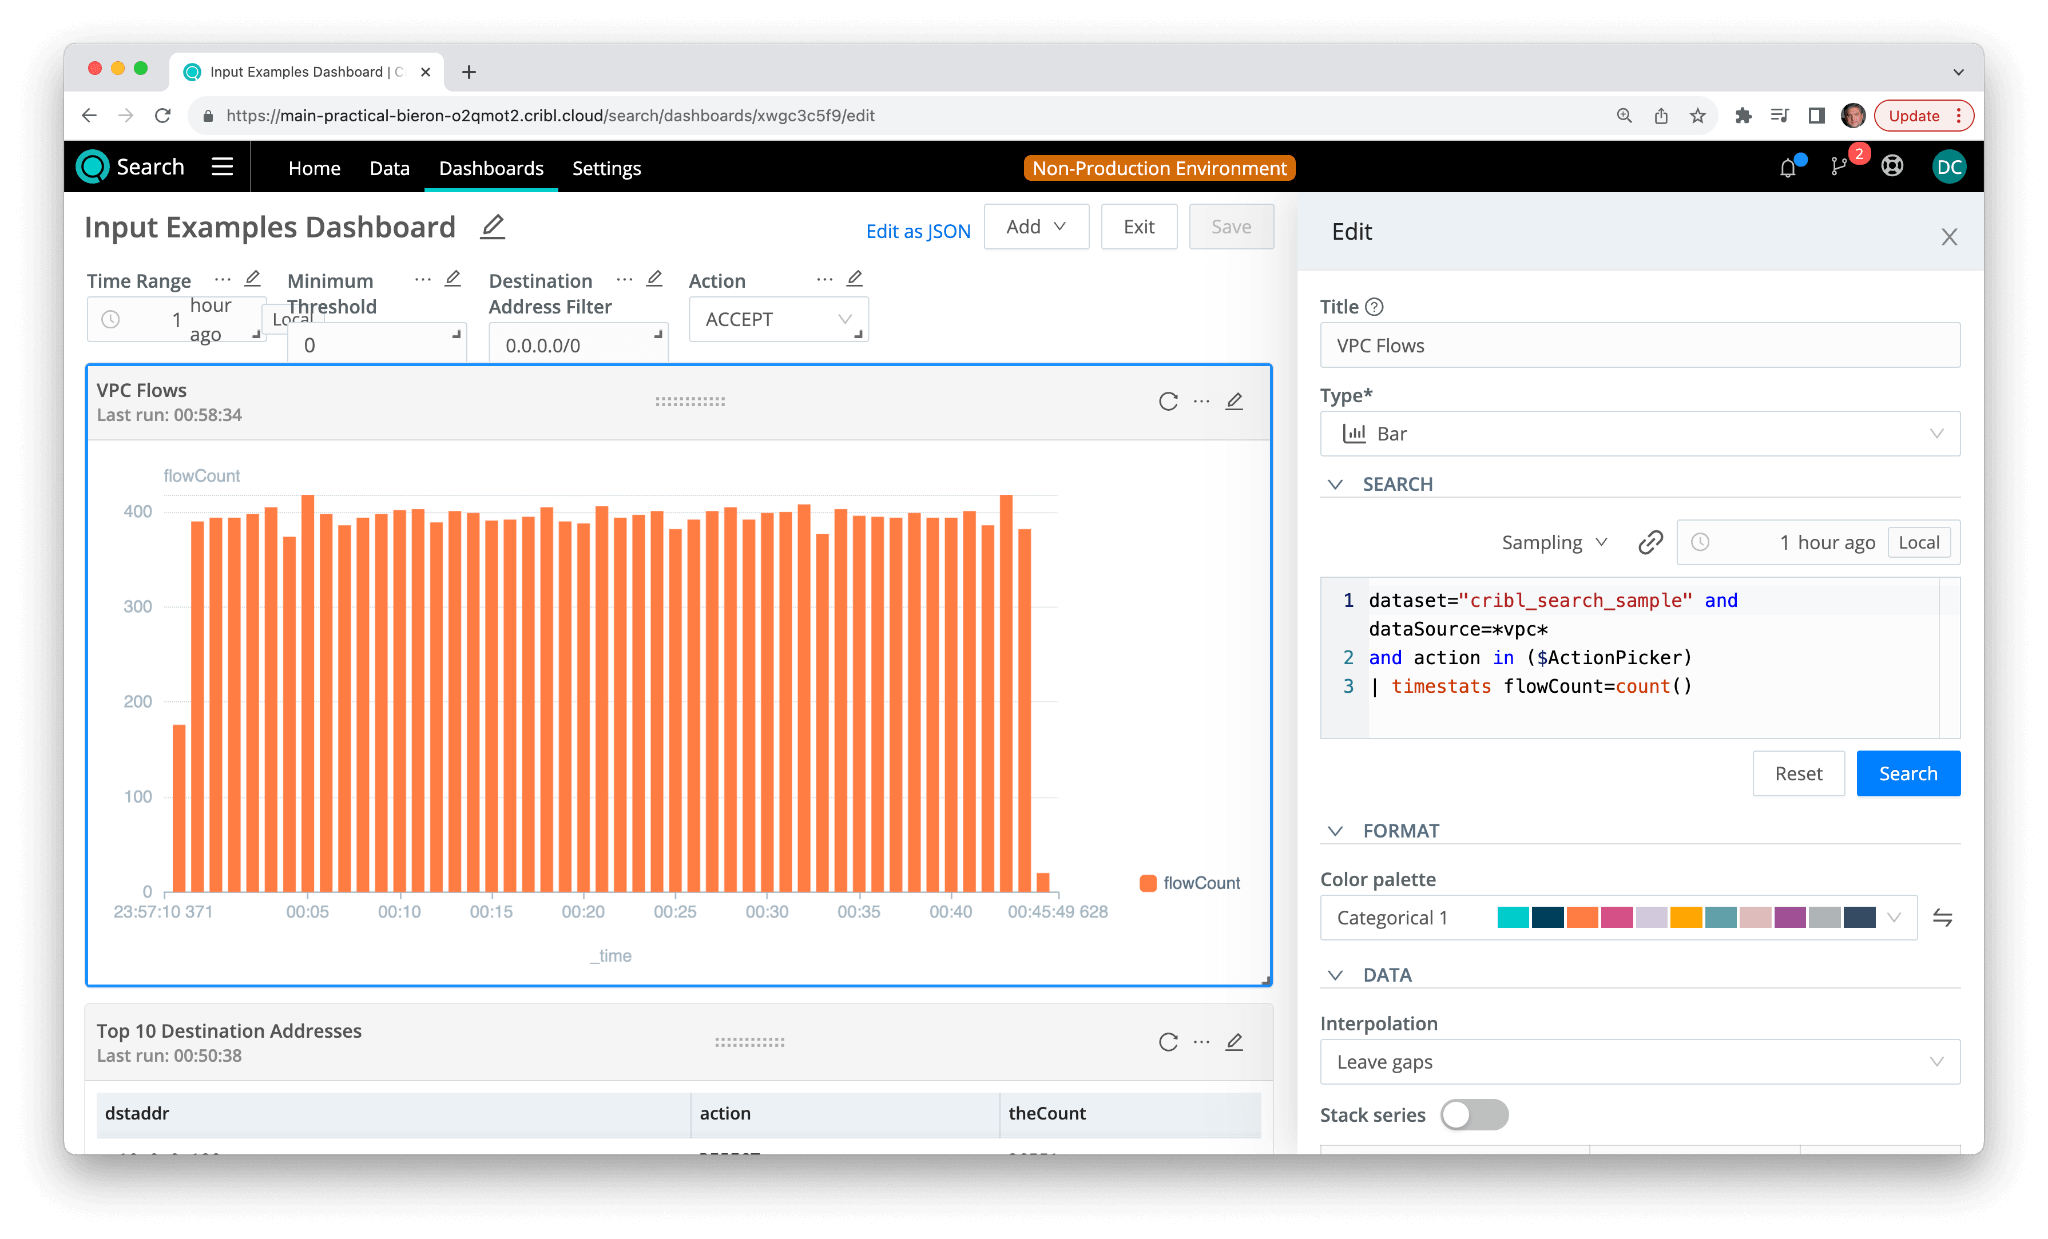
Let’s now modify the search to use the newly-created input $ActionPicker.
dataset="cribl_search_sample" and dataSource=*vpc*
and action in ($ActionPicker)
| timestats flowCount=count()
(Note we’re temporarily removing the text and number field tokens created in the previous section for simplicity. )
Also note that the syntax of the “in” operator requires that the token $ActionPicker be placed in parentheses.
After saving the dashboard and exiting edit mode, now we observe that the VPC Flow Log panel remains blank. The dashboard is awaiting input from the Dropdown so the token can have a value.
Choose “ACCEPT” or “REJECT” from the “Action” dropdown, and the search should immediately execute.
While this is a perfectly acceptable way to create dropdowns, it relies on us knowing the possible values to populate it ahead of time. There’s another way to populate dropdowns – as the result set from a search.
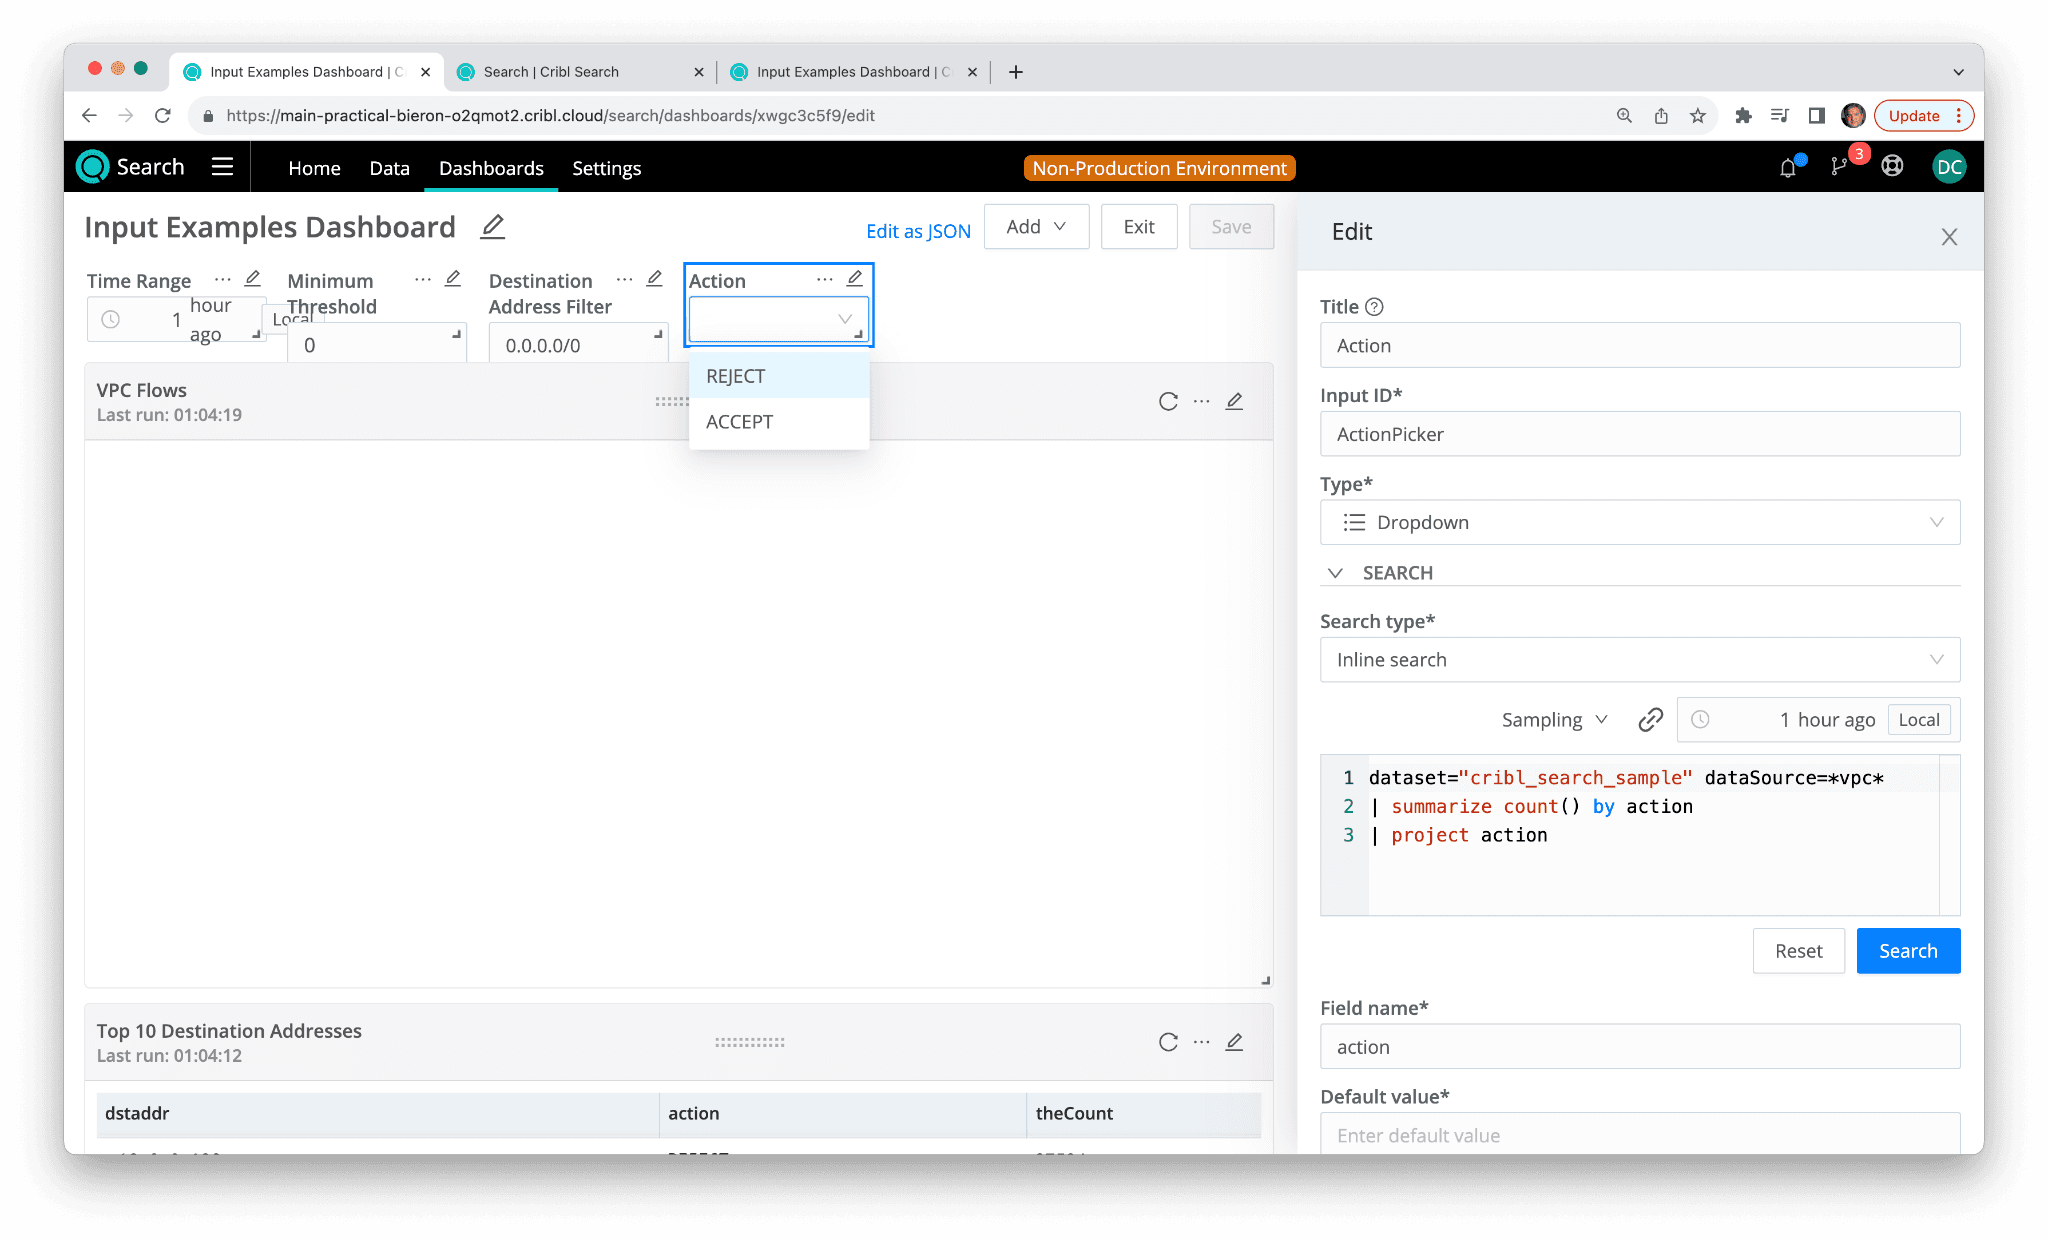
Go back into the dropdown and change the value of the Search Type from “Values” to “Inline Search”. In the Search text box, paste the following search:
dataset="cribl_search_sample" dataSource=*vpc*
| summarize count() by action
| project action
Also, in the timepicker, click on the picker then link, and then link it to the master Timepicker as we did above.
Finally, we need to specify the linked field, so in the Field Name field, type “action”, to connect it to the projected field in our search.
Now, after saving the dashboard and closing the Edit panel, the dropdown should automatically populate with all of the possible values of the Action field.
The Action field can now be used to control the VPC Flow Logs panel in the same way as before – but now the possible values of the Action field do not have to be manually populated.
Conclusion
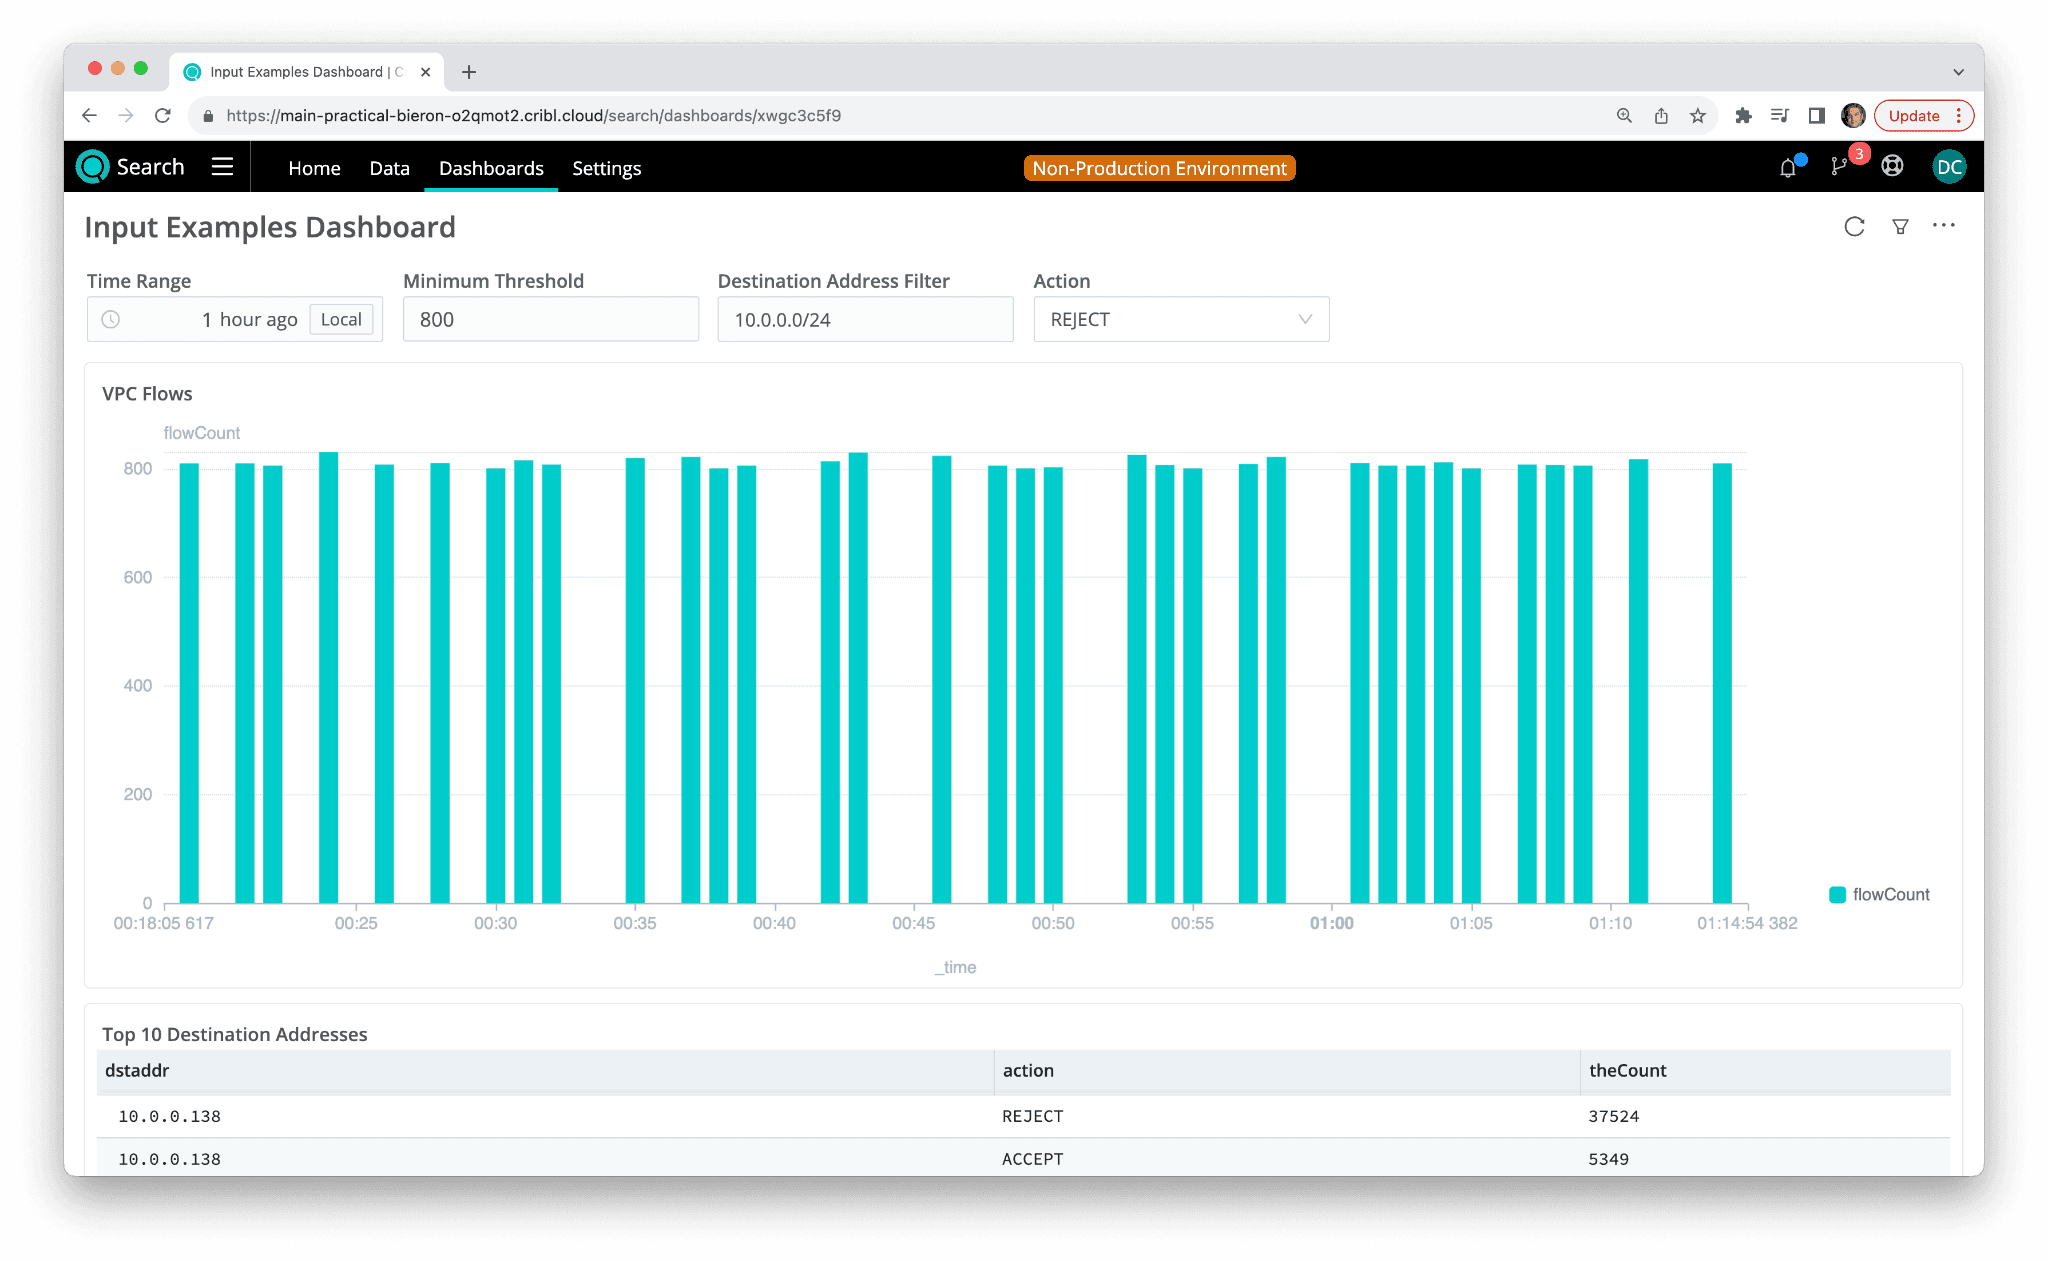
To wrap up, we can put all of the fields together into the main search:
dataset="cribl_search_sample" and dataSource=*vpc*
and action in ($ActionPicker)
| where ipv4_is_in_range(dstaddr,$dstaddr_filter)
| timestats flowCount=count()
| where flowCount > $Min_Threshold
This allows all four fields to power the main VPC Flow Logs panel. The Top 10 Destination Addresses panel is also controlled by the master timepicker.
In this blog, we covered the four types of inputs currently available in the Cribl Search dashboards:
Time picker
Number
Text
Dropdown
We showed how to use the Input ID field in each input as a token inside any search on the Dashboard using the token format ($input_id). We also learned how to link time pickers in other panels and dropdowns to another time picker on the dashboard. In this way, you can create user-interactive dashboards so users don’t have to manually type in KQL searches. Each dashboard can then become the primary user interface element for a wide variety of users. We’re so confident that you’ll love Cribl Search that we’ll give you instant access to it in Cribl.Cloud! Join me in the Cribl Community Slack if you have any questions!