Kubernetes (K8s) is the backbone of modern cloud-native applications, dynamically orchestrating containerized workloads. But let’s be honest—things break. And when they do, log data is your best friend. Without proper log collection, you’re troubleshooting in the dark, hoping to guess what’s wrong through sheer luck. Kubernetes logs help with efficient debugging, monitoring application performance, identifying potential issues before they escalate, and ensuring security compliance by detecting anomalies and vulnerabilities.
Yet, collecting data in Kubernetes is easier said than done. That’s where the real struggle begins.
The Problem: Lack of Full Kubernetes Visibility
There are two main limitations with other tools for Kubernetes observability, making it difficult to gain a complete picture of the environment.
Issue 1: Observability Teams Don’t Have Access to Kubernetes
In most organizations, the Observability or Data Team is responsible for ensuring data gets collected and processed, but they often lack direct access to the Kubernetes environment. Instead, they pass installation commands (like Helm scripts) to the SRE or DevOps team, who deploy the collection agents. This means the Observability Team has no insight into how the cluster runs, what apps are active, or where logs originate. To make matters worse, Kubernetes log collection requires filtering specific Pods, yet the Data Team doesn’t even know which Pods exist, making configuration a nightmare.
Issue 2: The Log Parsing Nightmare
Kubernetes consolidates logs from multiple applications running on the same node into a single log stream. These logs often come in multiple formats, requiring different event breakers to parse them correctly. Without proper visibility, teams struggle to configure event breakers accurately, leading to misparsed logs and missing data.
The Solution: Kubernetes Explorer in Cribl Edge
You shouldn’t have to guess what’s inside your Kubernetes environment. That’s why we built Kubernetes Explorer—giving you real-time, interactive visibility into your cluster directly from Cribl Edge, now generally available starting in the 4.11 release.
How It Works
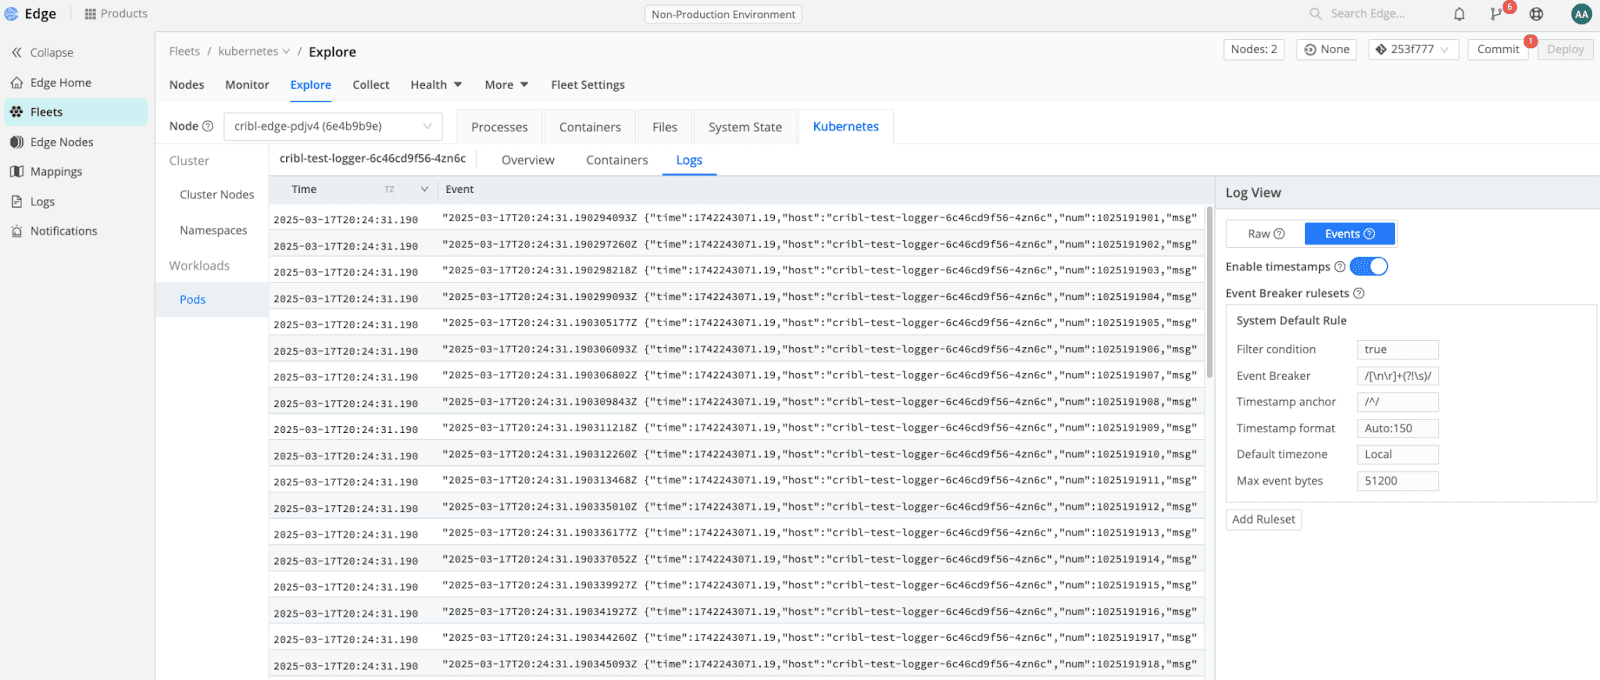
If a node in your fleet is running in a Kubernetes cluster, Cribl Edge now automatically includes a Kubernetes tab when you Explore that Node. Clicking on this tab reveals details about Nodes, Namespaces, and Pods, along with their metadata. Drilling down into a node provides host information and lists the Pods running on that node.

The Pods View allows you to filter Pods based on metadata and apply those filters directly to your source configuration, ensuring you collect only the logs you need.

You can then drill further into individual Pods to get an overview and see their running containers and logs in real-time. The log section allows you to test event breakers on the spot, ensuring logs are parsed correctly—eliminating guesswork and post-ingestion headaches.

How Kubernetes Explorer Fixes the Problem
Cribl Edge’s Kubernetes Explorer solves the key challenges of Kubernetes observability by providing teams with the unprecedented levels of visibility they need—without requiring direct cluster access. They can now see exactly which Pods exist, configure easily, and test log parsing in real time.
More Cribl Edge Features for Kubernetes Observability
Beyond Kubernetes Explorer, Cribl Edge also offers additional features that simplify observability in Kubernetes environments. Helm charts offer quick and easy deployment options. Out-of-the-box source integrations allow for the seamless collection of Kubernetes metrics, logs, and events.
With Cribl Edge’s innovative Kubelet API approach, you can instantly find and retrieve Kubernetes logs without needing access first, significantly reducing time-to-value. Use other pre-built integrations to effortlessly capture Pod logs, generate Kube State Metrics (KSM), enrich Kubernetes events, and scrape data from Prometheus endpoints.
Also in the 4.11 release, we’ve taken Kubernetes log ingestion to the next level. Cribl Edge now supports up to 40k EPS ingestion in the Kubernetes Logs Source! This boost is powered by newly introduced load balancing options, easily enabled via a simple toggle. You can learn more about it in the documentation for more details.
TL;DR: Stop Flying Blind in Kubernetes
With Kubernetes Explorer, Cribl Edge gives you full visibility into your Kubernetes environment. No more guessing. No more wasted time chasing logs. Just data easily accessible to you.
Ready to experience it for yourself? The new feature in Cribl Edge is available with the 4.11 release for existing users, while new users can explore it through our free trial today!
