

Understanding the expected behavior of the Splunk Load Balanced (Splunk LB) Destination when Splunk indexers are blocking involves complex logic. While existing documentation provides details into how the load-balancing algorithm works, this blog post dives into how a Splunk LB Destination sends events downstream and explains the intricacies of blocking vs. queuing when multiple targets (i.e., indexers) are involved.
Normal Operations
In the Splunk LB design, each Worker Process in a Worker Group establishes one connection to each of the indexer targets defined or discovered in a Splunk LB Destination. We call the mechanism that controls sending data to each indexer a Sender. The LB algorithm rotates through a list of senders, determining which indexers receive events and when. A Worker Process manages one Sender for each host:port combination within each configured Splunk LB output. Therefore, a Process can potentially manage hundreds of Senders as part of one or more Splunk LB outputs. Each Sender, in turn, manages up to four buffers concurrently for each indexer connection.
Each Sender gets up to 100 events or as many events as possible before the transit buffers fill up (more on later), and the LB algorithm rotates to another alive Sender. As the current Sender receives these events, it inserts as many as possible into an in-progress buffer with a maximum size of 1 MB (events larger than this will get a dedicated buffer). When the in-progress buffer contains 256 KB of events, or the flush interval (1 second) elapses, it’s converted to a transit buffer. This conversion occurs by placing the in-progress buffer into the Sender’s transit buffer queue. This queue has only two slots. Any events from the batch of 100 that didn’t fit into the first in-progress buffer will go into the second in-progress buffer. Once filled, it is also put into the transit buffer queue, which may or may not still contain the previous transit buffer.
Transit buffers are taken off the queue to be placed into the TCP socket buffer and put on the wire. Events flow from in-progress buffers to transit buffers to the socket buffer, with the application buffers (in-progress and transit) filling up and emptying as many times as necessary to get each batch of up to 100 events moved through to their intended target (a Splunk indexer). The slowest link determines the amount of time this flow takes for a given event or set of events; this is typically the speed at which the remote host can accept the data.
Normal operations are described above, and they are relatively simple, other than there are multiple buffers through which events will pass. The flow doesn’t change too much when problems start to occur. However, the effects of those problems occur at different levels within Cribl Stream, which causes the problems to manifest differently. The Senders can experience backpressure, or they can be blocked entirely, and if the blocking is sufficiently widespread, then the Destination itself can start blocking upstream.
Sender Blocked Criteria
Cribl Stream can encounter a problem when Senders are blocked when sending to indexers. What causes this? We’ve learned about the in-progress buffers and transit buffers for each Sender, and how multiple Senders are managed by each Worker Process that constitutes each Splunk LB output. Technically, each Sender connection can use up to two concurrent transit buffers to store events if necessary, based on how quickly events are flowing into Stream vs. how fast the target can accept them. Once two transit buffers exist, the Sender is deemed blocked because the Destination is saturated; this reduces its priority in the LB algorithm and, therefore, reduces, but doesn’t eliminate, the chance of a new batch of 100 events being assigned to it. This blocked status exists until at least one of the transit buffers gets completely flushed to the TCP socket buffer.
Senders will also be blocked if they become disconnected from the downstream Splunk indexer. Disconnected Senders get marked as dead, while those that remain connected are deemed to be in an alive state. When a connection is marked dead, a Sender passes its transit buffer(s) to another Sender, within the same Worker Process, in an effort to send those events and keep data flowing. A Sender will continue passing around its transit buffers until it finds another Sender with a valid (alive) connection.
Note that blocking can occur at two levels. We’ve learned that when two transit buffers are full or when the Sender is disconnected, the Sender is effectively considered blocked because events can’t flow in either scenario. However, that is not the same as an entire Destination that is blocking. We’ll use the term blocked to refer to when individual Senders can’t send downstream. Blocking, on the other hand, is when the Stream output is doing its own blocking by propagating block signals back to clients. The latter can occur as a result of the former.
Figure 1 illustrates the distinction between blocking and blocked, both of which are based on the perspective of the Splunk LB output. Effectively the distinction is two-fold: what is performing the action and where that action originates. The Splunk LB output is, generally speaking, the central point for both actions. The output (more specifically its Senders in the blocked scenario) is going to be the subject receiving the action (blocked). Contrastly, in the blocking scenario the output is the subject performing the action (blocking). The latter scenario is discussed in the next section.
Splunk indexers perform blocking to Stream so the right-most vertical line in Figure 1 indicates the origin of that action and the arrow depicts the extent to which that action extends through the data flow, ending at the egress side of a Sender with another vertical bar. The blocking is on a per-Sender basis but is drawn at the bottom of the Figure 1. At the output level the blocking action being performed begins at the ingress side of an output where the left-most vertical bar is depicted, which prevents data entering the output. The arrow indicates that action extends back through inputs to clients.
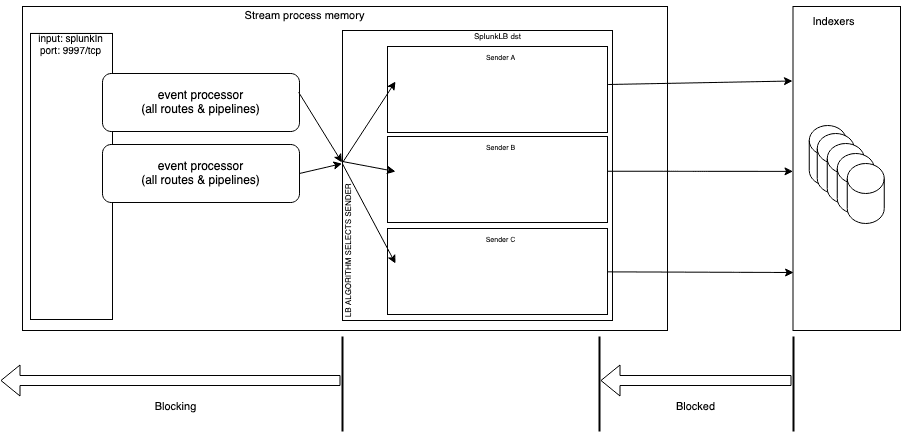
Figure 1
Destination Blocking Criteria
Another problem that can be encountered is when an entire Destination is blocked. What is the criteria for the entire Destination to be blocking? The criteria differs depending on whether the Destination is LB-enabled. In this blog post, we’re focused on Splunk LB, so we’ll discuss this from an LB-enabled Destination perspective. If the Splunk LB Destination has Backpressure behavior set to Block, it will begin blocking only if all Senders are blocked. This will occur if all Senders have two concurrent transit buffers active (that is, not sent to the TCP socket buffer via socket.write()), if all Senders are disconnected, or some combination of those two criteria. When a Sender is in any of these states, it’s considered blocked. If enough Senders are blocked, the overall Destination status will be affected (change from green or yellow to red). However, all Senders must be red (blocked or disconnected) for the Destination’s overall health to be red and for blocking to ensue.
If the Splunk LB Destination is instead configured to use PQ as the Backpressure behavior setting, the same conditions required to start blocking are required to trigger PQ to engage.
A Sender will report that it is unblocked immediately after at least one of the two transit buffers has completely moved from the transit buffer queue to the TCP socket buffer. The limit of two is to avoid having too much data in the socket buffer and is based on the assumption that the remote host is saturated. If both transit buffers are blocked for more than one second, the output channel in that process will log an event indicating it is blocked. If too many (or all) Senders are blocked or disconnected, the Destination status changes to yellow or red. To reiterate, since this is an LB-enabled Destination, blocked Senders do not propagate blocking back to clients, with two exceptions: if you have Stream 4.0.3 or older or if the Backpressure behavior is set to Block (which then requires all Senders to be blocked). Otherwise, the LB algorithm will simply place more priority on unblocked Senders within the Splunk LB Destination. The behavior of Stream prior to version 4.0.4 is a known issue and is fixed in 4.0.4.
What Is Backpressure?
Generally speaking, a Stream process will periodically experience backpressure when sending to Destination hosts due to the Destination’s performance, network congestion, or both; therefore, it’s transient by definition. Consider a scenario in which host A sends to host B, which then sends to host C. Backpressure means a client (host B) can’t send data as fast as needed to host C in relation to how fast it is receiving data from its own sources (host A). This backpressure makes data flow suboptimal from host A to B to C. But it’s a natural aspect of networks, and TCP is built to handle this via its flow control feature. Backpressure can also originate from within a Stream process due to inefficient processing of events or because the Worker Process is receiving too many events.
One of the benefits of load-balanced outputs is that they minimize backpressure propagation to originating clients compared with non-load-balanced outputs. But LB-enabled Destinations are not completely immune to backpressure. When it does occur with outbound connections for an output, it will occur randomly; this randomness is predicated on the Destination. Some connections may experience more backpressure than others. There should be little to no impact to Sources sending to Stream if the duration is short-lived enough and as long as there is at least one Sender available within the LB-enabled Destination. Although the data flow during backpressure is not at its peak, it’s still able to flow and, therefore, is not completely stopped. This is the difference between backpressure and blocking. If no data flows, you know that blocking is occurring. We also know that for a Splunk LB Destination, blocking occurs at the Destination level, based on the criteria described in the previous section.
What Is the Mechanism Used to Perform Blocking?
We’ve discussed the criteria to perform blocking, but how does Stream actually perform blocking? When blocking occurs, a TCP window size of 0 is sent to only those TCP clients whose socket receive buffer on a Stream Node has become full (verified using netstat or ss) as a result of a worker process falling behind as it reads from those buffers. This 0-byte TCP window size is standard TCP functionality, so technically, Stream isn’t sending the window size of 0. Rather, the TCP stack does this as a reaction to what the application is doing to prevent losing data from the socket receive buffer.
What is considered “falling behind”? The TCP socket receive buffer for any given connection may or may not have content at any given point in time. For high-volume connections, there could be some data in the buffer all the time, depending on how fast the receiving Stream process can read data from that buffer. The amount of bytes in the buffer will typically fluctuate. Still, an indication that an application is falling behind is when the number of bytes continues to increase for multiple seconds without decreasing. If this situation continues for long enough, the buffer will become full. If a socket’s buffer is full, any new data will overwrite the oldest data, but a window size of 0 prevents the receipt of new data and, therefore, the loss of existing data in the buffer.
All clients whose data are going through Routes to a Destination are affected when Destination-level blocking occurs. This results in all the TCP connections associated with those clients receiving the blocking signal.
A Picture Speaks 1000 Words
We’ve discussed a lot of topics—buffer, blocking, backpressure, Senders, sockets, etc.—and we used specific language to avoid ambiguity. But there may still be some confusion regarding the exact mechanics of how data flows and how the failures of Senders can affect the flows. To help visualize this complex design, I’ve provided two diagrams. The first is an overall architecture diagram of a single Stream process centered around a Splunk LB Destination, with some details removed for clarity or irrelevance. The second illustrates the mechanics of the data in and out of the buffers.
Depicted here in Figure 2 is a simple example of a single Splunk input with two client connections sending data to a single Splunk LB Destination with only three Senders, each forwarding data to one indexer. Figure 2 depicts the full design, specifically focused on all the possible buffers that can exist for every Sender. Each in-progress buffer gets converted to a transit buffer when the in-progress buffer size hits the 256 KB limit or the flush interval has elapsed. The transit buffers are sent in FIFO order.
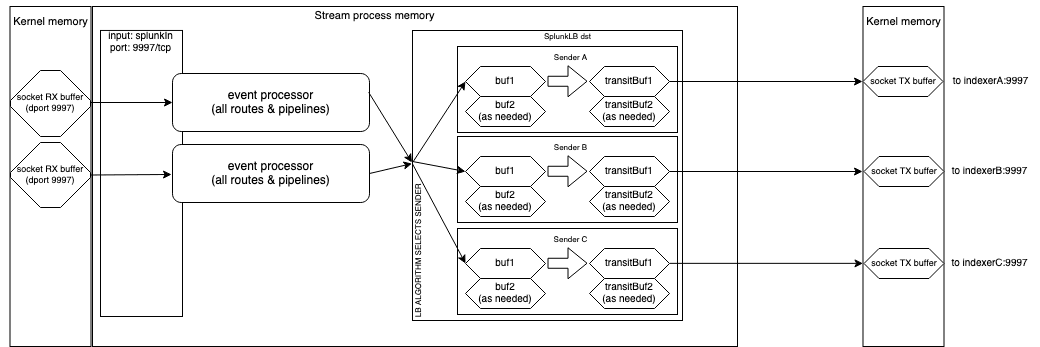
Figure 2
Figure 3 shows the mechanics of using Senders in various states that can exist, followed by a description of each and how we got there. We can see that backpressure behavior would not be triggered, regardless of whether it’s set to Block, PQ, or Drop, despite two Senders being unhealthy, because one Sender (A) is still healthy. Data flow is not completely blocked at the Destination level, it’s just moving slowly because there is only one usable Sender/indexer.
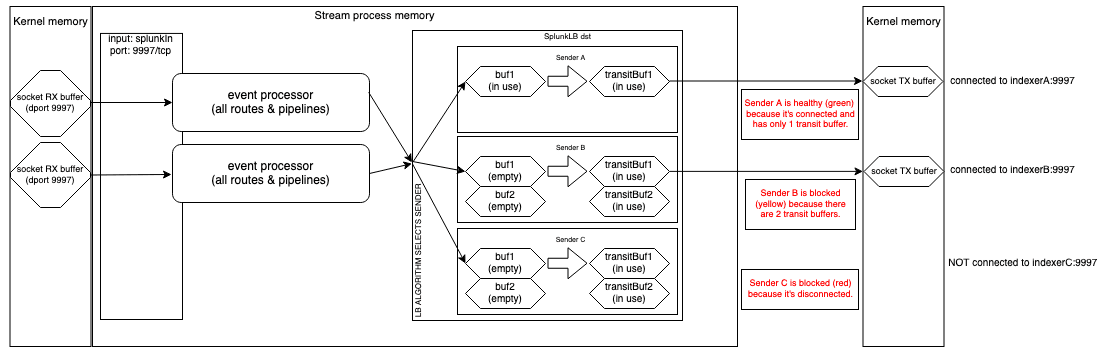
Figure 3
The diagram depicts the current state of Sender A after the following actions took place:
An in-progress
Buf1(not depicted) filled up to 256 KB and was moved to thetransitBuf1slot in the transit queue. The queue itself is not depicted for clarity.transitBuf1had not yet been transmitted to the indexer, but while it waited for the indexer to unblock, a new in-progressbuf1(depicted) was created and began filling up with more incoming events. Two buffers now exist.When the new in-progress
buf1was ready to be moved along, it either becametransitBuf2 or 1, depending on whethertransitBuf1was successfully sent.
Sender B has a higher data volume than Sender A, and its indexer can’t keep up. So, Sender B must use all four buffers to compensate for the backpressure, while Sender A only needs two buffers. Normally the data volume flowing to each Sender is fairly even such that all Senders will be experiencing similar data volumes and, therefore, using the same number of buffers. However, one reason why the buffer quantities could differ among them is due to the Load Weight values being tweaked in a Splunk LB configuration which causes indexers with higher weights to receive more events than those with lower weights.
Sender B has all transit buffers filled because it’s getting blocked by the indexer. And because blocking has started, the Sender won’t allow the currently depicted in-progress Buf1 to hold any events. The following actions took place to reach the depicted state:
In-progress
Buf1(not depicted) filled up and was moved to the transitBuf1 slot in the transit queue.While
transitBuf1was awaiting transmission, a new in-progressBuf1(not depicted) filled up again and was also moved to the transit buffer queue astransitBuf2, sincetransitBuf1had not yet been sent.Then in-progress
Buf1was created (depicted), but it does not contain any events because the Sender is now blocked as a result of two transit buffers existing.This blocked state exists until the Sender is unblocked by being able to send
transitBuf1, at which point in-progressBuf1can begin filling up.
Sender C is blocked because it’s disconnected, so both of its transit buffers are not only in use but also full and won’t flush until the connection is re-established. Although all three Senders are part of the configuration, at this moment, Senders B and C are at the bottom of the LB priority list due to their current blocked status. Senders B and C could still get events allocated to them, though, since there are only three Senders total. The more healthy Senders that exist, the less frequent that blocked Senders will get events allocated to them.
Sender C has filled its buffers like Sender B, but for a different reason (it’s disconnected). Because it’s disconnected, the worker process will move the transit buffers for Sender C to another Sender so they can be transmitted. In this case, the only other Sender that is healthy and not blocked is Sender A so that it will receive them.
Conclusion
Although the logic described in this post is complex, I hope that this explanation and the accompanying diagrams clearly illustrate how we differentiate the criteria for blocking vs. queuing for a load-balanced Destination and also what happens for a Splunk LB Destination when individual Senders have their data transmissions impacted (blocked) for various reasons. Hopefully, this information helps you troubleshoot your environments and be better equipped when configuring and troubleshooting your Splunk LB Destinations.