
Metrics data continues to play an ever larger role in the modern logging estate. Whether you are processing metrics directly; or deriving metrics from raw log, event or trace data; the delivery and management of metrics can have a significant impact on your observability budget. Optimizing your metrics game can impact budget, staff time, and risk.
As the data engine for IT and security, Cribl wants to help you do just that. In the following post, we'll show how Cribl allows you to route, aggregate and store your metrics data. Your metrics game will go from little league to the big leagues.
Intro to The Cribl Way
In a previous life as The Log Guy, I was in a continual battle over which data to ingest into our (very expensive) analysis tier. Not all metrics, event, log, and trace (MELT) data is created equally. Low value, high volume is not no value. The choices were stark, though. Either ingest the data, and pay an arm and a leg. Or don't ingest the data and risk missing something vital, not having data when needed, or failing an audit.
That's no good. Cribl has a better way. In our documentation we discuss the control Cribl gives you to address this issue. Briefly:
Onboard all of your data into cheap object store. This becomes your system of retention.
Only send data that matters for day-to-day operations to your analysis tier.
Provide a precise, fast, and easy way to find and replay data from the object store.
Cribl's offerings are all about giving you power over your data. Control what goes where, when it's delivered, how it gets there, and what format to store it in. As a result you can reduce the retention time to the bare minimum required in your analysis tier. And you can feel safe knowing that you own the data in your retention tier – no vendor chains. It's wins all the way down.
Intro to Metrics
Now let's examine how metrics fit into this plan. First, let's review a few definitions: What are metrics? And what is cardinality?
Definition: Metrics
In observability (aka, o11y, because there are 11 letters between the o and the y) we consider a metric to represent any numeric value measured over intervals of time for a given resource. Examples of this include OS resources, application activity, or network performance. Metrics also include dimensions. A CPU reading will come from multiple servers. Think of dimensions like the "by clause" in a count statement. Our CPU activity metrics by host, app would produce something like this (in pseudo-code, human readable form):
2024-10-23T13:00:00z 192.168.1.1 50% cpu used app1
2024-10-23T13:00:00z 192.168.1.2 70% cpu used app2
2024-10-23T13:00:00z 192.168.1.3 20% cpu used app3
2024-10-23T13:00:01z 192.168.1.1 60% cpu used app2
2024-10-23T13:00:01z 192.168.1.2 30% cpu used app1
2024-10-23T13:00:01z 192.168.1.3 40% cpu used app3
We have:
A time series
A value – a percentage
A type of reading – CPU usage
2 dimensions – the server IP, and an app name
So metrics data is not really event data. Similar, but different. It's usually more compact, often more chatty, and so ripe for some clean-up.
Definition: Metrics Types
There are several types of metrics data. This blog post is going to cover the 2 most used: Gauges and counters.
Gauges
A temperature reading of a CPU is a typical example of a gauge metric type. These are point in time measurements that can increase or decrease. Operations on gauges include max, min and avg. Summing a temperature reading makes little sense.
Counters
Many cars today have a reading for miles driven for the current drive. Every time you start a new drive, the counter is reset, and (in theory for this example) the ending total distance is reported when you stop and turn off the car. There is no such thing as a negative mile. Statsd is a popular metrics tool that uses this type of counter.
An alternate form of the counter paradigm is used by some systems. Continuing the car analogy, these are more like the odometer. The counter only resets when it "rolls" over (the integer type max size is reached), or when the engine is swapped (the system is rebooted). Prometheus is a popular project that defaults to using this style of counter in metrics.
Aside from the reset, in either case, counters stay flat or go up. There is no way to say I drove -100 miles. Operations on counters include things like sum, max, min, average, etc.
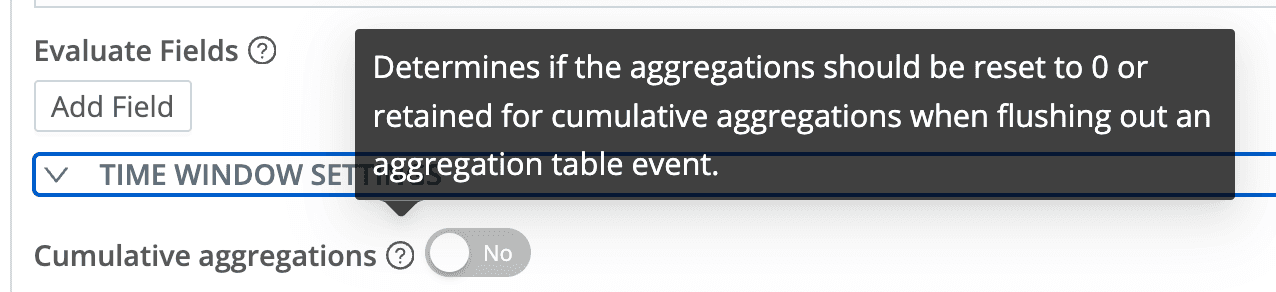
Cribl will handle either style of counter on input. We default to using the statsd method when writing new metrics data from any of Rollup Metrics, Aggregations, and Publish Metrics. You also have the ability to specify the Prometheus version in the Aggregations function under Time Window Settings:
Definition: Cardinality
Cardinality is referring to how much uniqueness we have in our dataset. In the example above, we have 3 different hostnames as dimensions. That's not so bad! 3 is very manageable. But if the source of that metric feed was open to the internet, the number of potential IPs is in the billions. IPs are generally considered a high cardinality dimension. In the case of IPv6, extremely high cardinality.
So why do you care? High cardinality presents a few problems. First, it's just more data being pushed through your plumbing and landing in your analysis tier. Second, all that extra dimensionality means your analysis tier is going to have to work harder. More CPU and RAM, more disk, slower reports.
High cardinality in a nutshell: Imagine a spreadsheet with time going down the left, and host IPs going across the top. You have 42 million unique IPs. In 1984 movie reference terms:

Finally, let's talk about making metrics work better for you.
Optimizing Metrics
There are three areas where we can gain huge benefits:
Temporal aggregation: Instead of sending a
bytes_sentmetric to your analysis tier every second, would it be okay to send at 5, 10, or 30 second intervals? This is one way of reducing cardinality.Dimensional (or spatial) aggregation: Instead of sending
bytes_sentfor each individual host that hits your server, would it be okay to only send the sum of all? Or maybe by CIDR block? Or internal silo/team?Logs2Metrics:Take chatty event logs and turn them into numbers. Instead of a giant windows event showing a user logged in, we report
count:1 action:login. Better still for 100 windows events, we report one metric, two entries (dimensions):
2024-10-23T13:00:00z count:90  action: login  host: all
2024-10-23T13:00:00z count:10 action: logout host: all
ℹ️ You might be wondering about losing that original event or metric fidelity. Don't worry! Remember The Cribl Way above. Our plan is to store the original data exactly as received, in low-cost object store. If you need the original data, Cribl offers easy and painless ways to replay it. LIke a MELT DVR.
Solution 1: Crunch Time
Many metrics sources send data at a rapid rate. Sometimes sub-second. For your day-to-day operations, do you need that level of granularity? I'd wager that's usually not the case.
For example, I used to live and die by a time series chart showing login counts, comparing week over week trends. I was not interested in counts at the 1 second level. Per minute was fine. At the time I didn't have Cribl, so I had to send that per-second data into Splunk. Then I'd craft a Splunk search to reprocess all the data, summarizing it up into a new bunch of data, and storing it back into Splunk. After that process was done reports and users were able to access info they needed. But this incurred a lot of processing overhead and expense in Splunk!
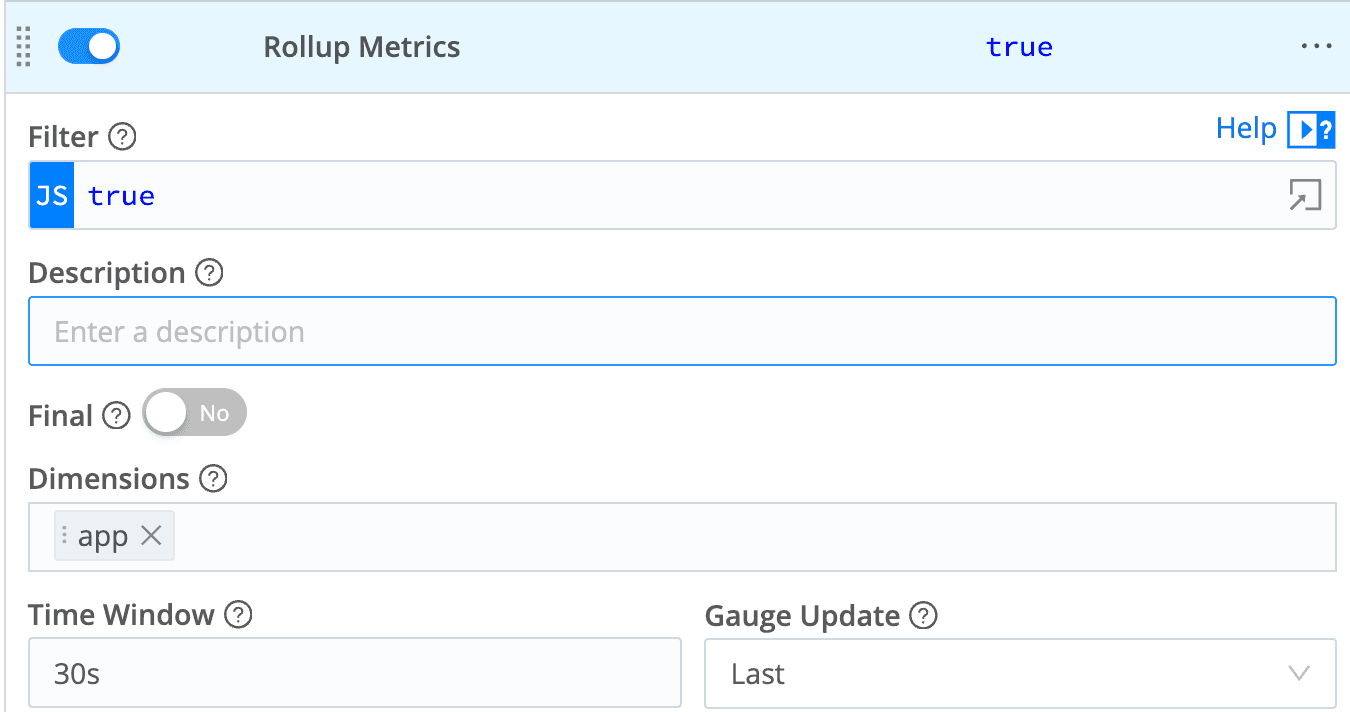
With Cribl Stream, I can aggregate the metrics, and reduce cardinality, as they pass through. In flight. This is such a common, and valuable, use case we have a dedicated function for the exact scenario: Rollup Metrics. Here's an example config:
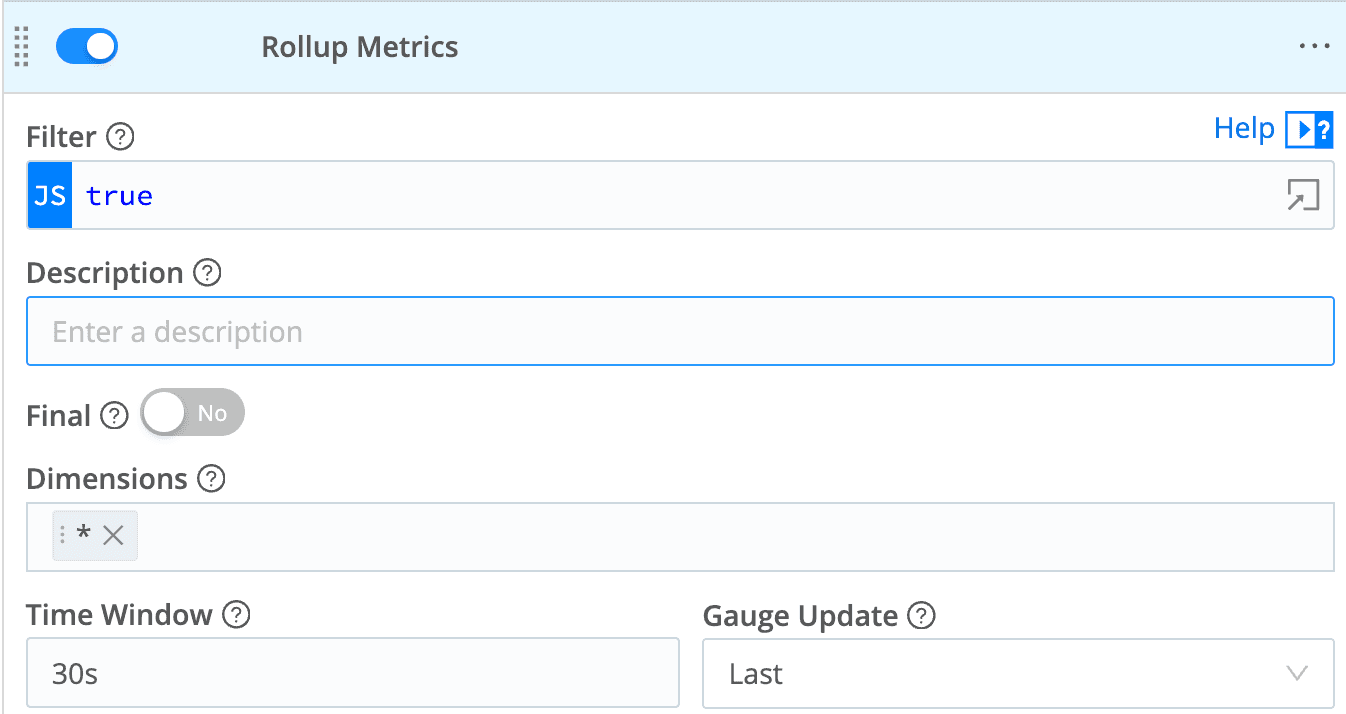
Yeah, it really is that easy. I'm keeping the same dimensions, so no cardinality compression there, but we are sampling, or aggregating, the data every 30 seconds. We are reducing cardinality around time.
ℹ️ Note the "Gauge Update" option. Again, gauges have a different kind of data. Summing them up over time doesn't work. Cribl will recognize the type of data and Do The Right Thing, but you need to choose which function you want for a gauge.
Solution 2: Flatten Dimensions
Similar to collecting many time readings into a single entry, we can discuss instead – or additionally! – reducing dimensions. Let's look at some pseudo metrics code again:
2024-10-23T13:00:00z host: 192.168.1.1 bytes: 100 app: app1
2024-10-23T13:00:00z host: 192.168.1.2 bytes: 200 app: app2
2024-10-23T13:00:00z host: 192.168.1.3 bytes: 300 app: app3
2024-10-23T13:00:10z host: 192.168.1.1 bytes: 100 app: app1
2024-10-23T13:00:10z host: 192.168.1.2 bytes: 200 app: app2
2024-10-23T13:00:10z host: 192.168.1.3 bytes: 300 app: app3
You'll notice this is a combo of both methods, temporal and dimensional compression. We are aggregating in 30s intervals, and also keeping the app dimension, while dropping host. The result:
2024-10-23T13:00:00z bytes: 200 app: app1
2024-10-23T13:00:00z bytes: 400 app: app2
2024-10-23T13:00:00z bytes: 600 app: app3
Now imagine an actual metrics flow with records coming in every second from hundreds or thousands of hosts. This could be a massive, massive, reduction. With both together, you can often get to a 95% reduction of data going into your analysis. Or more.
Solution 3: Convert Logs to Metrics
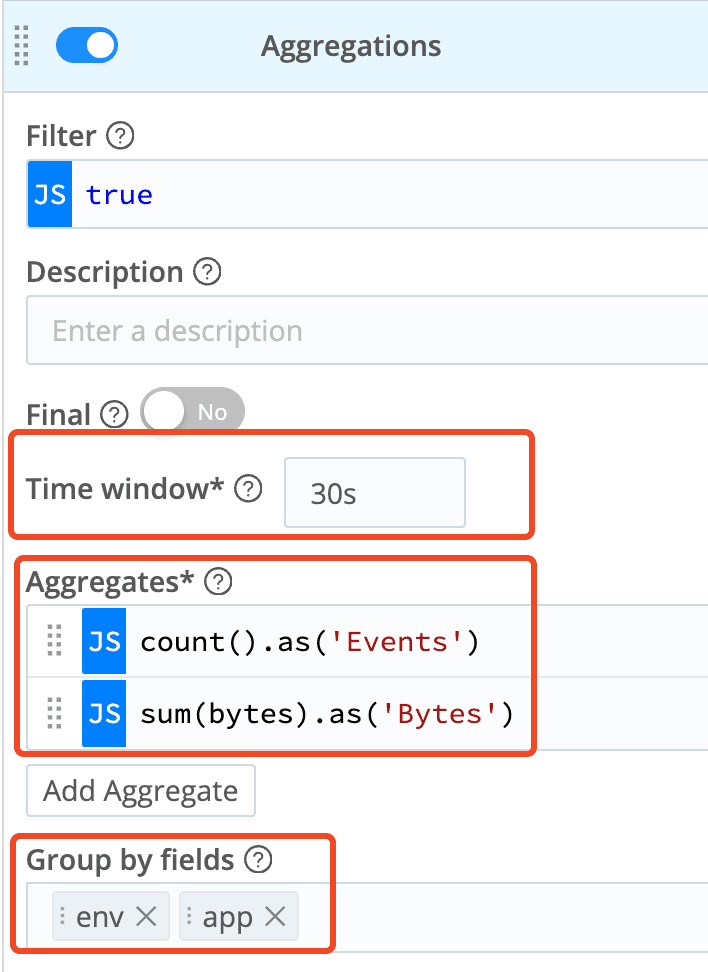
David Maislin posted a fantastic blog discussing this exact topic not too long ago. The gist is to extract the meaningful bits of metrics data from bog standard application logs, aggregate them, compressing time and dimensions as needed, and then package them up in the standard metrics shape. The Aggregation function will be your key tool here. Something like below:
Conclusion
Cribl offers you the tools required to control, and own, your data from the point of collection; through pipelines; to delivery into analysis, and storage; and recover data from that retention. In the case of metrics processing, we can generate metrics from logs, squash dimensions to reduce the number of reports, and compress time to reduce the intervals (increase the time between readings).
Our always free training includes sandboxes with one module just for the metrics case, and our more extensive University. And finally, you can sign up for a free Cribl Cloud with your own working Cribl instance running on our infrastructure. Easy! You'll get up to 1TB a day -worth of Cribl at no charge. Forever.