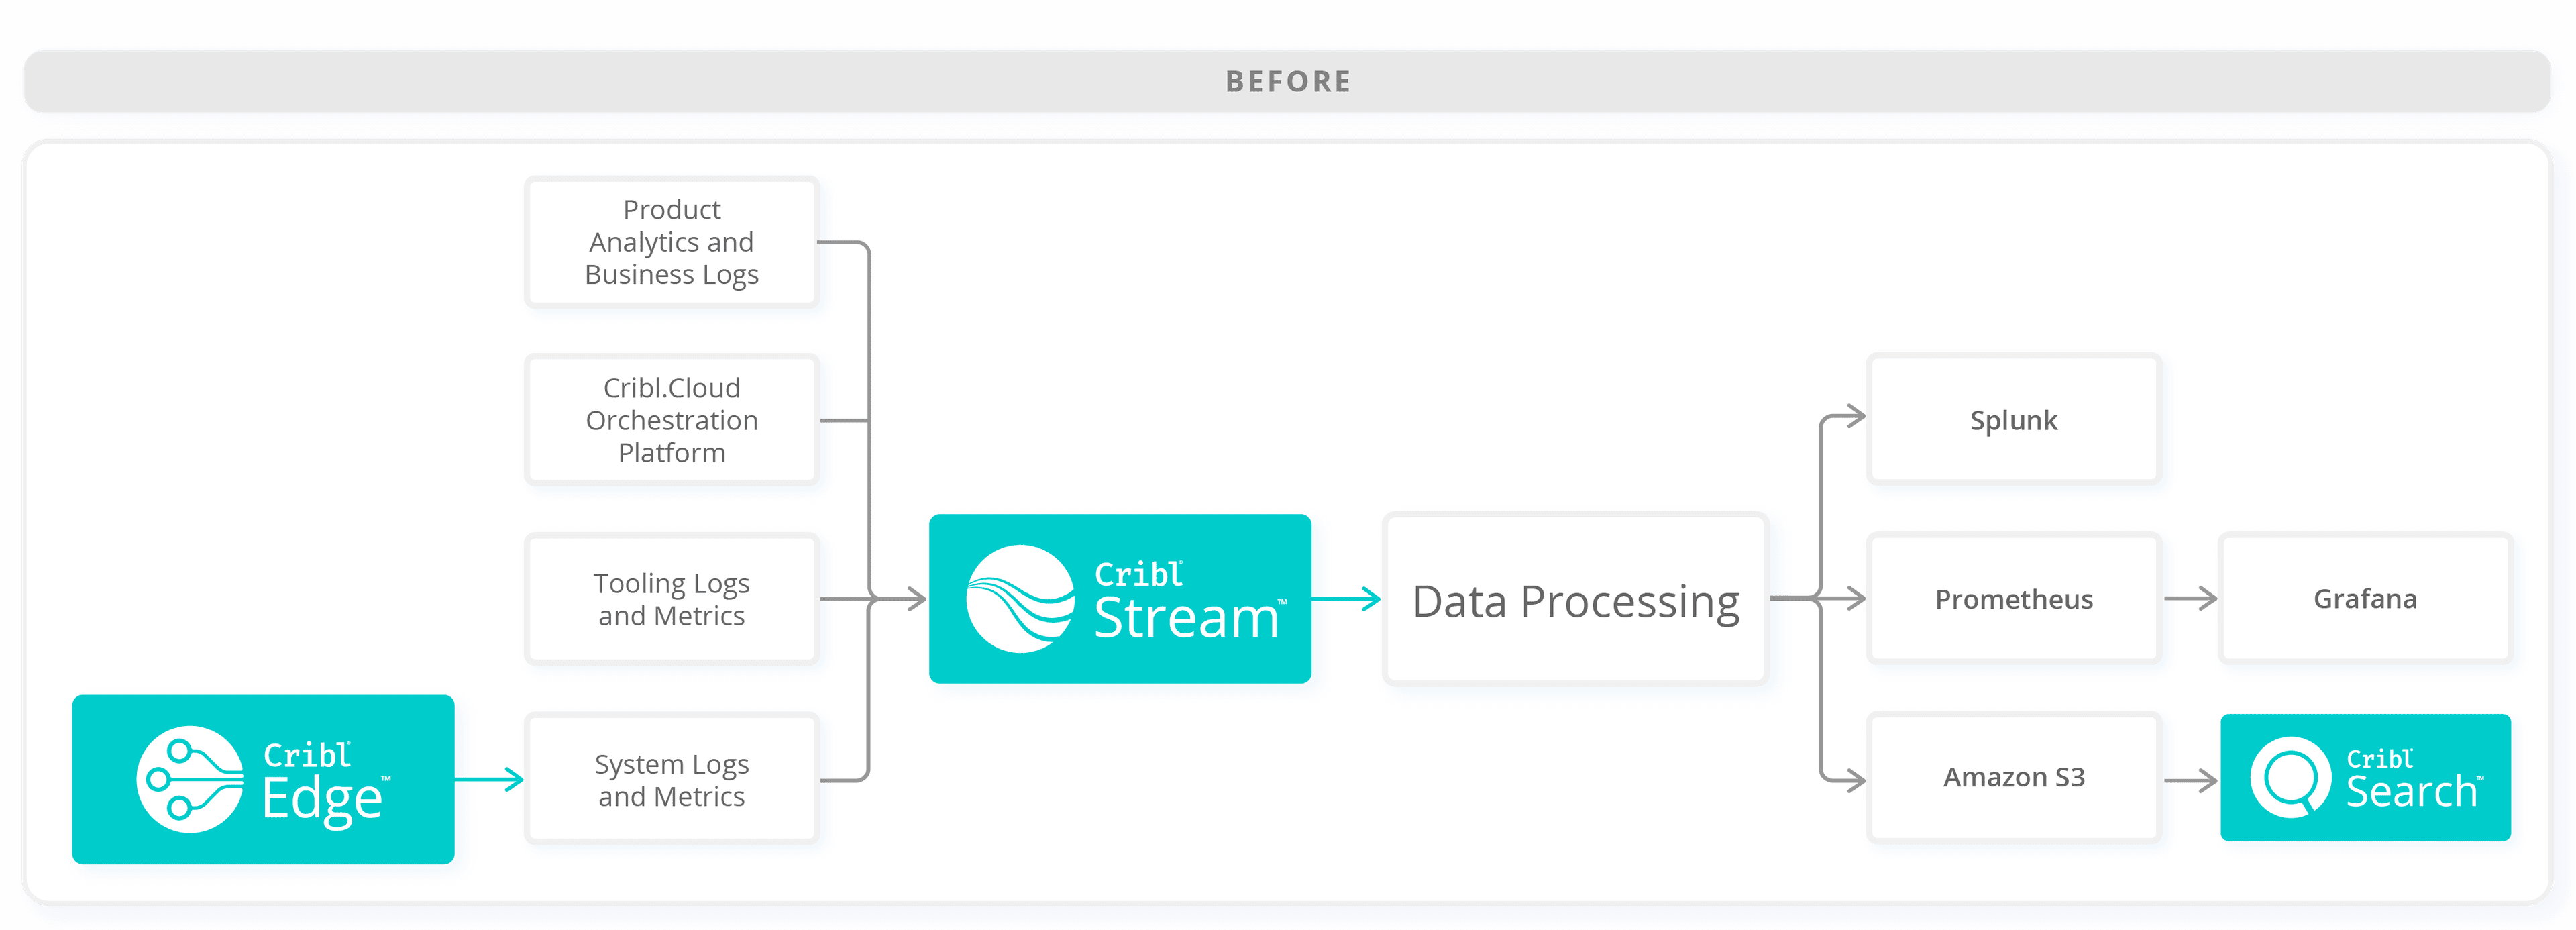
Cribl.Cloud has grown substantially since its launch, and our observability practice has developed in parallel. Gone are the early days of manageable logs and metrics. As we continue to grow, that problem will become even more challenging. We used Splunk internally, a well-used internal system, as our primary event management system. With Cribl Edge nodes deployed across our entire cloud fleet, we collect logs and metrics and send them to Cribl Stream for processing and routing. From there, data is shipped to three destinations: Splunk as our front-end for events, Prometheus / Grafana for metrics, and Amazon S3 for long-term retention. Given the cost-effectiveness of S3, we leverage Cribl Search on top of that S3 destination to get more information we otherwise wouldn’t send to Splunk or Grafana for ingestion and indexing.

This method scaled well, getting us through our first few hundred Cribl.Cloud organizations to thousands today. What happens when a critical component needs to be removed from something that has scaled exceptionally well for us? Say the complete migration away from Splunk to another solution (or multiple solutions) within a few short weeks while striving for minimal impacts across the board at the company. Splunk has deep roots for us; the engineering teams do not use it exclusively but instead across the business. From summarizing diagnostic data, product analytics, and security-related activities, it’s more than just a core component for Cribl.Cloud, is a core component of how we as Cribl operate.
Here’s the challenge: we had two weeks to completely migrate away from Splunk and evolve our observability practice to use something different while reducing the impact of such a change as much as possible.
We were up to this challenge and knew we had the right tools to make the transition part of this problem easy. We do it today by forking data across multiple different destinations, and Stream makes it extremely easy to add just another destination to a new arbitrary solution we can use for event management.
Immediately, we broke the task into different workstreams. Those workstreams represented the high-impact needs we had to solve with this new solution. As part of this, we knew we had to consider the following:
An easy-to-use event management platform usable by all internal Cribl employees.
Scalable and resilient, it needs to grow with us.
Robust query language.
Advanced dashboarding capabilities.
Security and user management capabilities (role-based access controls, permission policies, etc.).
We knew quickly that we wanted to use Cribl Search as much as possible. Most of our data ends up in S3 for long-term retention, and we use Cribl Edge across Cribl.Cloud, so it’s a perfect fit! We also knew that Cribl Search is a new product for us and might not give us all the functionality out of the box that we need, at least until we build that capability into the product. In addition to increasing our internal adoption of Cribl Search, we considered the following two platforms to fill in the gaps:
Elastic / OpenSearch
Document-driven, prefers denormalization of data.
Kibana-based user interface with rich dashboarding and many different query languages, we sought to understand the difference between.
Scales to our needs as we grow.
Grafana Loki
It is included as part of our Grafana suite of tools and has native integration points with Grafana for visualization.
LogQL is similar to PromQL but can get complicated when writing more complex queries.
It’s a similar UI experience to Grafana, but not as elegant.
Metadata indexed as labels.
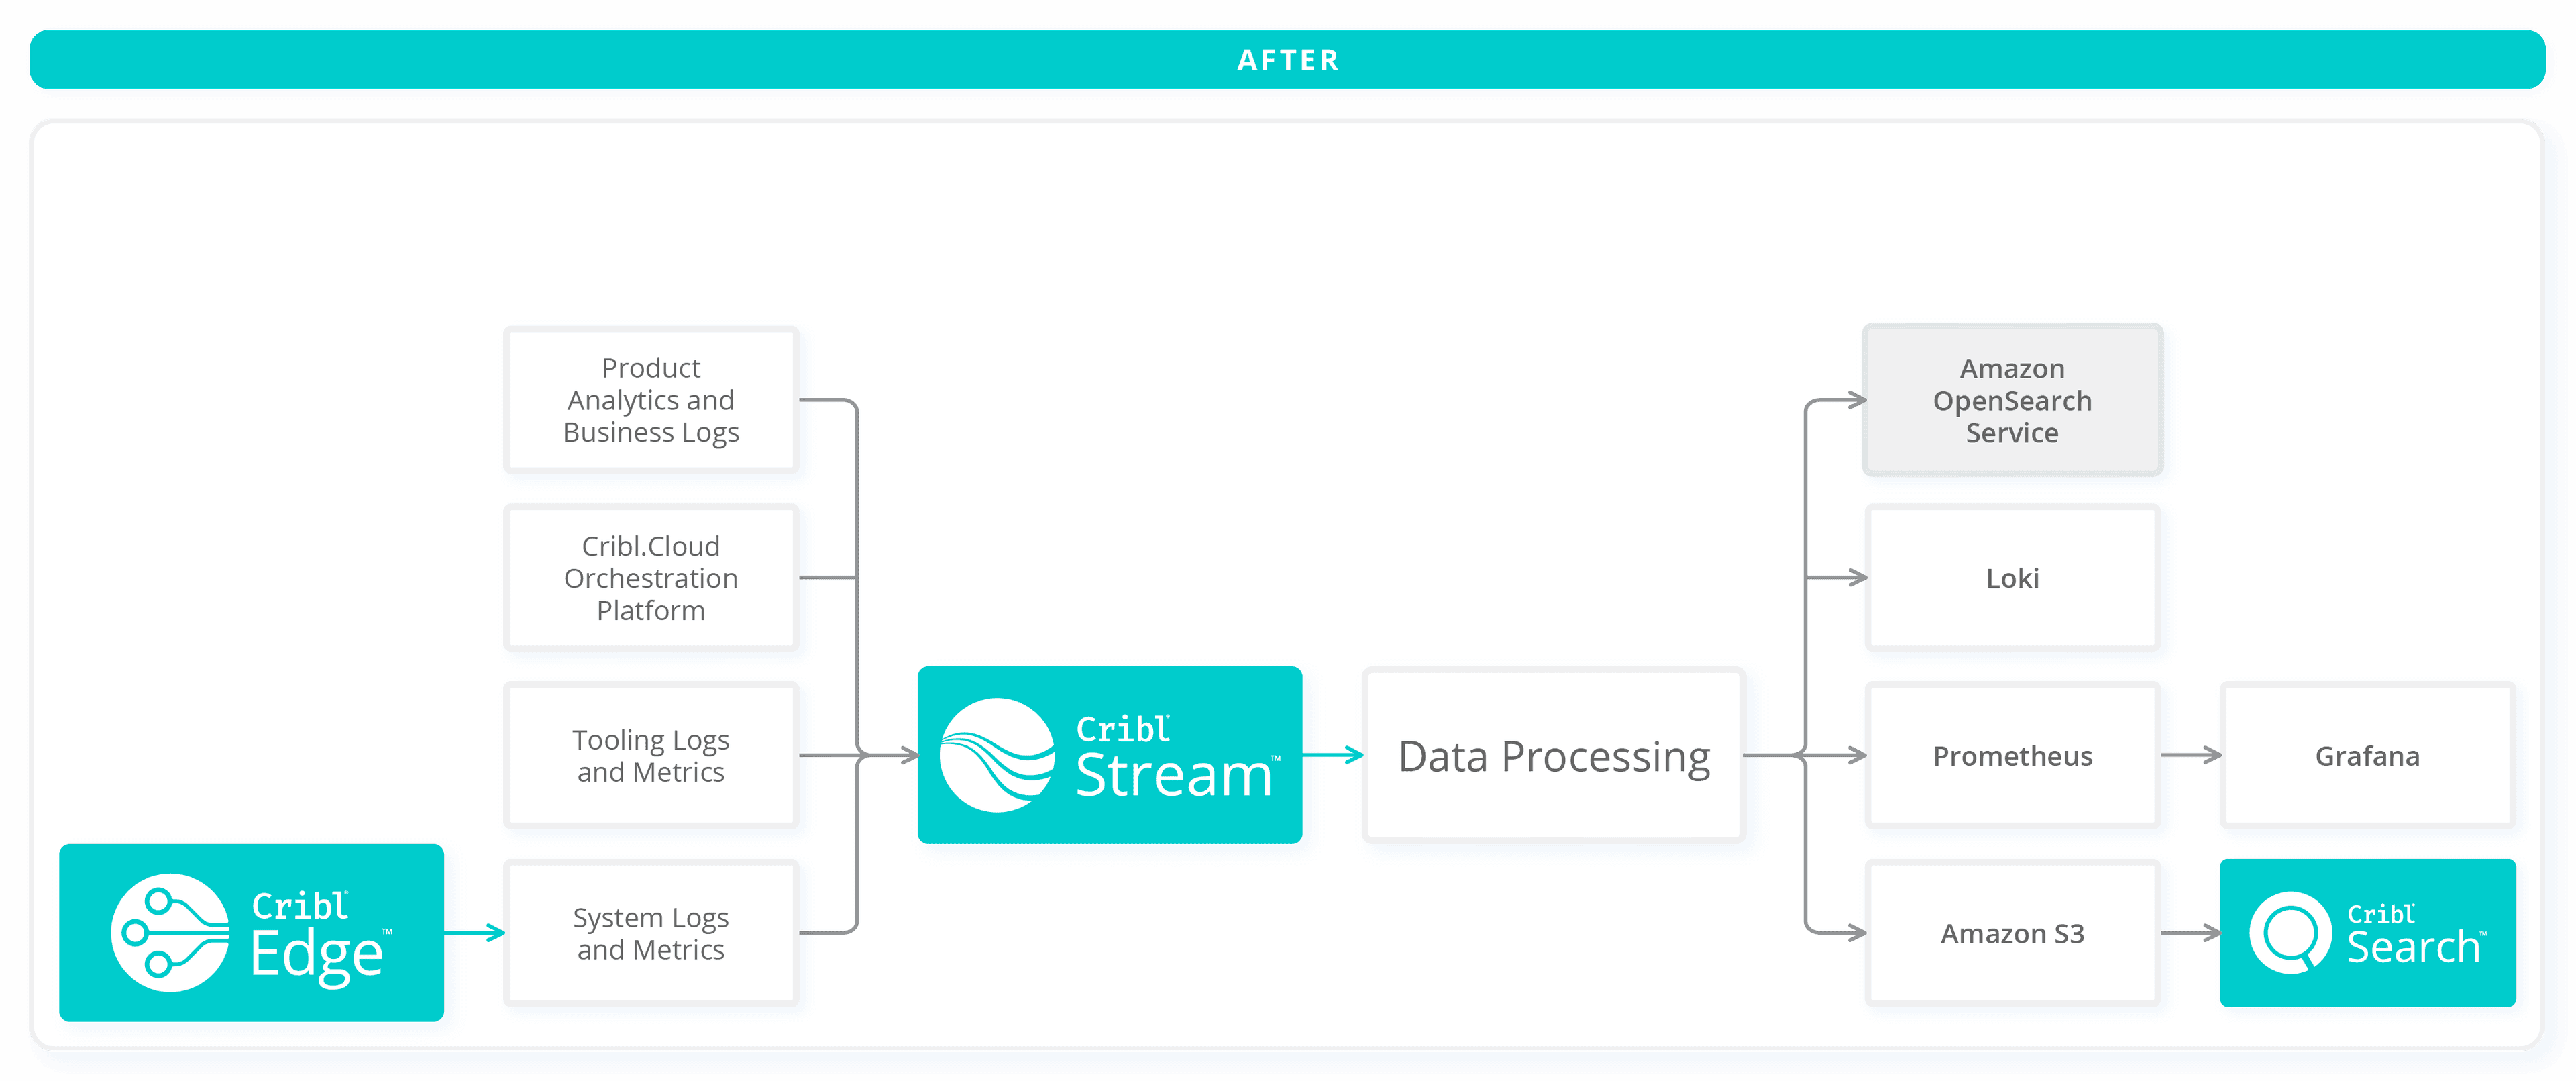
We were able to evaluate each of these tools within a day. With two new destinations in Cribl Stream: one for an Amazon OpenSearch Service cluster we stood up and another for our Grafana Loki endpoint, a new Output Router that clones our data across all four destinations (Splunk, S3, OpenSearch, and Loki), and a pipeline for Loki and OpenSearch so we could tweak data along the way.
With the transition of data to a new platform and the evaluation of new tools complete, we quickly learned that we’re looking at a multi-tool approach. Instead of simply selecting one tool to replace our event management system, we needed to use many, for example:
Splunk was used heavily to derive metrics from events; we identified those cases, migrated those metrics to Prometheus, and used Grafana for visualization instead.
Splunk was used to parse Cribl product diagnostic data. Those cases were easily solved using Amazon S3 storage and Cribl Search.
OpenSearch is good at exploring and filtering event data, but it is not as powerful as other tools to create dashboards, and there isn’t an easy way to pull in metric data stored in Prometheus (nor would we want to). Instead of figuring out how to write complex queries in OpenSearch (some of which will not work), we integrated our OpenSearch endpoint as a data source in Grafana using the OpenSearch plugin. Now, we can use Grafana as our dashboarding tool of choice and show views with filtered event data and metrics.
We saw an opportunity to use Loki to store AWS CloudTrail event data used for Cribl.Cloud, keeping it in S3 and using Search.
The Finish Line

We launched our new strategy ahead of schedule. Our support, analytics, business, and engineering teams use OpenSearch, Grafana, and Cribl Search without significant interruption. We’ve taken this opportunity to level up our entire company on the observability tools we use at Cribl. From metrics stored in Prometheus and visualized using Grafana, event data in OpenSearch, and diagnostic data in Cribl Search, we have one major takeaway: the ability to make split-second data decisions at scale is not easy.
Cribl Stream is a game changer that allows us to evaluate new solutions quickly and change our strategy at a moment’s notice. If you’d like to try it, you have instant access in Cribl.Cloud.


