
For most web platforms, a significant share of incoming traffic isn't human. Bots crawl product catalogs, scrape pricing data, probe APIs, and manipulate request patterns in ways that quietly erode performance. Some of that is benign. A lot of it isn't.
When latency starts climbing and cache hit rates begin to drop, bot traffic is often the culprit, and the harder-to-catch variety doesn't look like an attack. It mimics normal browsing behavior closely enough to stay under the threshold of your existing defenses, quietly degrading performance, impacting metrics, and blocking legitimate users from interacting with your content.
This post shows how you can use federated queries from Cribl Search into Hydrolix to analyze CDN logs and origin application telemetry from a single interface to detect a common bot issue—cache busting. In this scenario, automated traffic targets an inventory API, bypasses the cache, and overloads the origin server.
A real-world eCommerce issue: Bots impacting inventory
Bot traffic often doesn’t look like a DDoS attack. Scalping bots can make thousands of inventory checks in an hour and exit with no purchase, yet still not trigger alerts that let you know bots are impacting your site. This behavior will skew inventory metrics, potentially impacting pricing, inventory, and customer satisfaction.
Take a retail platform with a standard inventory check endpoint:
/api/inventory?sku=123
The storefront makes a request before displaying the "Add to Cart" button. A scraper targeting the site doesn't need to send thousands of requests per second. It just needs enough variation in the query string to prevent the CDN from reusing cached responses. Here are some examples:
/api/inventory?sku=123&cb=928374
/api/inventory?sku=123&cb=938274
/api/inventory?sku=123&cb=348927
Each randomized parameter produces a cache miss, causing requests to hit the origin server. This is cache busting, and it can overload the origin server regardless of whether the intent is malicious or not.
At scale, the effects compound. Backend services absorb the full load without cache relief. If those services temporarily reserve inventory during request processing, you start seeing phantom stock issues. Customers might get "Item temporarily unavailable" messages for products that are still in stock. During high-demand events like limited releases or flash sales, that translates directly to lost revenue.
The distribution of load matters, too. Automated traffic often concentrates on specific infrastructure such as a particular origin host or a specific CDN edge location. That creates uneven load that's hard to spot when teams only have access to generalized CDN dashboards that include aggregated metrics.
By the time the impact shows up in conversion rates or abandoned carts, you've already taken the hit. And origin logs alone don’t reveal the issue—you also need CDN logs.
Why CDN logs matter for bot detection
Application logs tell you which requests reached your services. They don't tell you whether a request was served from cache, which edge location handled it, or whether the client was a headless browser.
At the network edge, threats like malicious bots, credential stuffing, and layer 7 DDoS attacks all leave traces in CDN logs that never appear in application logs. Edge telemetry typically includes client IP and user agent, the full request path and query string, cache hit/miss status, edge POP, and response timing broken down by origin TTFB, along with other critical security and performance information.
Hydrolix is built to store and query high-volume telemetry at scale without forcing a tradeoff between retention and cost. Organizations routinely ingest terabytes of CDN logs per day, and most analytics platforms either downsample that data or make long-term retention prohibitively expensive. Hydrolix allows you to keep it all, at full fidelity, for months or years, at a fraction of what other platforms charge.
But CDN logs only tell a portion of the story. When the cache hit rate drops, the why lives in application logs. Cribl Lake gives you a vendor-neutral, cost-efficient place to land that data, ready for investigation without the ingestion tax of a traditional system of analysis. From there, Cribl Search lets you pivot directly from a Hydrolix query showing an origin traffic spike to a correlated search across your app logs, catching the bad deploy, the misconfigured cache-control header or in this specific case, the randomized cb= parameters causing the cache-miss.
In this scenario, an analyst will use Cribl Search Notebooks across Hydrolix and Cribl Lake to document the full investigation with queries, results and visualizations in a single sharable artifact.
The scenario
Imagine an e-commerce platform in the middle of a major promotion. Monitoring starts firing: API latency is up, HTTP 429s are appearing, and your CDN dashboard shows cache dropping and high request rate on the inventory endpoint. Meanwhile, the support queue is growing. Origin logs show the inventory service under load, but they don't explain why.
This scenario uses Cribl Datagen to generate application server logs that are stored in Cribl Lake. It also includes simulated CDN requests with random legitimate and bad bot requests which are stored in Hydrolix. While the data is synthetic, this is a realistic scenario for teams dealing with bot traffic.
Application logs from the inventory service look like this:
{
  "clientIp": "198.51.100.25",
  "endpoint": "/api/inventory",
  "latencyMs": 42,
  "status": 200
}
Meanwhile, CDN logs in Hydrolix capture client_asn, client_ip, user_agent, request_path, request_query_string, cache_status, edge_pop, response_time_to_first_byte_ms, origin_time_to_first_byte_ms, and many other relevant key data points.
Running the investigation
Step 1: Which endpoints are impacted?
Start with origin logs. Which endpoints are receiving the most traffic? The following query provides that information.
dataset="hydrolix_cribl_ecom_demo"
| summarize requests=count(), avgLatency=avg(latencyMs) by endpoint
| order by requests desc
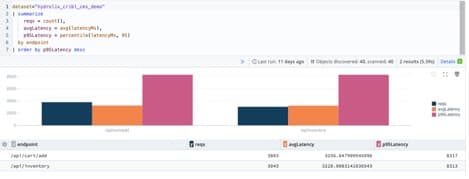
In the previous screenshot, the inventory and add to cart endpoints stand out immediately. Next, let’s see who is sending those requests:
dataset="hydrolix_cribl_ecom_demo"
| summarize cnt=count() by clientIp
| order by cnt desc
| limit 10
A small set of IPs accounts for a disproportionate share of the traffic, which is hard to explain with normal user behavior.
Step 2: Querying Edge logs
To check whether this traffic is hitting origin directly or getting partially absorbed by cache, the next step is to query the CDN logs in Hydrolix. Cribl forwards SQL to Hydrolix via URL-encoded query strings. Here’s the query:
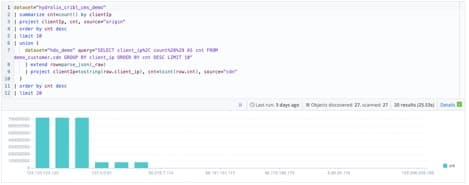
dataset="hdx_demo"
query="SELECT client_ip%2C count%28%29 AS cnt FROM demo_customer.cdn GROUP BY client_ip ORDER BY cnt DESC LIMIT 10"
| mv-expand row=data
| project clientIp=tostring(row.client_ip), cnt=toint(row.cnt), source="cdn"
| order by cnt desc
Hydrolix returns results in a JSON envelope, with the actual rows stored in a data array. The mv-expand operator extracts those rows for analysis.
Common encodings to keep in mind when building queries:
Step 3: Correlate both datasets
Cribl Search's union operator lets you merge results from both sources into a single query:
dataset="hydrolix_cribl_cms_demo"
| summarize cnt=count() by clientIp
| project clientIp, cnt, source="origin"
| order by cnt desc
| limit 10
| union (
   dataset="hdx_demo" query="SELECT client_ip%2C count%28%29 AS cnt FROM demo_customer.cdn GROUP BY client_ip ORDER BY cnt DESC LIMIT 10"
   | extend row=parse_json(_raw)
   | project clientIp=tostring(row.client_ip), cnt=toint(row.cnt), source="cdn"
 )
| order by cnt desc
| limit 20
If an IP shows high counts in both datasets, it's a strong signal of a bot using randomized cache busting.
Next, in the CDN logs we can see the number of requests by adding to the dashboard a query to look for the request with cache bust in the query string.
SELECT
   toStartOfInterval(timestamp, INTERVAL 1 MINUTE) as time,
   request_path as Endpoint,
   count() AS "Bot Request Count",
   uniqExact(extract(request_query_string, 'cb=([^&]+)')) AS "Unique Bots (cb)"
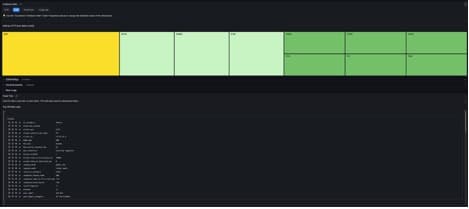
Step 4: Confirm cache busting
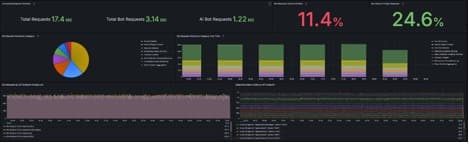
A closer look at these requests in edge logs show requests to /api/inventory with randomized cb= parameters and a cache hit rate near zero. Every request is reaching the origin. In production, this shows up as persistently high `origin_time_to_first_byte_ms` values for those clients, and potentially unusual edge POP concentration if the traffic is geographically clustered. The next screenshot shows the Bot Insights dashboard in Hydrolix, which includes two panels. The dashboard shows requests by bots with unique cache busting codes in the query string, and it also shows that there’s a high volume of 429 "Too Many Requests" errors.
Faster correlation with Cribl Search and Hydrolix
Application logs rarely tell the full story, especially when it comes to bot traffic. The answers to many questions are in edge logs. That includes information on what's hitting cache, which edge locations are absorbing load, and whether a request pattern suggests automation. Getting to the root cause requires looking at both layers together.
For teams that have data stored in both Cribl and Hydrolix, this investigation would take much longer without data federation. You’d need to query origin logs, note the suspicious IPs, open the CDN analytics console, run the same search, export to a spreadsheet, and try to reconcile timestamps. During an active incident, that process can stretch for hours.
Cribl Search allows federated queries to run across both datasets from one search interface, considerably cutting down investigation time. There’s no need to export data or context-switch. You can start making correlations across data sets in just a few queries.
The final step is getting findings out of the Notebook and into the hands of the people who need them. Cribl CoPilot summarizes the investigation automatically, turning a sequence of queries and results into a concise narrative with no manual write up required.
Hydrolix is a real-time data platform that provides operational intelligence at massive scale. It includes long-term, full-fidelity retention at a fraction of the cost of legacy solutions, with all data remaining hot for queries regardless of age.