
So your users are “working remotely.” Translation: they’re on coffee-shop Wi‑Fi, clicking links with the confidence of someone who has never met a phish, while Zscaler quietly turns every click into rich security telemetry. All that Zero Trust goodness generates a firehose of logs, but they only help you if you can actually find them, parse them, and avoid scrolling until your eyes vibrate. When you use Cribl’s Search Pack, you get dashboards tuned to how Zscaler actually talks, so you can see patterns in the chaos instead of living in raw logs.
Good news: those logs are useful. Bad news: they’re only useful if you can find them, parse them, and not lose your mind scrolling logs until your eyes vibrate.
The Cribl Search Pack for Zscaler is a Search-side companion to the Cribl Stream Zscaler Pack. Install it, point it at your NSS-style Zscaler dataset, and you get dashboards tuned to how Zscaler actually talks: web, firewall, CASB, audit, VPN/tunnel, DNS, and email DLP.
This blog walks through what the dashboards are for and how to wire everything up so the logs stop feeling so overwhelming and start being pretty pictures with identifiable patterns.
What this pack does (in plain English)
Macros bake in the dataset and sourcetype filters so adjusting the searches to fit your environment is done on a single page.
Datatypes help Search pull structured fields out of the events.
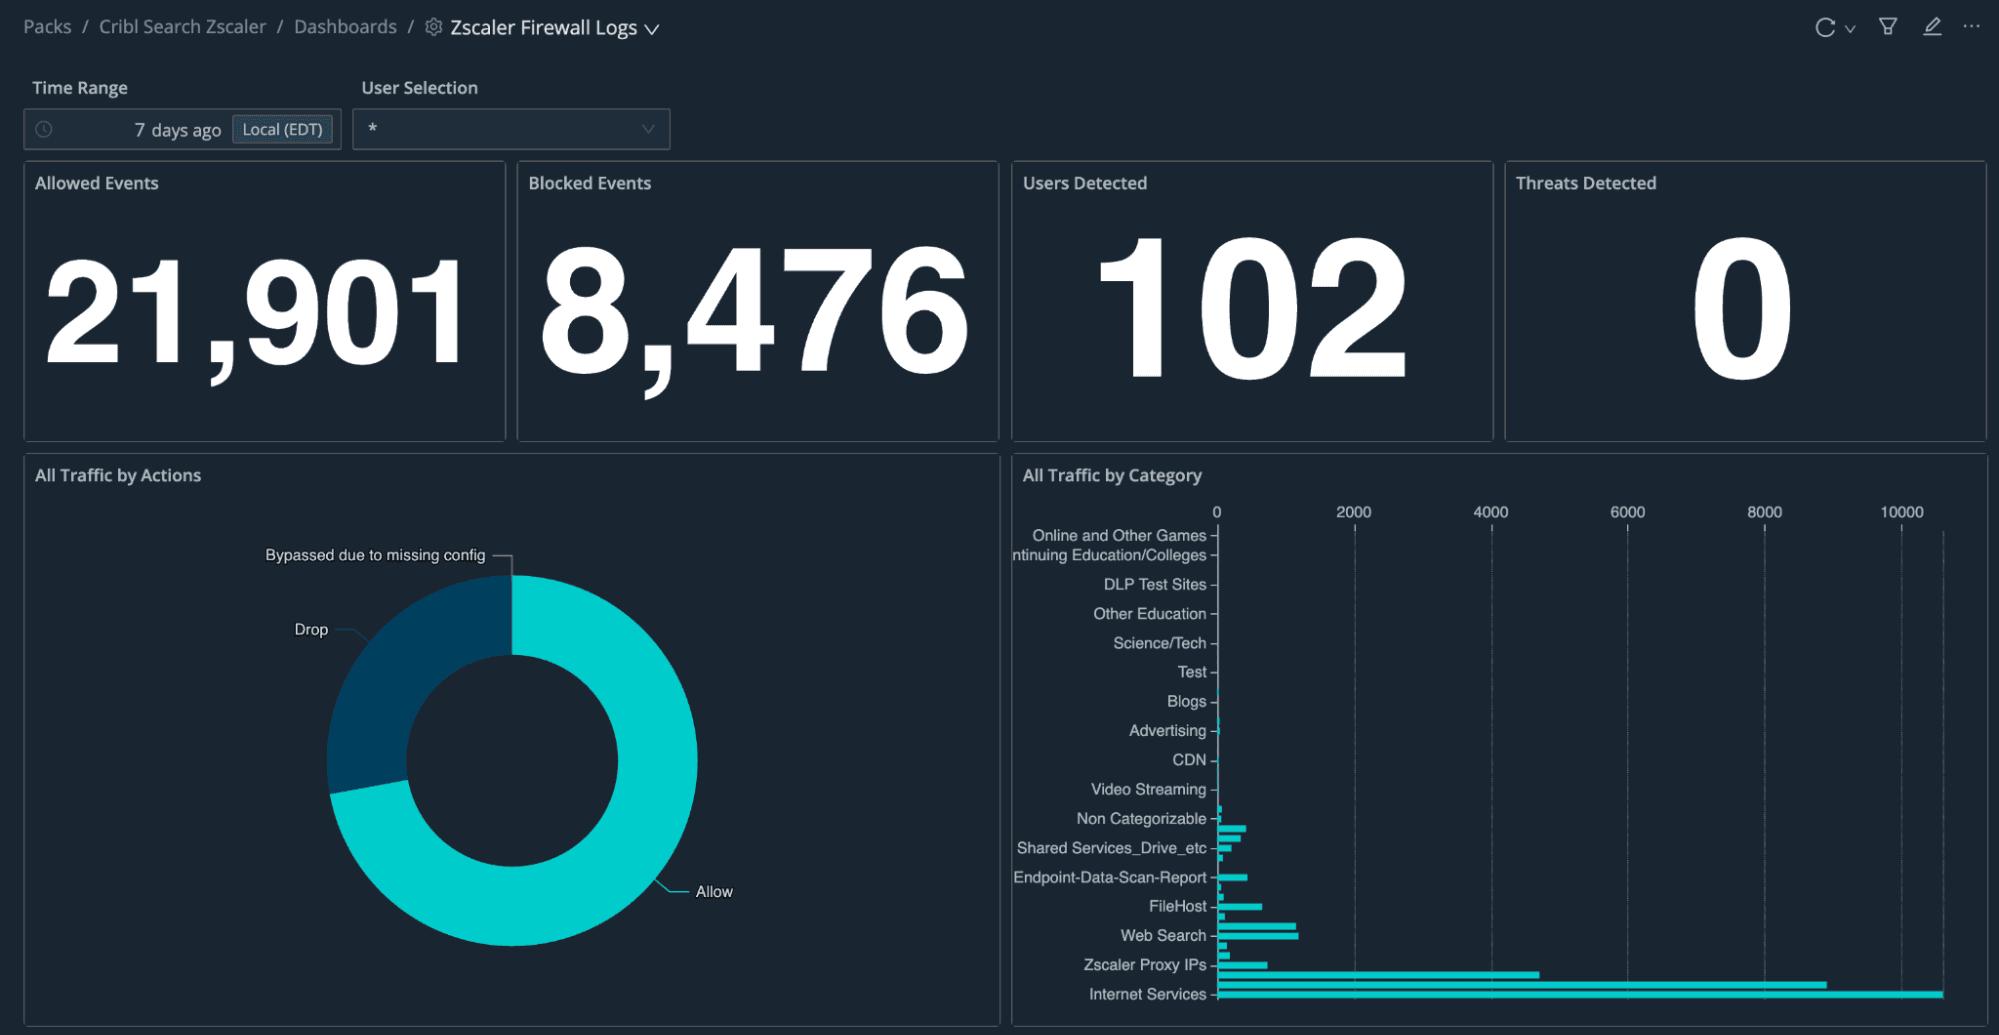
Dashboards: one dashboard per Zscaler log family, so investigators can land on the right lens instead of one mega-dashboard that tries to be everything.
Setting up the pack
These steps parallel what’s in the pack README; treat that README as the canonical checklist when anything disagrees with a blog statement.
1. Get Zscaler logs into something Search can read
Use Cribl Stream (with the Zscaler Stream Pack) or your existing pipeline to land NSS logs in Cribl Lake, Lakehouse, or another object-store-backed dataset Search can query; same general playbook as other Search Packs: collect, normalize, land, search.
2. Create (or confirm) your dataset
The Pack assumes a dataset named zscalernss. You can name it whatever you want, but make sure you update the macro if you do! Partitioning matters: sourcetype is specified as a partition field for performance and filtering. Always check your partitioning schemes if you’re having performance issues!
3. Install the Search Pack and verify macros
Install from the Packs Dispensary (https://packs.cribl.io/packs/cribl-search-zscaler).
Then open Macros and confirm:
Dataset name matches what you created (zscalernss by default).
Each macro’s sourcetype matches your dataset configuration. Defaults in the Pack look like:
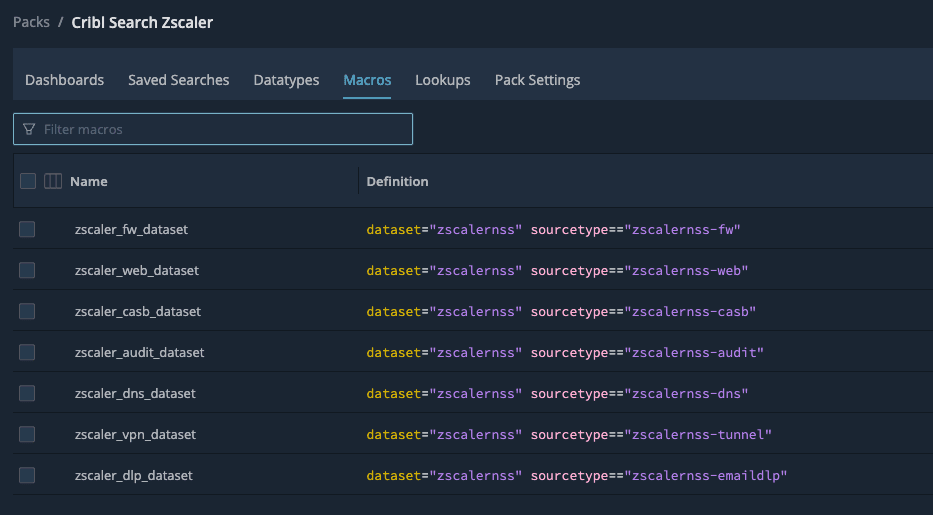
If your sourcetypes use a different pattern, edit the macros to fit your needs.Your dashboards won’t be very helpful if they aren’t pointing at the right data.
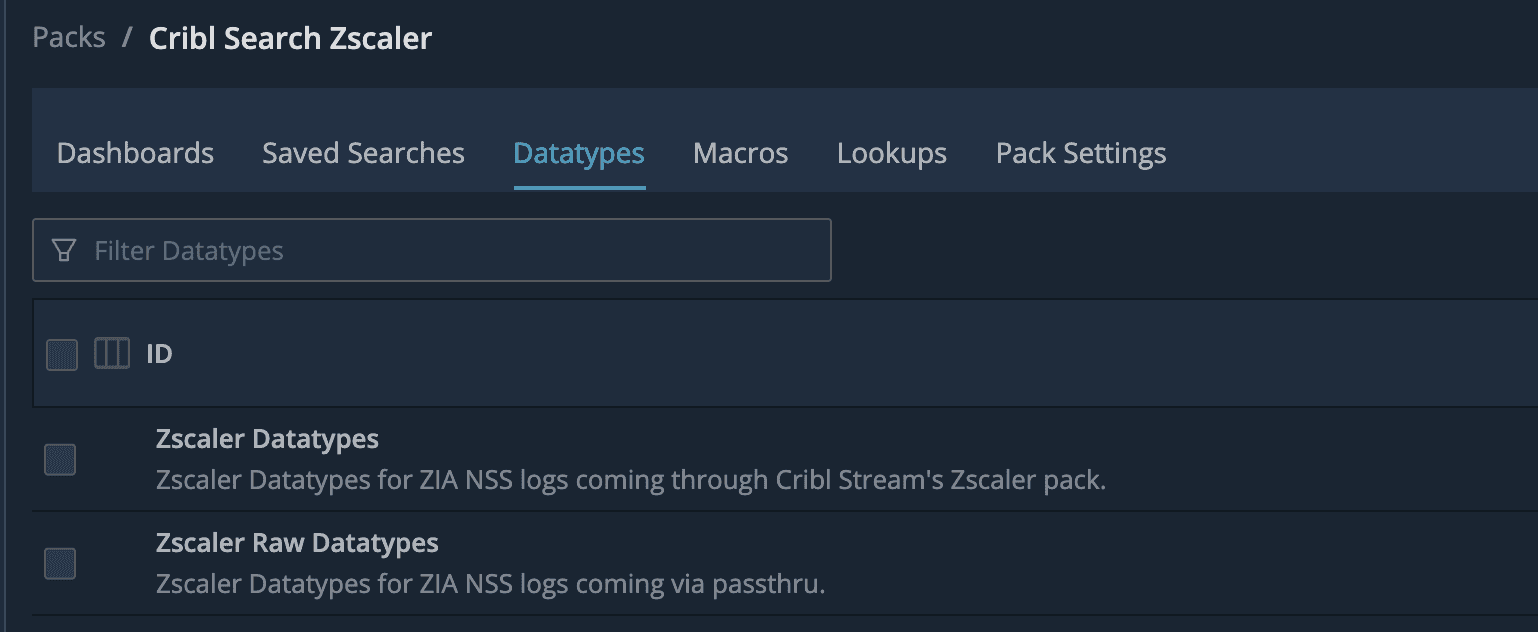
4. Apply the Pack’s datatype rules
On the zscalernss dataset, ensure that the correct datatype from the Pack is applied. If you are using the Zscaler Pack for Cribl Stream, use the Zscaler Datatypes dataset. If you are using passthru pipelines or simply have the default zscalernss logs, ensure you use the Zscaler Raw Datatypes dataset, instead. The only difference here is parsing. Remember, datatypes are applied at search time, so if you get it wrong the first time, that’s okay!
5. Dig into the Pack!
What the dashboards are for
You don’t get one tortured general-purpose screen; you get focused dashboards per log type:
Summary
Grab a free Cribl.Cloud account if you need a place to try Search, install this Pack, and point it at your Zscaler dataset. Then adjust macros once, confirm datatype rules, and let the dashboards do the rude thing telemetry does best: make patterns obvious.