

When exploring data, comparing individual data points with overall statistics for a large data set is often useful. For example, you might be interested in understanding when a performance metric rises above the historical average. Or possibly knowing when the variance of that metric increases past a certain threshold. Or maybe noting a change in the distinct number of IP addresses connecting to your public web portal. While the existing aggregation operators (summarize and timestats) in Cribl Search can generate both overall and time-series aggregates, they fall short when asked to compare individual event data with those overall aggregates. That’s where the new operator “eventstats” comes into play.
Eventstats is used to generate that group aggregate but then fuse it to the individual events so individual data points can be compared with the group aggregate.
You can think about it as if Search were going through your data twice: once to generate the group aggregate over your dataset, then a second time where that group aggregate exists in each event (even though it may represent a conclusion that requires data subsequent to the current event).
Simple Implementation and Examples
eventstats syntax is identical to summarize. You specify one or more aggregation operators in your pipeline (with optional renaming) and zero or more fields to summarize.
These summary statistics are computed over the entire dataset and added to each event. Please note that the summary statistics will be identical in every event.
So, for example, if we were to use the dataset cribl_search_sample, we could generate a group average using eventstats like this:
dataset="cribl_search_sample" dataSource=access_common | limit 1000 | eventstats groupAvg=avg(bytes)This operator creates an identical field in every event called groupAvg.

Now that this computed element exists in every event, we can use the value as the target of a comparison with the original data In the event, in this case, using a where operator:
dataset="cribl_search_sample" dataSource=access_common | limit 1000 | eventstats groupAvg=avg(bytes) | where bytes > groupAvgThis new Search returns events for which bytes are greater than the average within the Search boundaries. Unsurprisingly, when we run it this way with a limit, we get about half the number of results (around 500) since we would expect about half the events to be larger than the average and half to be smaller than it (for a field with uniform distribution).
We can create an additional metric using the standard deviation aggregate function (stddev) and use it to find outliers in this field value. Generally, 2 or 3 standard deviations away from the mean are considered outliers. The number of standard deviations is commonly known as the Z-Score. We can create a field to use as a variable and tune an analytic to try different values of the Z-Score to find what threshold works best for your dataset.
Note: In our sample data, however, setting the Z-Score to 2 or greater doesn’t find any anomalies, so we will use 1 as our experimental Z-Score.
dataset="cribl_search_sample" dataSource=access_common | limit 1000 | eventstats groupAvg=avg(bytes), groupStdev=stdevp(bytes) | extend z_score=1 | where bytes > groupAvg + z_score * groupStdevThis analytic finds about a quarter of the events, based on a Z-Score of 1. Again, in a real-life scenario, you would generally set your Z-Score value to either 2 or 3, possibly as high as 4.

Using Eventstats and Summarize to Calculate Percentage of the Whole
It’s quite common to want to see what fraction or percentage a given subset may be of the while set. We most often see this visually in pie/donut charts, but it can be calculated using eventstats in conjunction with summarize. Summarize will aggregate the data by a specific field (in this case, count by host), then the eventstats will allow you to compute the total number of hosts in the set and divide by that number.
dataset="cribl_search_sample" dataSource=access_common | limit 1000 | summarize hostCount=count() by host | eventstats totalHosts=sum(hostCount) | extend percent=(hostCount/totalHosts)*100 | project-away totalHosts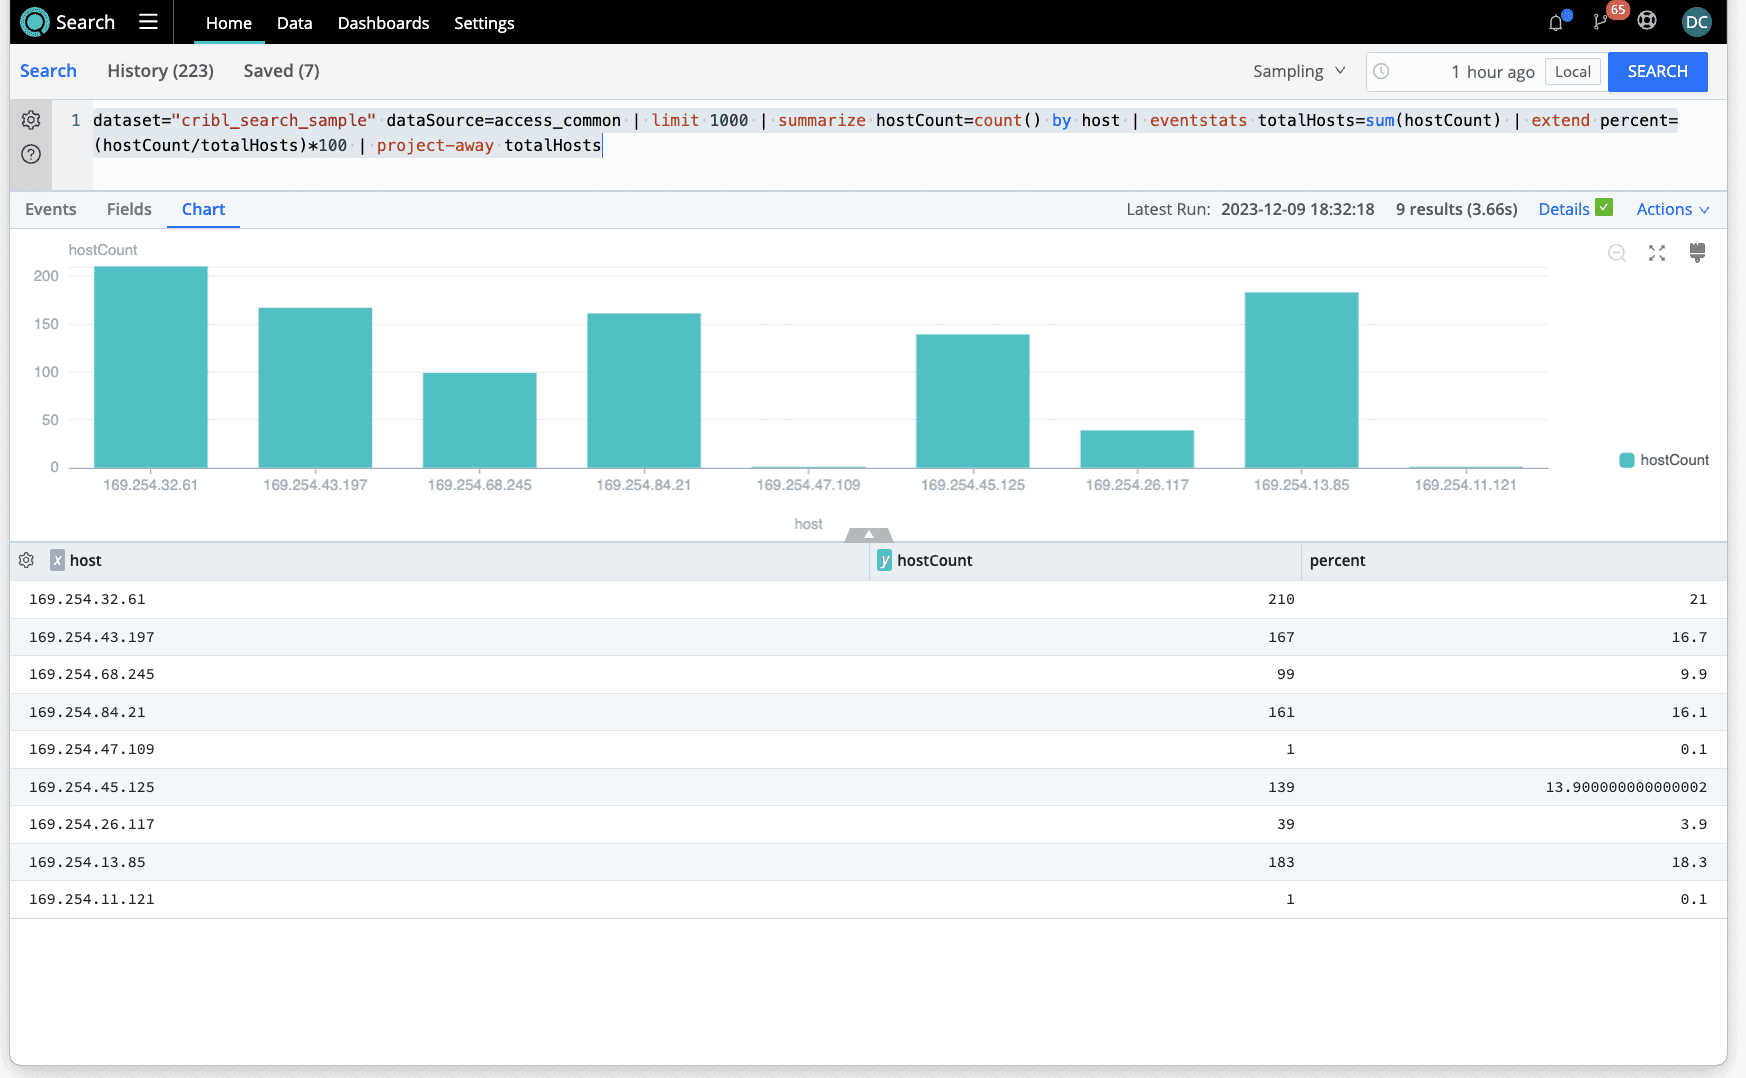
Adding a Group-by clause for Different sets of Statistics
Until now, we’ve created fields with eventstats that have been constant across all events. The group by clause of the eventstats operator can be used to create different sets of statistics based on the field(s) in the group, so the fields created by eventstats might be different from event to event.
Here, we can create the average bytes calculated by each server host. That might be a more helpful metric for finding anomalies since different servers may necessarily serve pages with different statistical characteristics.
dataset="cribl_search_sample" dataSource=access_common | limit 1000 | eventstats avgBytesByHost=avg(bytes) by hostHere, each event has been enriched by a field called avgBytesByHost that represents the group average of bytes served by the respective host for each event.

We can see how the avgBytesByHost field differs between the two displayed events since each represents a different host (here, webserver).
The group-by clause allows you to customize the statistics based on your dataset’s specific set of elements.
Summary and Conclusions
The eventstats operator allows you to add representative group statistics to the individual events of a dataset. This is compared and contrasted with the summarize operator, which only returns those group statistics without the original events. In general, you would use the summarize operator when you wanted aggregate statistics about your events in isolation, but use the eventstats operator when you wanted to compare each event to those overall statistics.
Both of these operators make use of the statistical functions documented here. They can be used independently or together to perform comparisons across aggregations, as shown above. If you’re ready to try it for yourself, sign up for Cribl.Cloud, and we’ll give you instant access to Cribl Search!