

This is one of a series of blog posts that explain how the Cribl SRE team builds, optimizes, and operates a robust Observability suite using Cribl’s products.
If you haven’t, we encourage you to read the previous blog about how the Cribl SRE team uses our own products to achieve scalable observability.
We installed Cribl Edge on the machines we manage for our users and use it to gather metrics. Some are from the system, some are from logs and different files, and some are from outputs of certain commands. Below are some metrics we gather to understand how the system behaves and detect any problems.
What Metrics Do We Collect?
System Metrics
We collect system metrics using Edge, it’s natively supported:
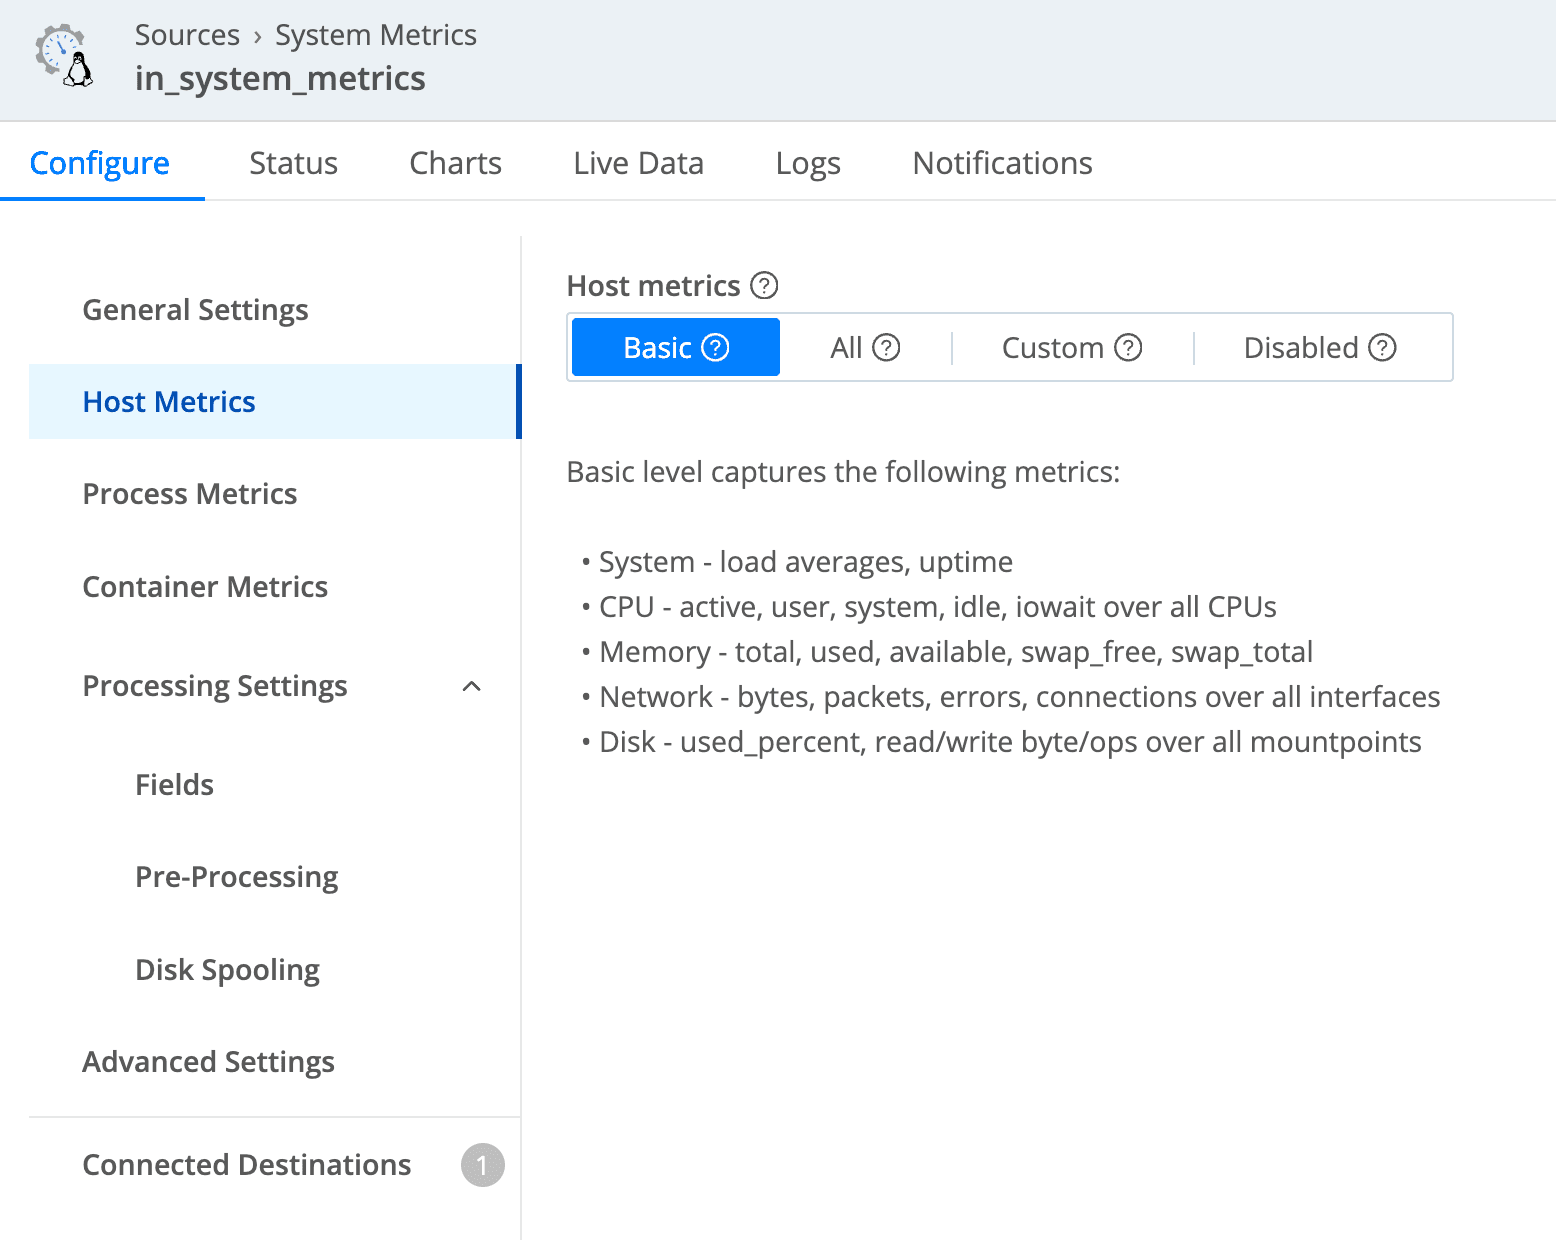
We collect the basic metrics, but with the flexibility provided by Edge, we can easily enable more extensive metrics when needed. Basic metrics contain enough information for CPU/Memory/Network/Disk/etc., such as CPU utilization, memory used percentage, etc.; for more details, see our doc on Linux System Metrics Details and Windows System Metrics Details.
Prometheus Metrics
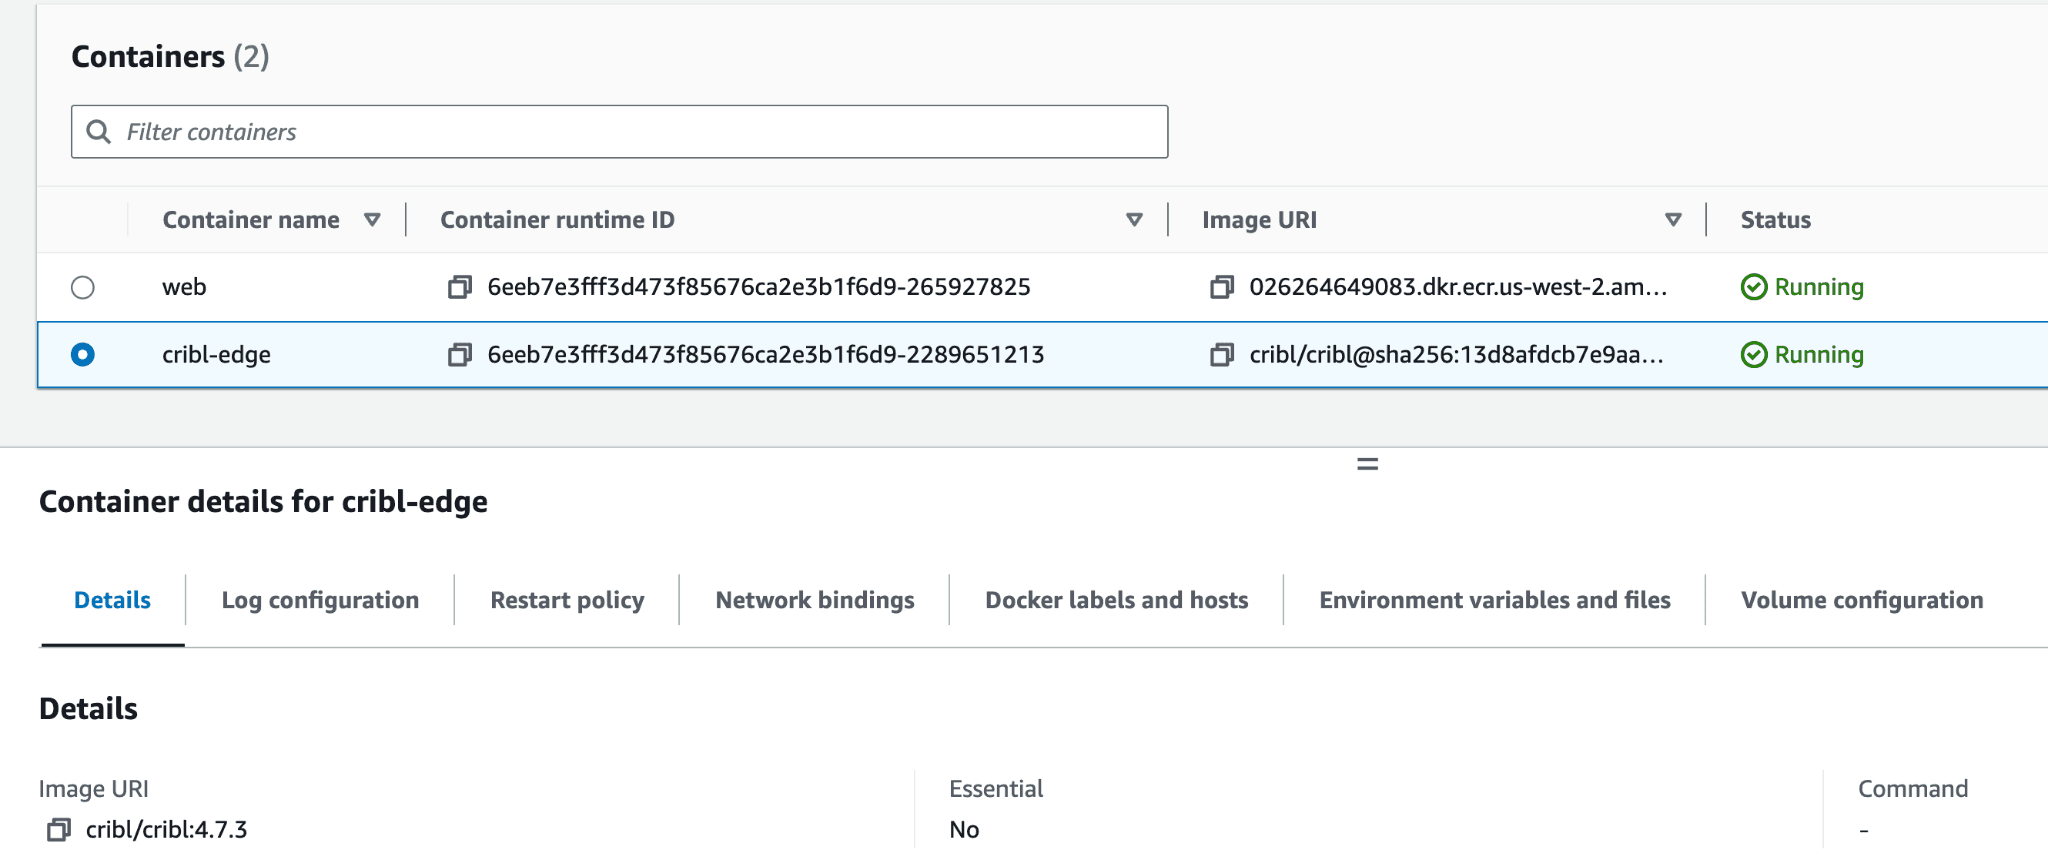
Some services expose metrics with Prometheus formats via a /metrics endpoint, and usually, these endpoints are consumed by running a Prometheus pod/container that scrapes the data. However, it’s also supported by Edge, so for our services running in AWS ECS, we are running Edge as a sidecar:
and have it to scrape the metrics for us:
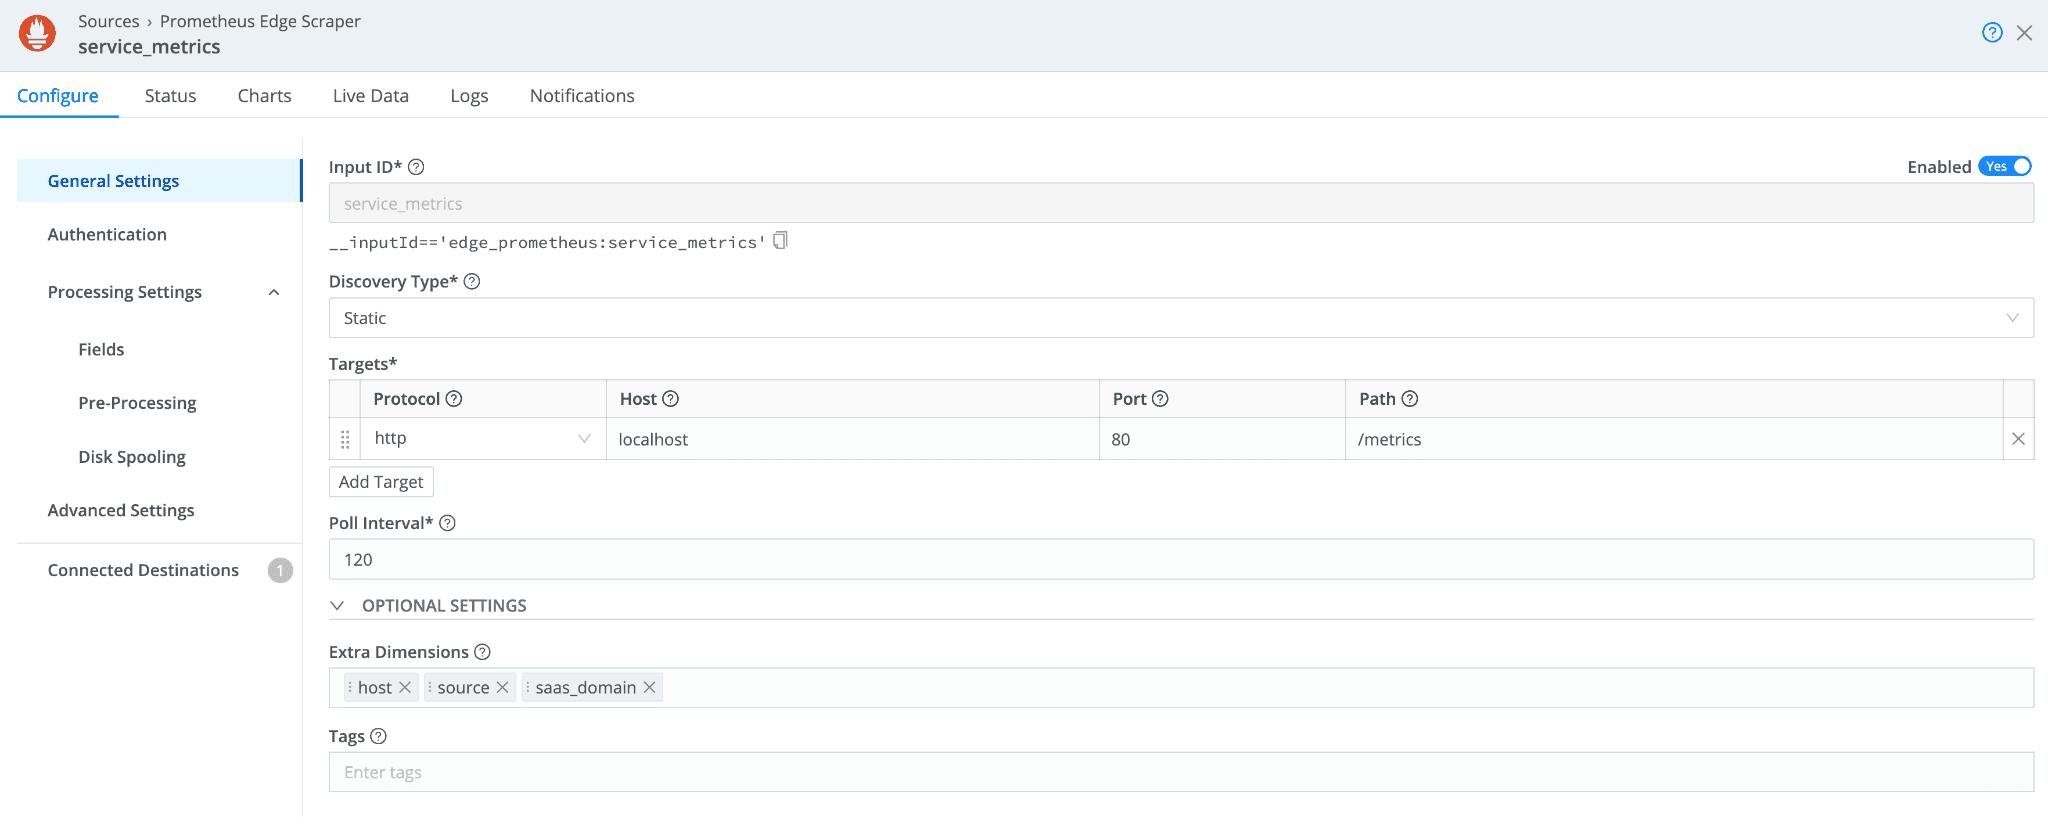
This allows us to change or reformat our desired metrics before sending them out, and knowing what metrics we need and when we need them is a great way to control the cost.
Convert Logs Files to Metrics
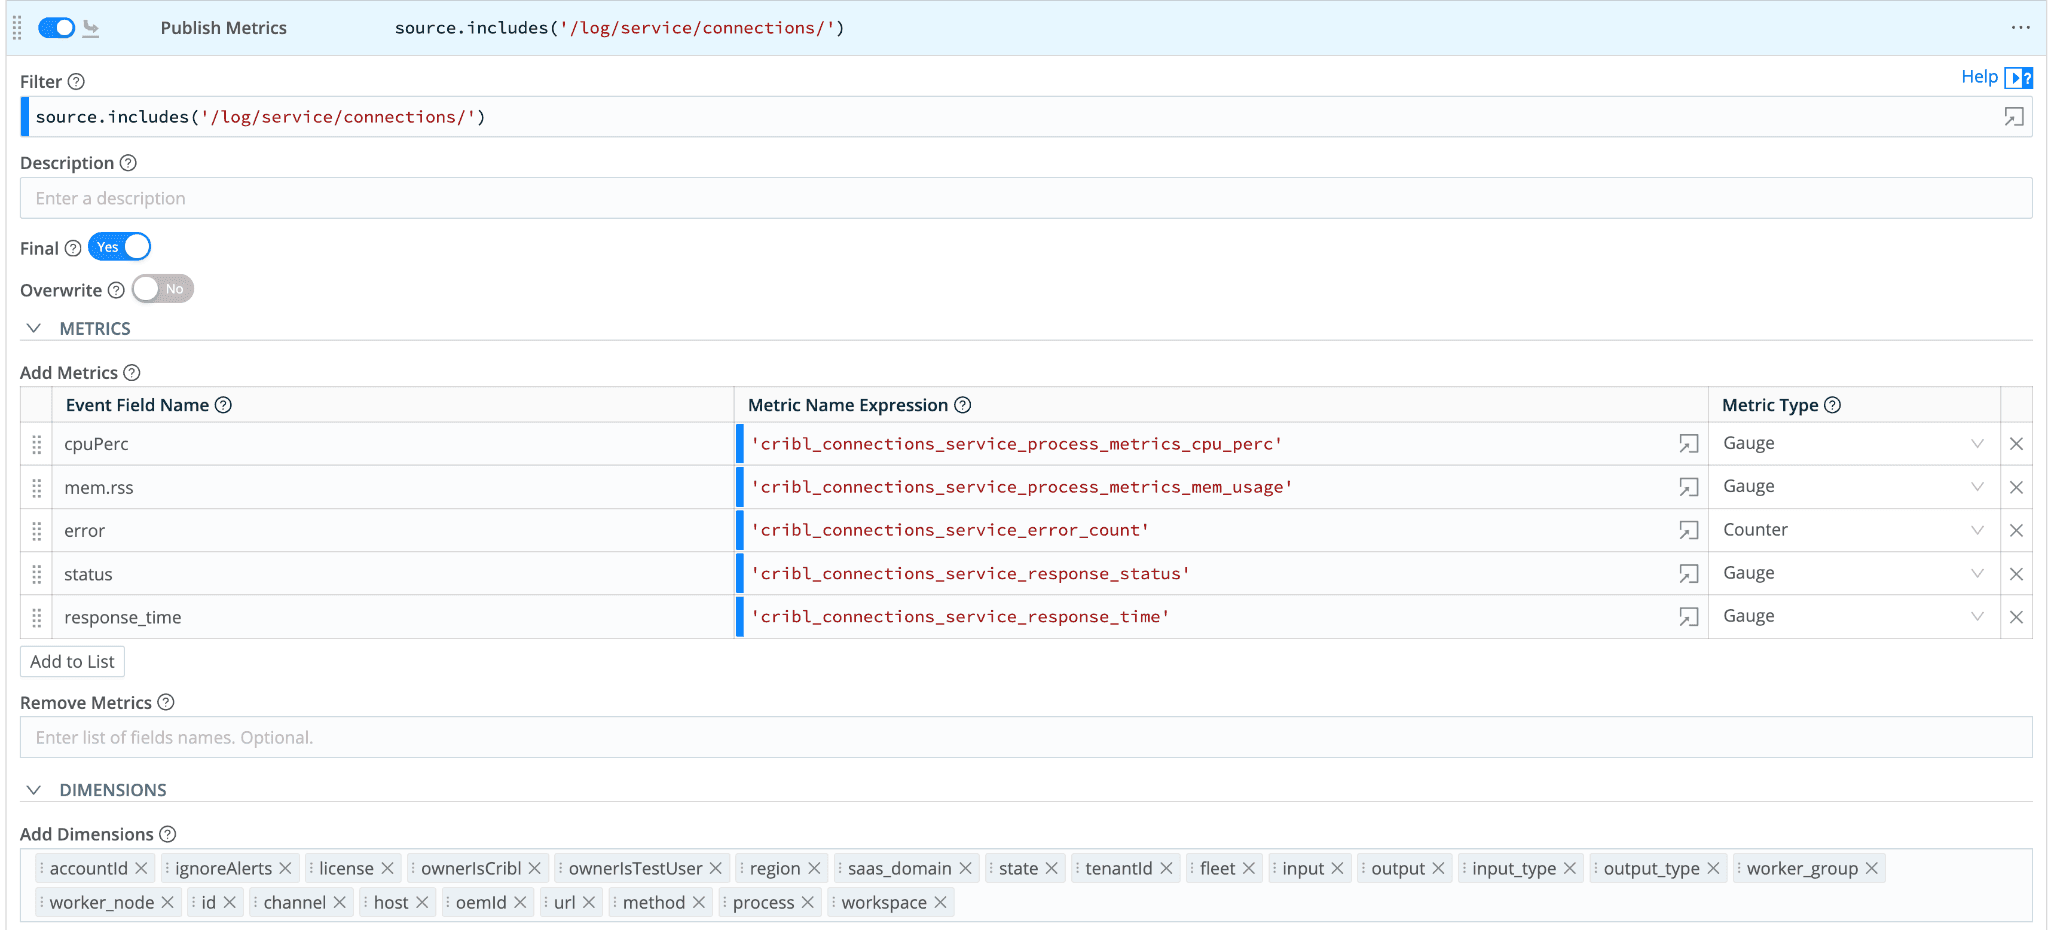
Like all other software, we expect to see logs generated by the software, and some of the logs may contain metrics like information. In this case, we leverage Edge to monitor these logs, then use Publish Metrics to convert those into metrics format and send them to Grafana.
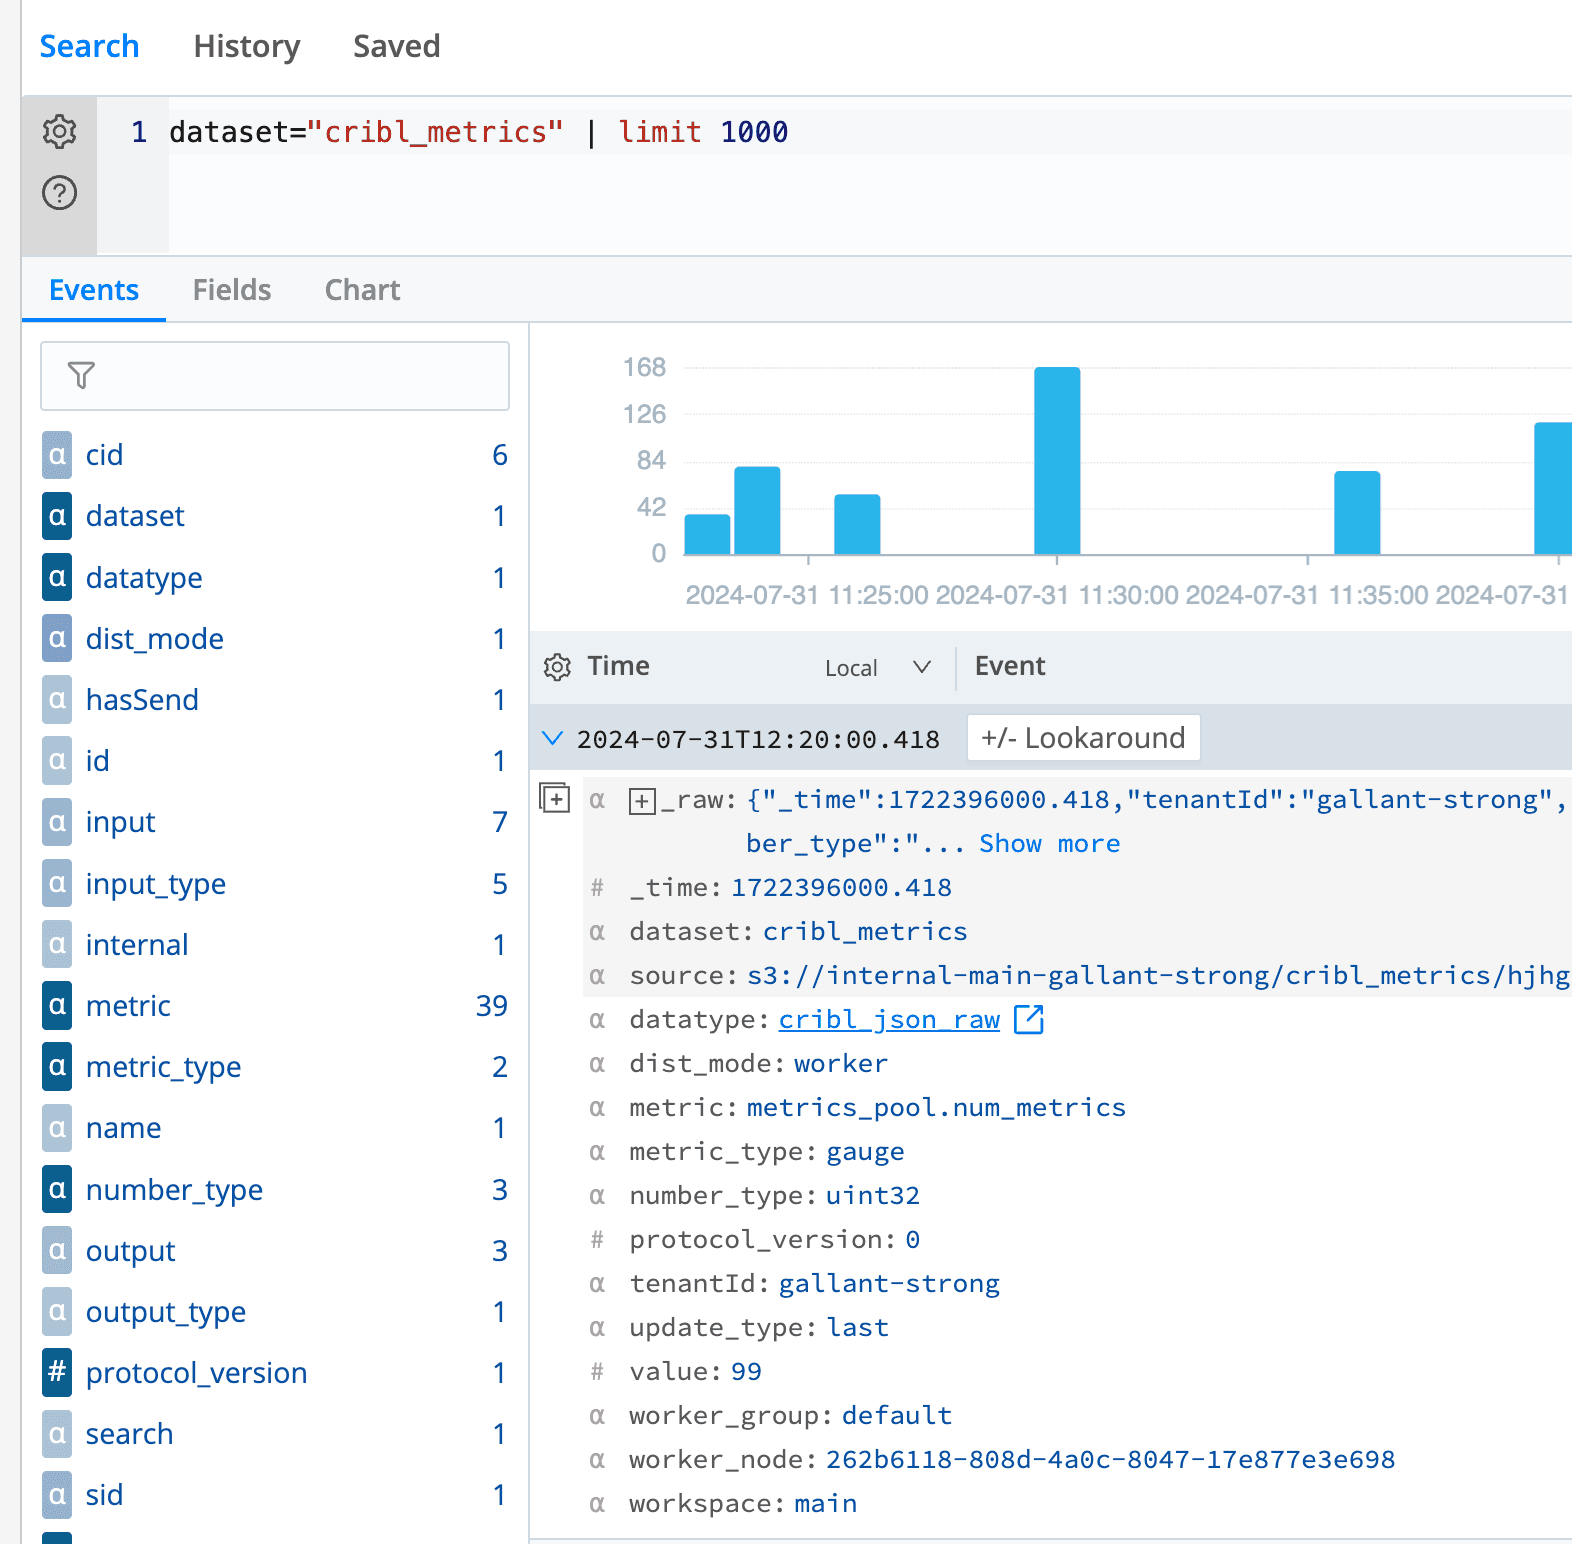
Another example is the Cribl Stream leader writes metrics periodically; we also monitor these files and convert them into metrics; not only are these available on our internal Grafana instance, but they are also available on Cribl Lake that all our users can Cribl Search for these metrics:
Convert JSON Contents to Metrics
There are also information about the system that is stored in files or can be retrieved from APIs, thus we used Edge’s Exec source to perform CLI commands to retrieve this information periodically.
For example, we periodically fetch the file content of cribl/default/ui/static/swagger/openapi.json that contains the version:

Then we publish this as a metric:
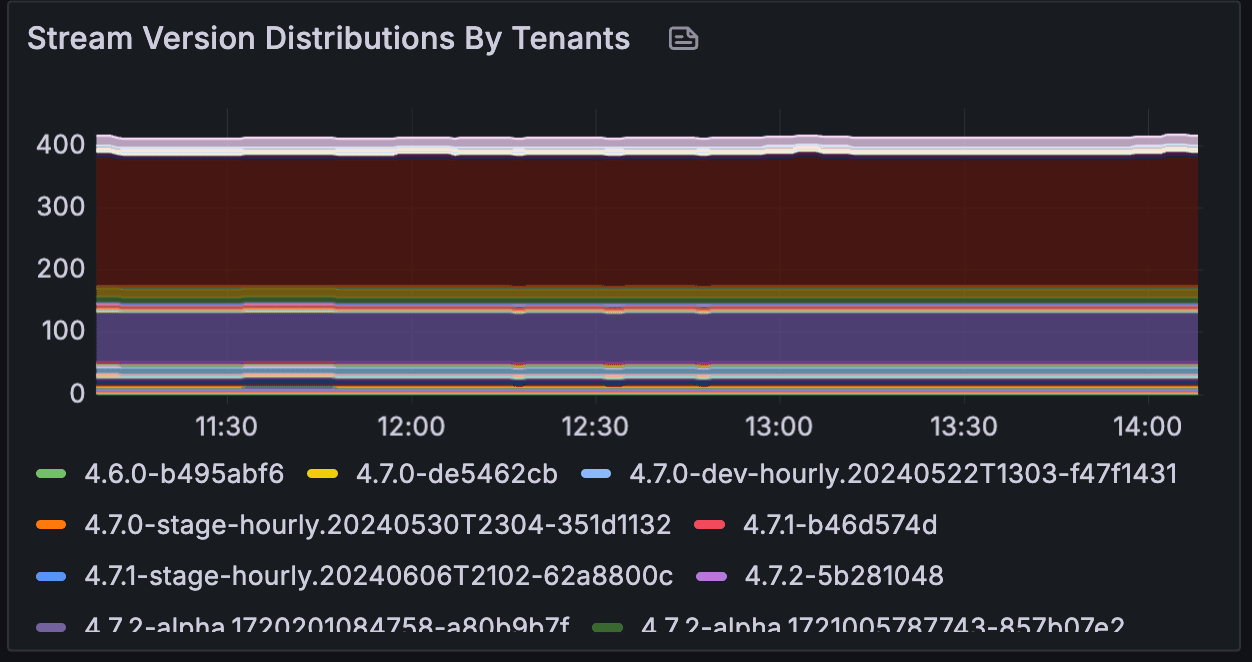
This information eventually gets displayed on our Grafana dashboard; one example is we track the versions used by all the organizations (below is our staging environment as an example):
Convert API Outputs to Metrics
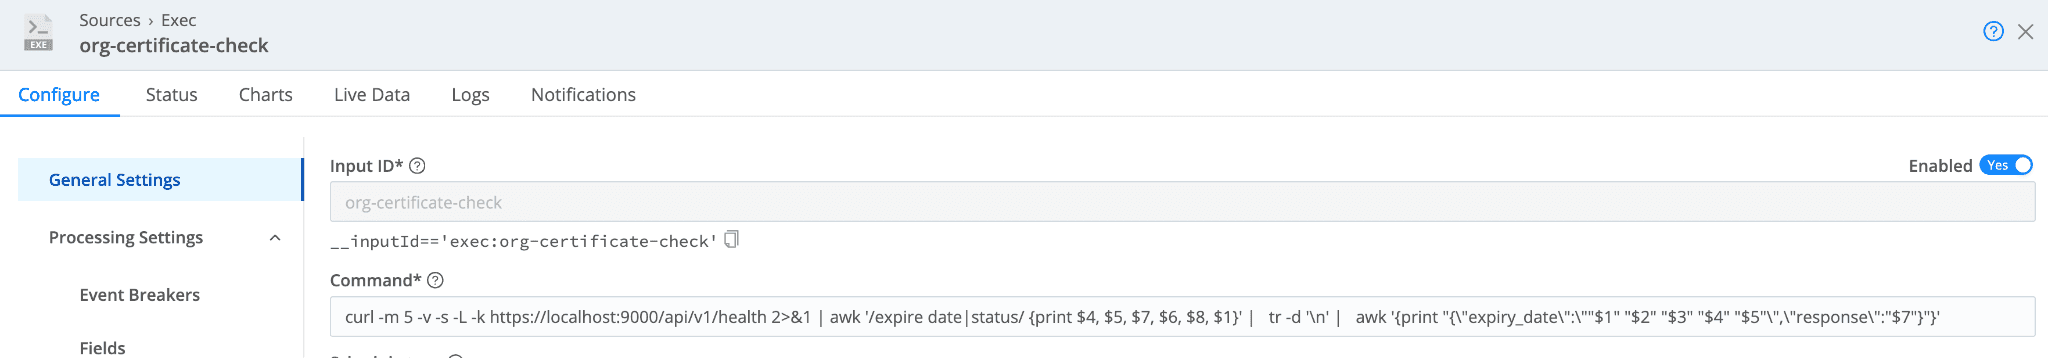
We also fetch data periodically from the system’s health endpoint because it contains the certificate information. The source looks like this:
And the outputs:
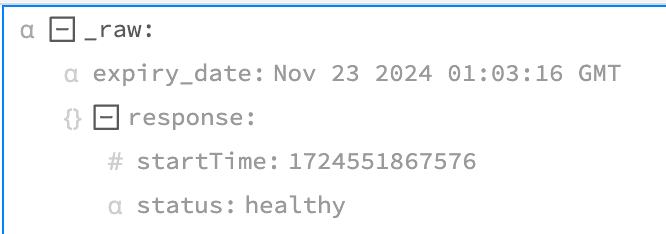
Once again, we convert the expiration date into sections before expiry into metrics:
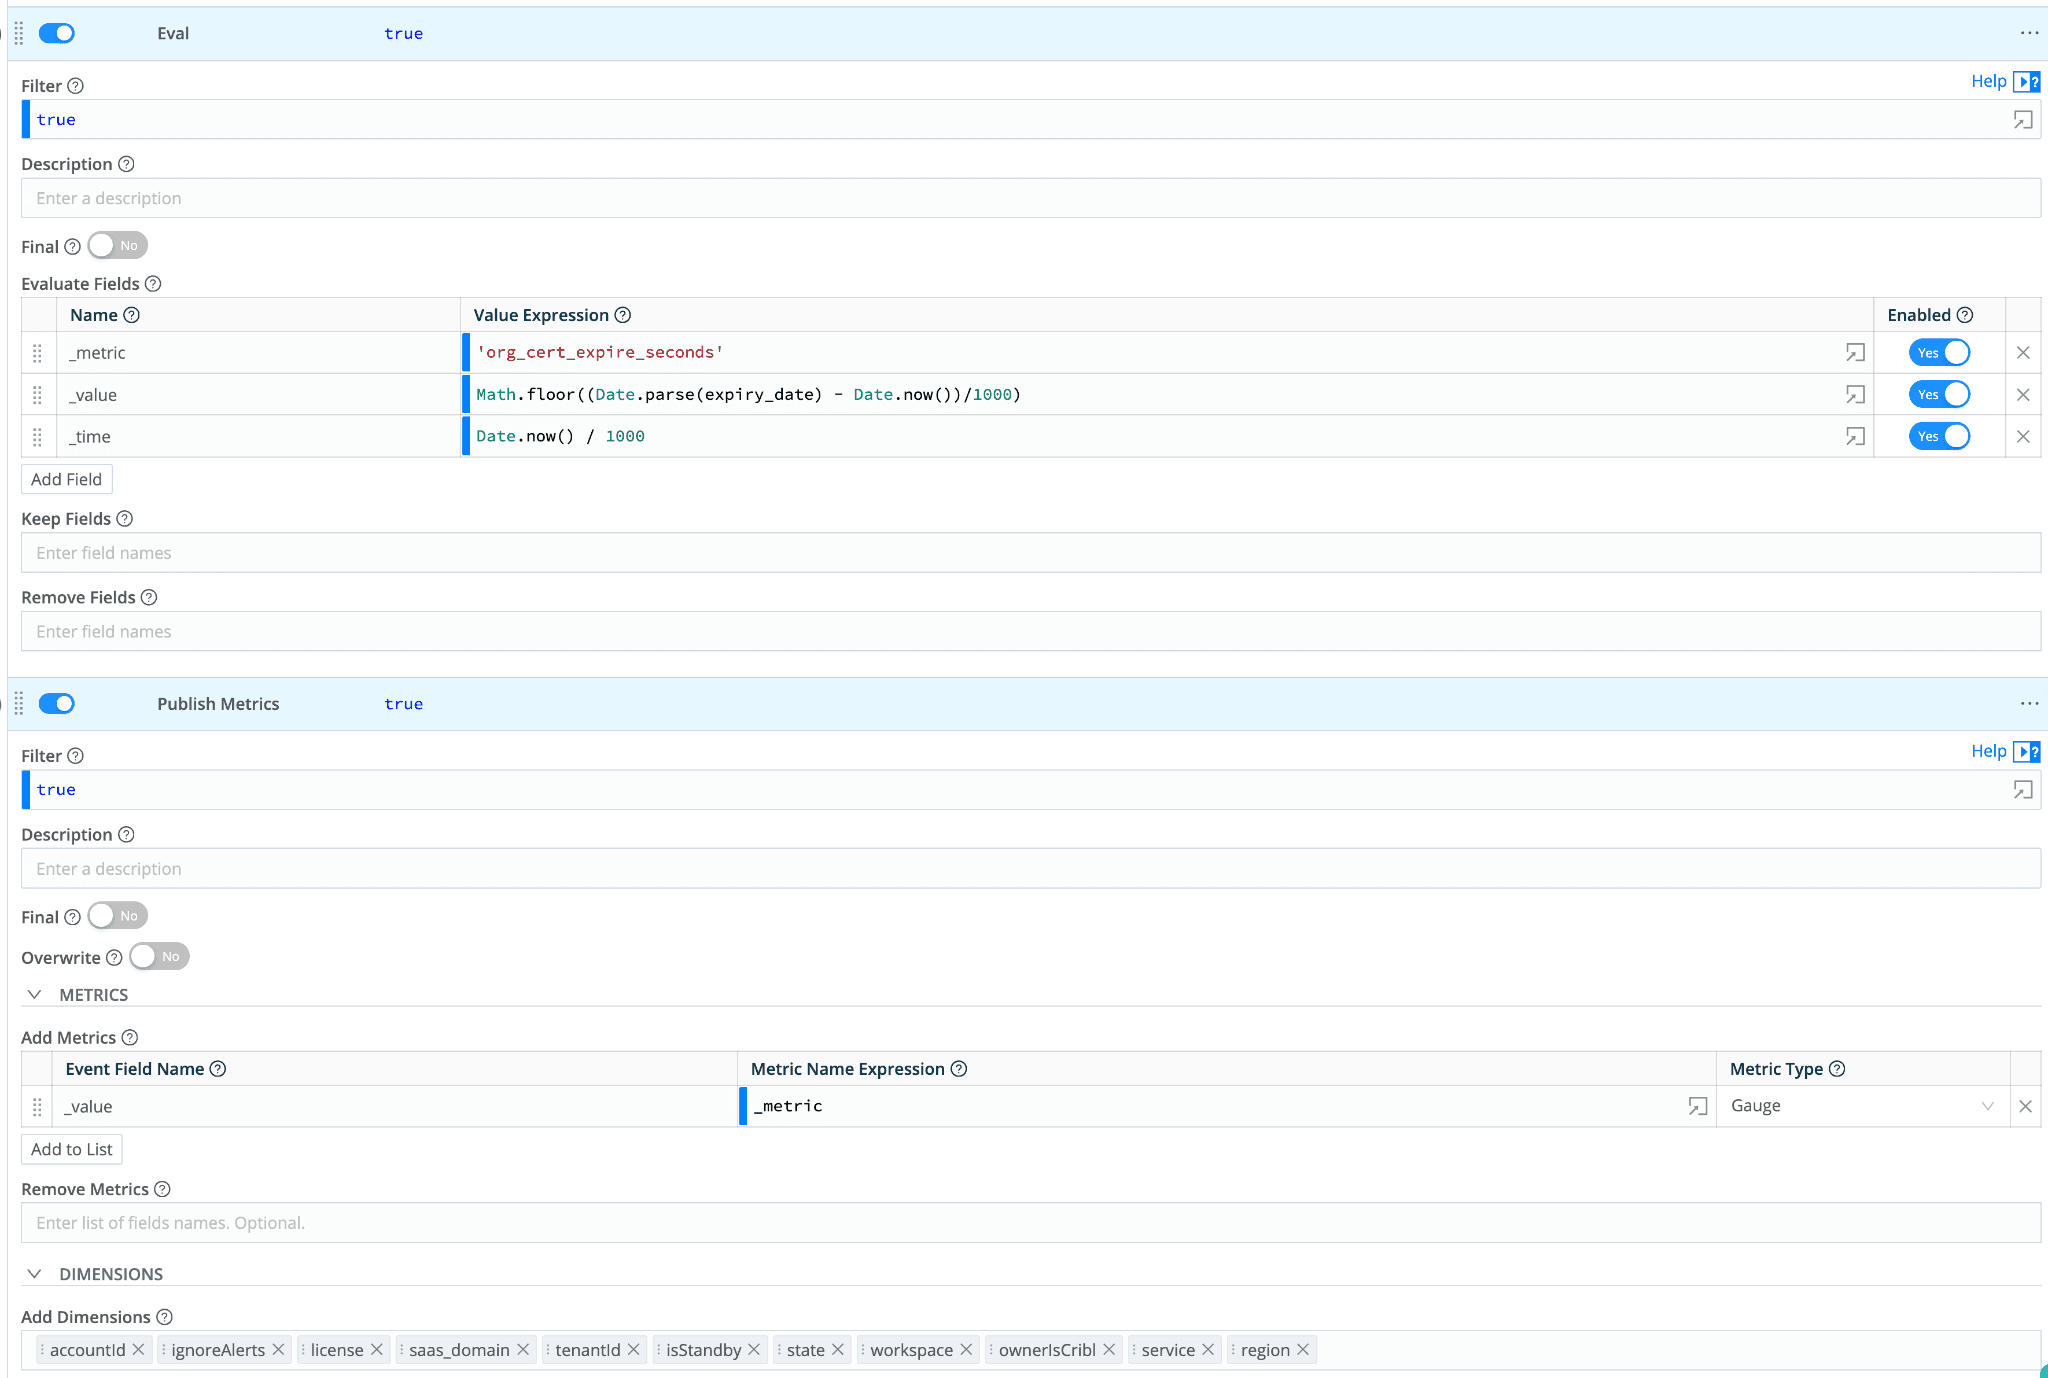
With these metrics, we can set up alerts to detect if any certificates are about to expire.
One fun fact about certificate expiration is that we learned from an incident that several organizations have expired certificates that we failed to be aware of. You might ask why the Cribl Stream can’t auto-refresh/reload the certificate simply because we are actively providing more important features to our users. So, Edge provides a quick solution to our problem and prevents this from happening.
How We Handle These Metrics
All metrics we collect will be sent to our Stream workers for “post-processing,” such as
Enriching the metrics: some information isn’t available at the source, such as the organization state. It’s only available in our services and not on the source side, so when we receive the metrics in our workers, we look at the state of the organization and enrich it as the metrics label. We can set up alerts differently based on the state with such labels. We even have a label call
ignoreAlertsthat we can manually set so we don’t get alerted when some organizations are expected to have alerts so we can focus on what alerts are real.Reformat and multiple destinations: Most of our logs/metrics don’t just have one destination, so after we receive them, we can reformat them to better fit what the destination would expect. For example, some systems can accept raw events, some systems expect to have schema, etc. We can reformat our logs/metrics before sending them out.
And to minimize the connections made to our workers, all the data we collect from the edge will use the same destination (i.e., one edge node will only open one connection to our worker):

(you can see 17 sources are using this destination)
Conclusion
We use Edge extensively to monitor our systems. The above are just a few examples of how we use Edge to collect metrics, and thanks to its flexibility, we can dynamically change/update the metrics we want to gather.
I used to run Kubernetes clusters with Prometheus exporters and some logging solutions running inside them. That solution works great until we hit walls and need to migrate/scale. The data volume is usually outgrowing the scalability of the metrics/logging solutions, so we’d end up fine-tuning what we need to expose/send, which is a pain because at that scale, there’d usually have tens of services (if not hundreds) that needs to be modified. Using Edge to collect the metrics/logs greatly eases scaling and cost problems.
Lastly, it’s also worth mentioning its maintainability since the leader deploys everything, and it’s just a matter of clicking the commit/deploy button and boom—it’s done. Of course, that requires some fleet management and designs, and from time to time, we’d need to do some experiments on new things. However, with the fast deployments, it comes with fast feedback, so we know pretty much immediately if things are working as expected.