
This is the first of a planned blog post series explaining how the Cribl SRE team builds, optimizes, and operates a robust Observability suite using Cribl’s products.
Cribl.Cloud operates on a single-tenant architecture, providing each customer with dedicated AWS accounts furnished with ready-to-use Cribl products. This provides our customers with strict data and workload isolation but presents some interesting and unique challenges for our Infrastructure and operations since embarking on the Cribl.Cloud observability journey, we have seen remarkable growth of organizations—over 1000% within two years.
This rapid expansion posed significant challenges for our Site Reliability Engineering (SRE) team. Our primary objective was to design an observability platform to efficiently monitor our cloud deployment and track Service Level Indicators (SLIs) and Service Level Objectives (SLOs). In this blog post, we delve into how the Cribl SRE team utilized our own products to build this scalable solution for our tenants.
Our Observability Stack
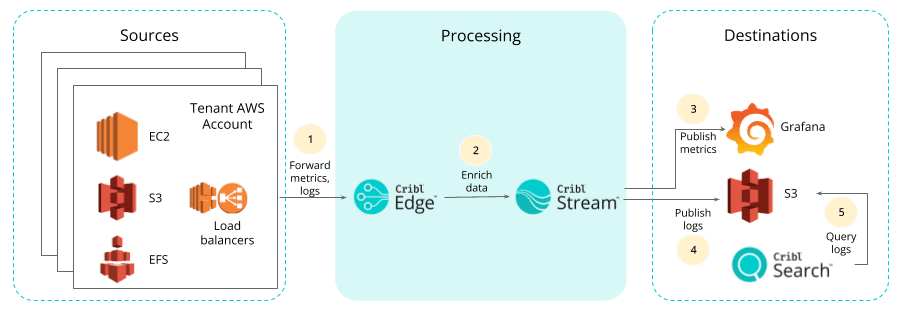
The following diagram illustrates collecting product and infrastructure metrics and logs at the edge, enriching the data through the Stream pipeline, and then directing the logs to Amazon S3 and the metric data to Grafana for publishing. These are later aggregated and queried by Cribl Search for troubleshooting purposes.
Metrics
Getting Golden Signals Using Cribl Edge & Cribl Stream
The Stream leader has a metric service, known as ”Monitoring” in the product that enables customers to monitor the performance of their worker groups, pipelines, routes, and sources/destinations. We developed a framework for gathering essential metrics (aka golden signals) to monitor the health of services. The tenant Stream leader is responsible for sending these metrics to the Prometheus endpoint exposed by a fleet node (an agent process running on the node). Upon receiving these metrics, the fleet node forwards them to Stream for data enrichment before publishing them to Grafana.
Tenant AMI: We have integrated fleet nodes into the tenant AMI and are directing it to the SRE’s Edge leader. This setup ensures that new instances connect to the appropriate fleet and that their configuration is obtained from the leader.
Edge leader: We separated the fleets based on the environment (Production or Staging) and the deployments (Stream leader or worker). Since the Stream leader exposes the service golden signals, configuring a Prometheus remote write endpoint solely in the leader fleet is sufficient.
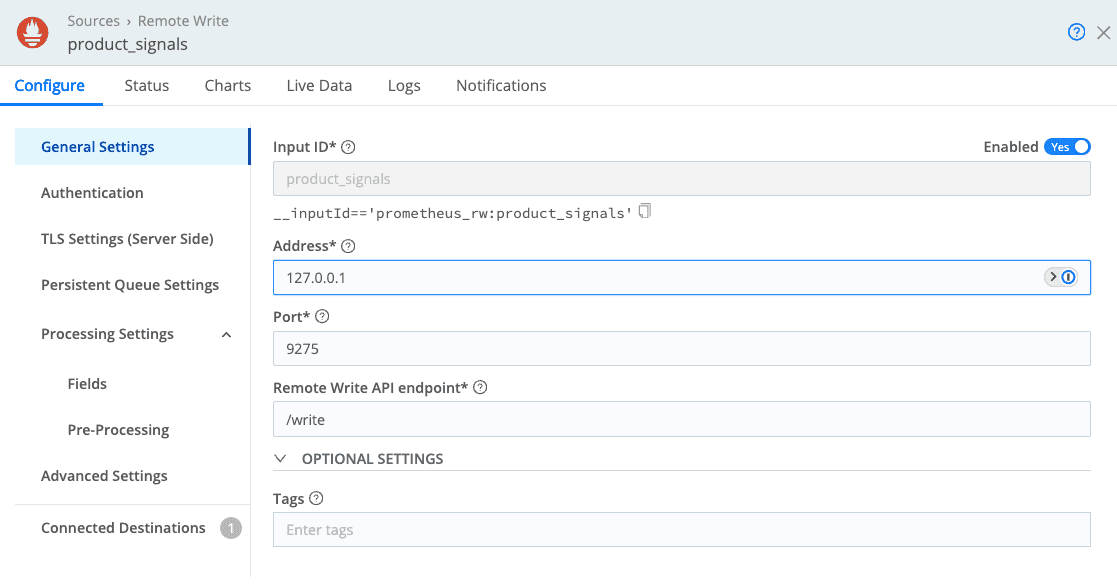
The screenshot above depicts our connection to cribl_http:stream destination, enabling metrics forwarding to Stream.
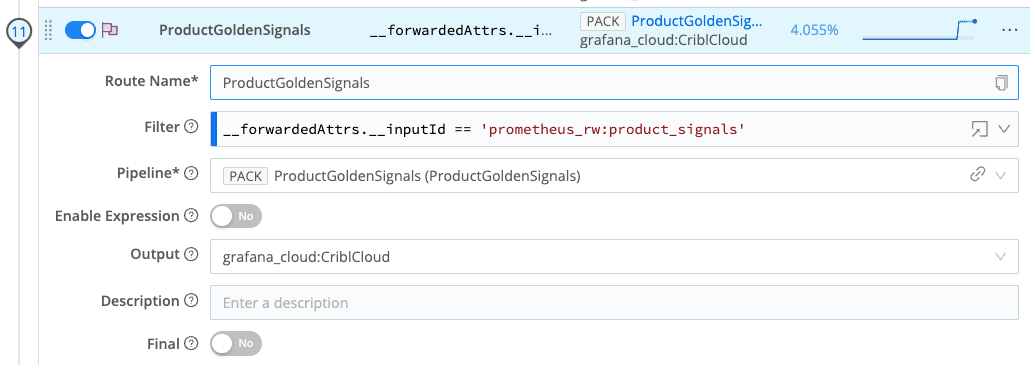
Stream: A routing configuration has been set up so that any event coming from __forwardedAttrs.__inputId == ‘prometheus_rw:product_signals’ is directed to the ProductGoldenSignals pack before being outputted to Grafana Cloud.
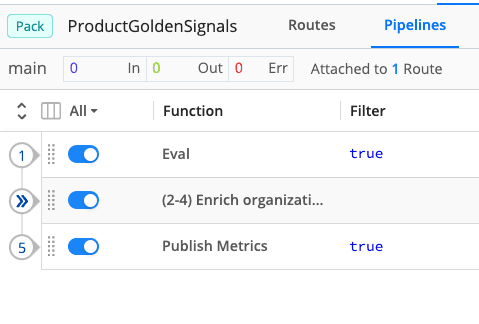
Pack: Packs enable Cribl Stream administrators and developers to pack up and share complex configurations and workflows across multiple Worker Groups or across organizations. The Product Golden Signals pack includes a pipeline with these functions:
Eval function for calculating metric dimensions like
environment,tenantId,accountId.2-4 functions for enriching more tenant-specific dimensions, such as
license,state,ownerIsCribl. A Redis lookup is used to maintain high latency and fetch tenant details.Gauge metrics with appropriate dimensions are then published.
Analysis & Visualizations Using Cribl Search
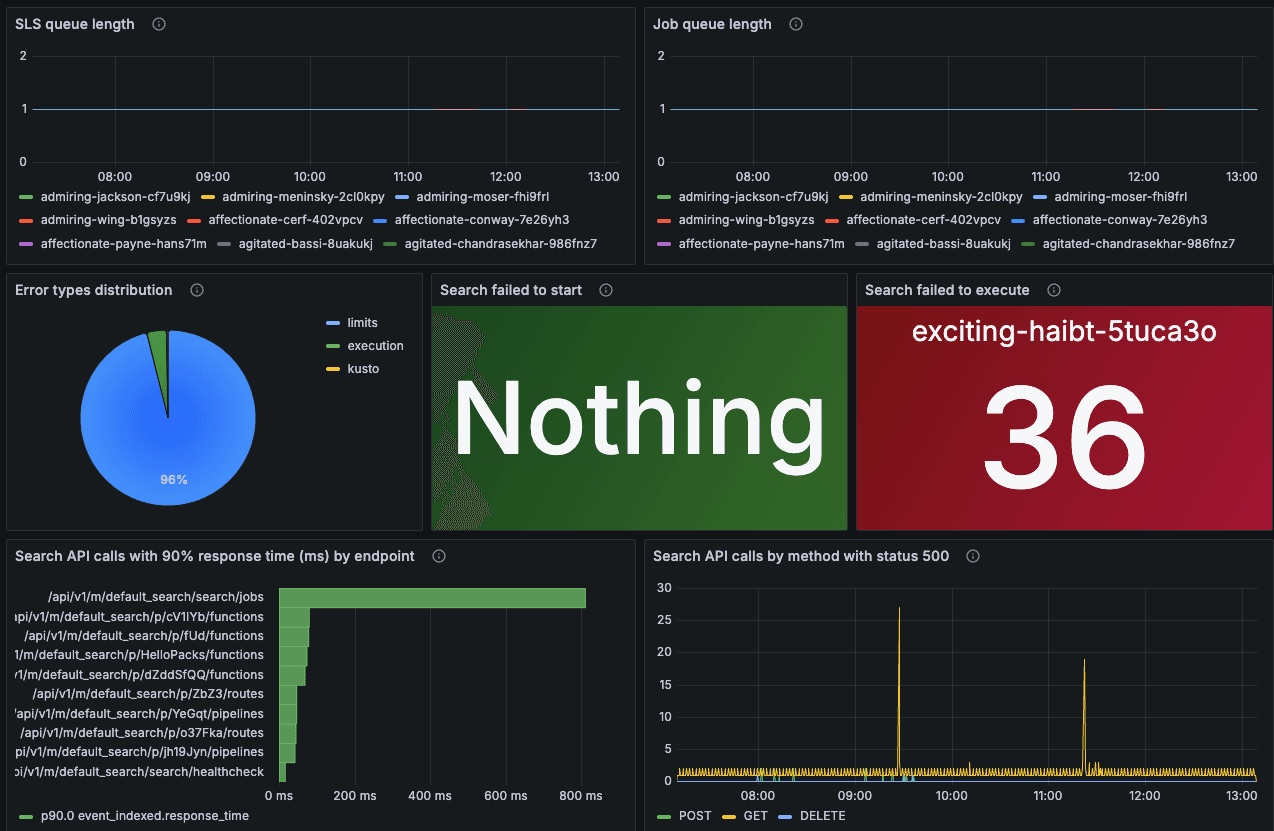
The following screenshot showcases our Search Product Golden Signals dashboard, monitoring service health across all fleets.
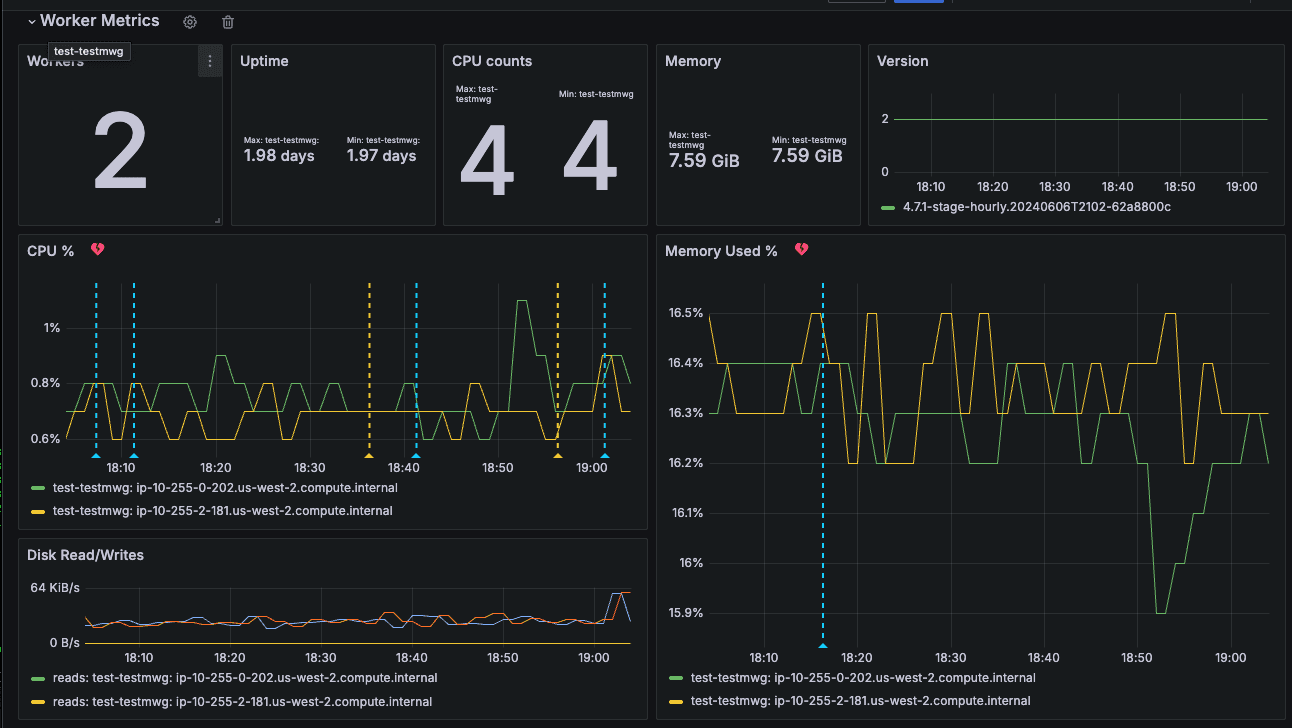
Similarly, for observing host metrics, activating in_system_metrics source in the fleet node will forward all host-level metrics to Stream and Grafana. The sample host-level metrics dashboard for organizations can be seen in the following screenshot.
Logs
Collecting Product Logs Using Cribl Edge & Cribl Stream
Our system collects tenant logs stored in the host filesystem and forwards them using the fleet node to Stream for further processing. Stream enriches the log data and then publishes it to Amazon S3 storage, which is partitioned specifically for optimal use with Cribl’s Search product. This setup enables users to easily query, create dashboards, and set up alerts based on the logs.
A sample configuration for the Edge File monitor can be seen in the following screenshot.
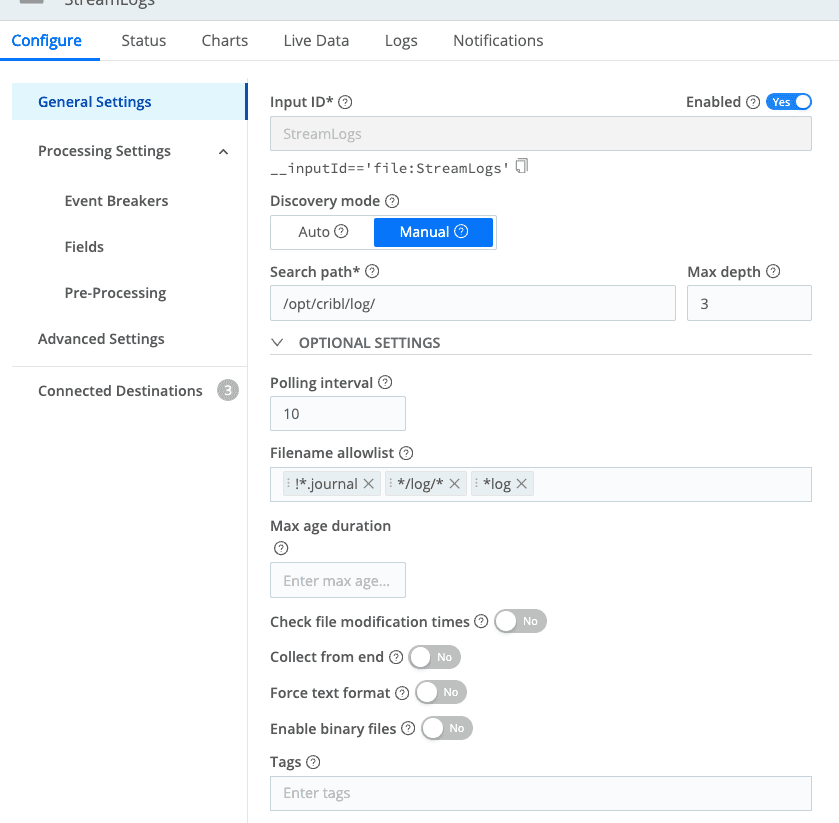
Then, we forward the logs to cribl_http:stream destination. Stream then routes the events to StreamLogsForS3 pack, which has the following 2 functions:
Parser to extract JSON Object from
_rawfield, andEval to add more fields.
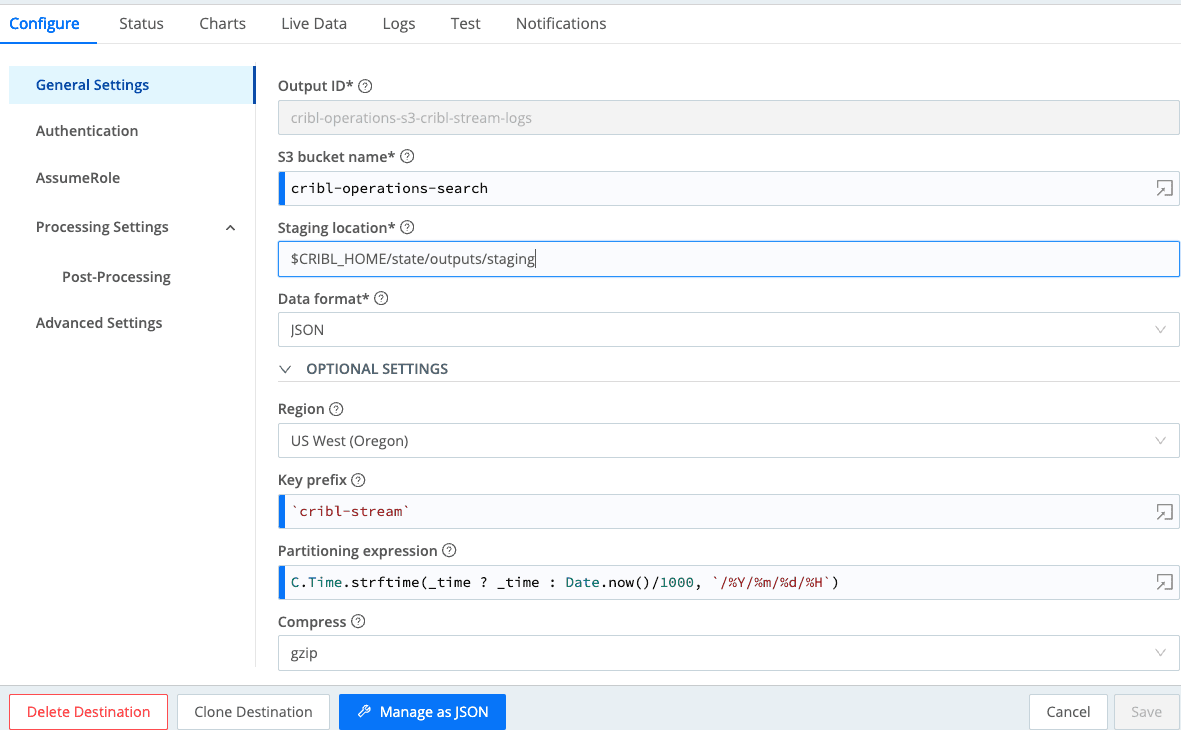
The output is then sent to an S3 bucket. The following screenshot illustrates the S3 configuration.
Analysis & Visualizations Using Cribl Search
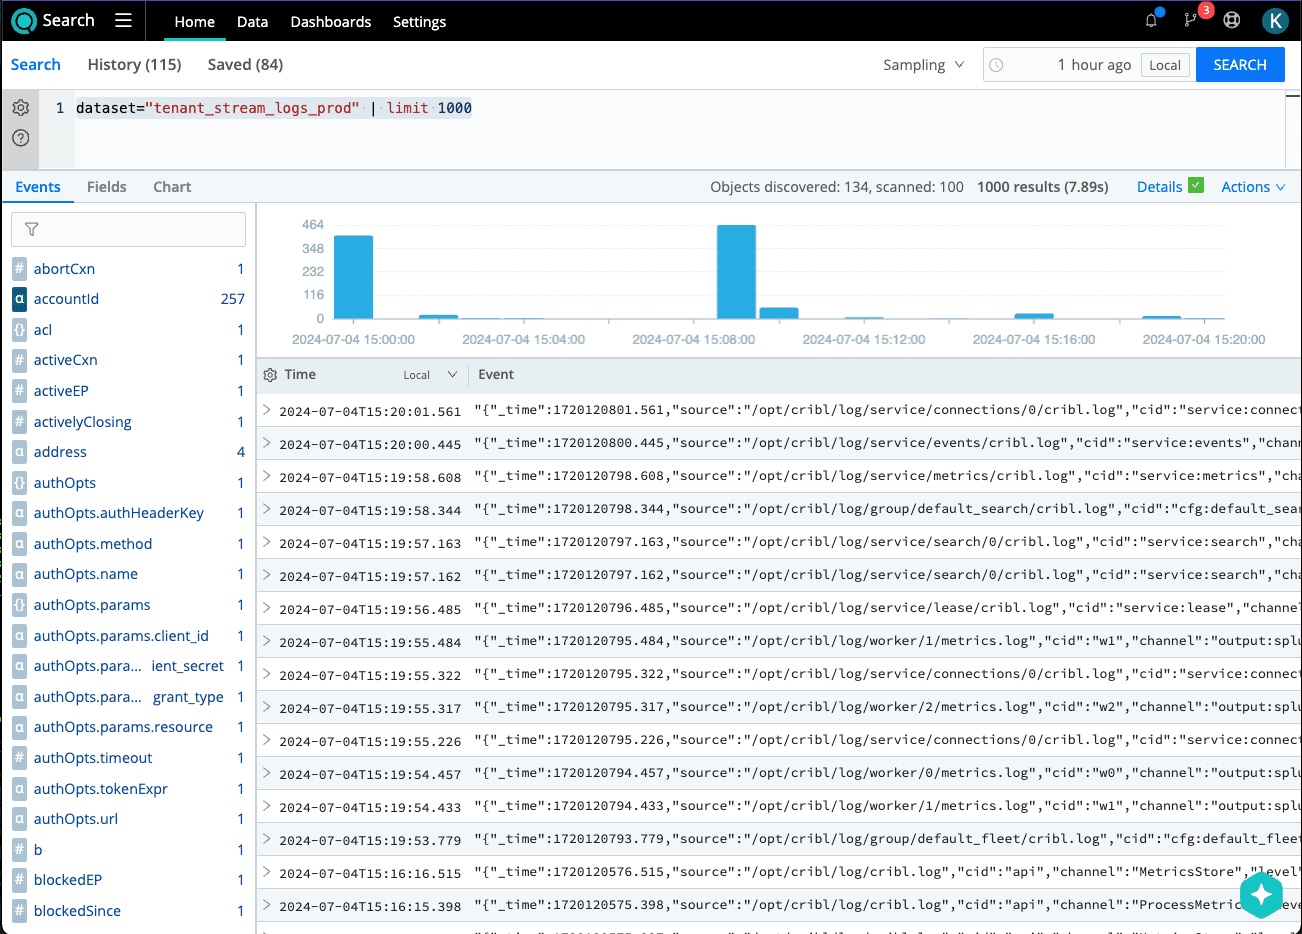
Once data is successfully stored in Amazon S3, we can configure a Cribl Search dataset pointing to cribl-operations-search/cribl-stream/${_time:%Y}/${_time:%m}/${_time:%d}/${_time:%H}/. This setup allows users to run queries similar to those displayed in the screenshot below.
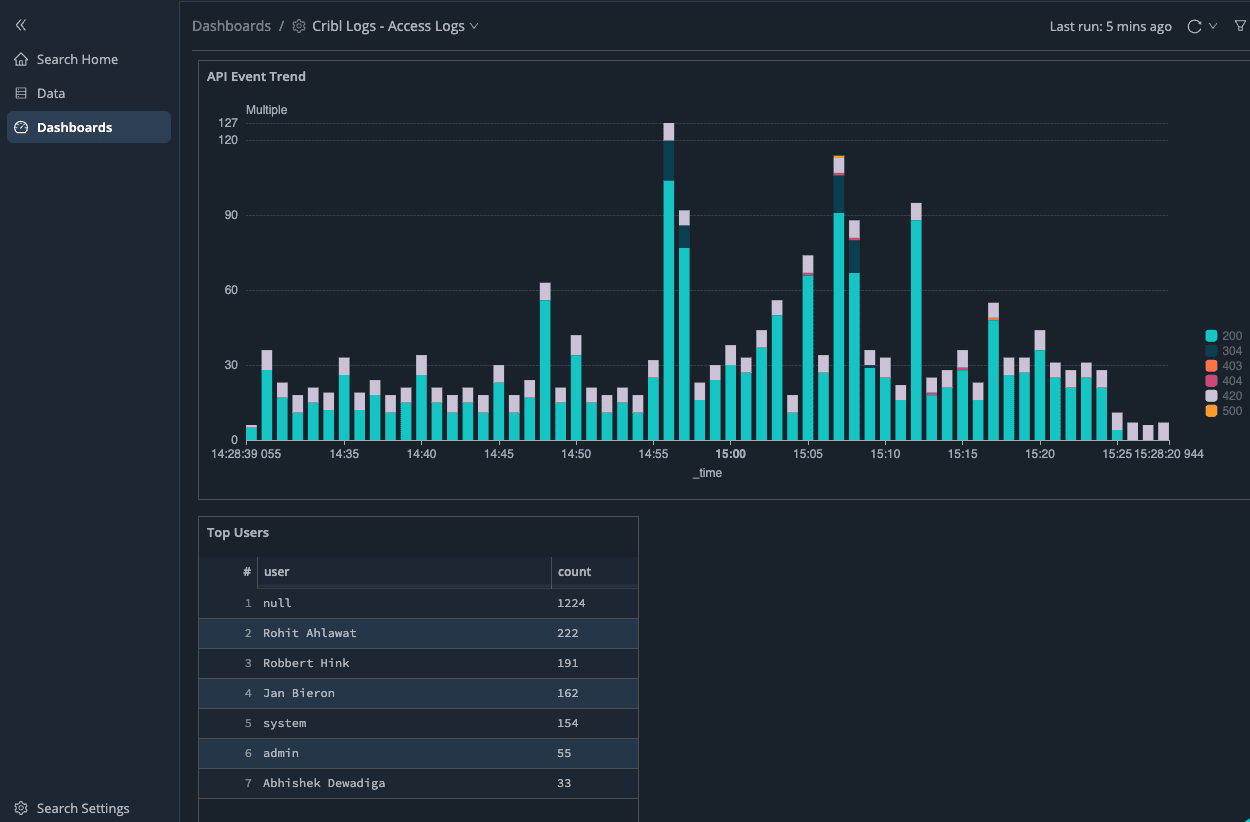
Furthermore, dashboards visualize collections of search queries, as demonstrated in the screenshot below.
Putting It All Together
When new tenant VMs are activated, they promptly register with the SRE Edge leader to obtain the configuration bundle. Subsequently, the fleet node transmits metrics and logs to the SRE stream cluster.
This setup significantly reduces the burden of agent management as the Edge leader handles updating the tens of thousands of fleet nodes. We have connected over 7000+ nodes and send approximately 200 GB of logs and metrics data through Stream daily.
High cardinality can be problematic because Prometheus must store each unique label value combination as a separate time series. This can lead to significant storage overhead and performance degradation, making it challenging for Grafana to query and visualize the data efficiently. By utilizing Stream, we gain enhanced control over transforming or excluding dimensions before encountering high cardinality challenges in Grafana.
Wrap up
The Cribl SRE organization has built a fully-featured and scalable observability system using the Cribl suite of products. This system monitors our entire Cribl.Cloud includes our cloud infrastructure, deployment and orchestration systems, and products. It provides robust and reliable insights at a massive scale in a demanding production environment.
In addition, by using our own products to power our Observability system, we’re able to put ourselves in our customers’ shoes—the Cribl SRE team has often provided critical product feedback, identified bottlenecks, and helped shape the Cribl Cloud suite into a robust and highly scalable system ready for the challenges of today’s complex data and cloud infrastructure landscape.
In future blog posts, we’ll share:
How Cribl SRE gets tenant leader metrics and converts logs to metrics
How easy it is to configure multiple log sources in Cribl and route to multiple destinations
A cost-effective CloudWatch exporter solution using Cribl
Cribl Search optimization for large log volumes