
To fully utilize the capabilities of Kubernetes, it’s crucial to have a reliable system for gathering and organizing logs, metrics, and events. With the complex nature of container orchestration, it’s crucial to understand the significance and process behind the data generated in a Kubernetes environment at scale. Cribl Edge works seamlessly with Kubernetes and can cater to various needs. This technical blog provides an in-depth explanation of how and why Cribl Edge integrates with Kubernetes, making it the perfect solution for organizations looking to utilize the full potential of Kubernetes.
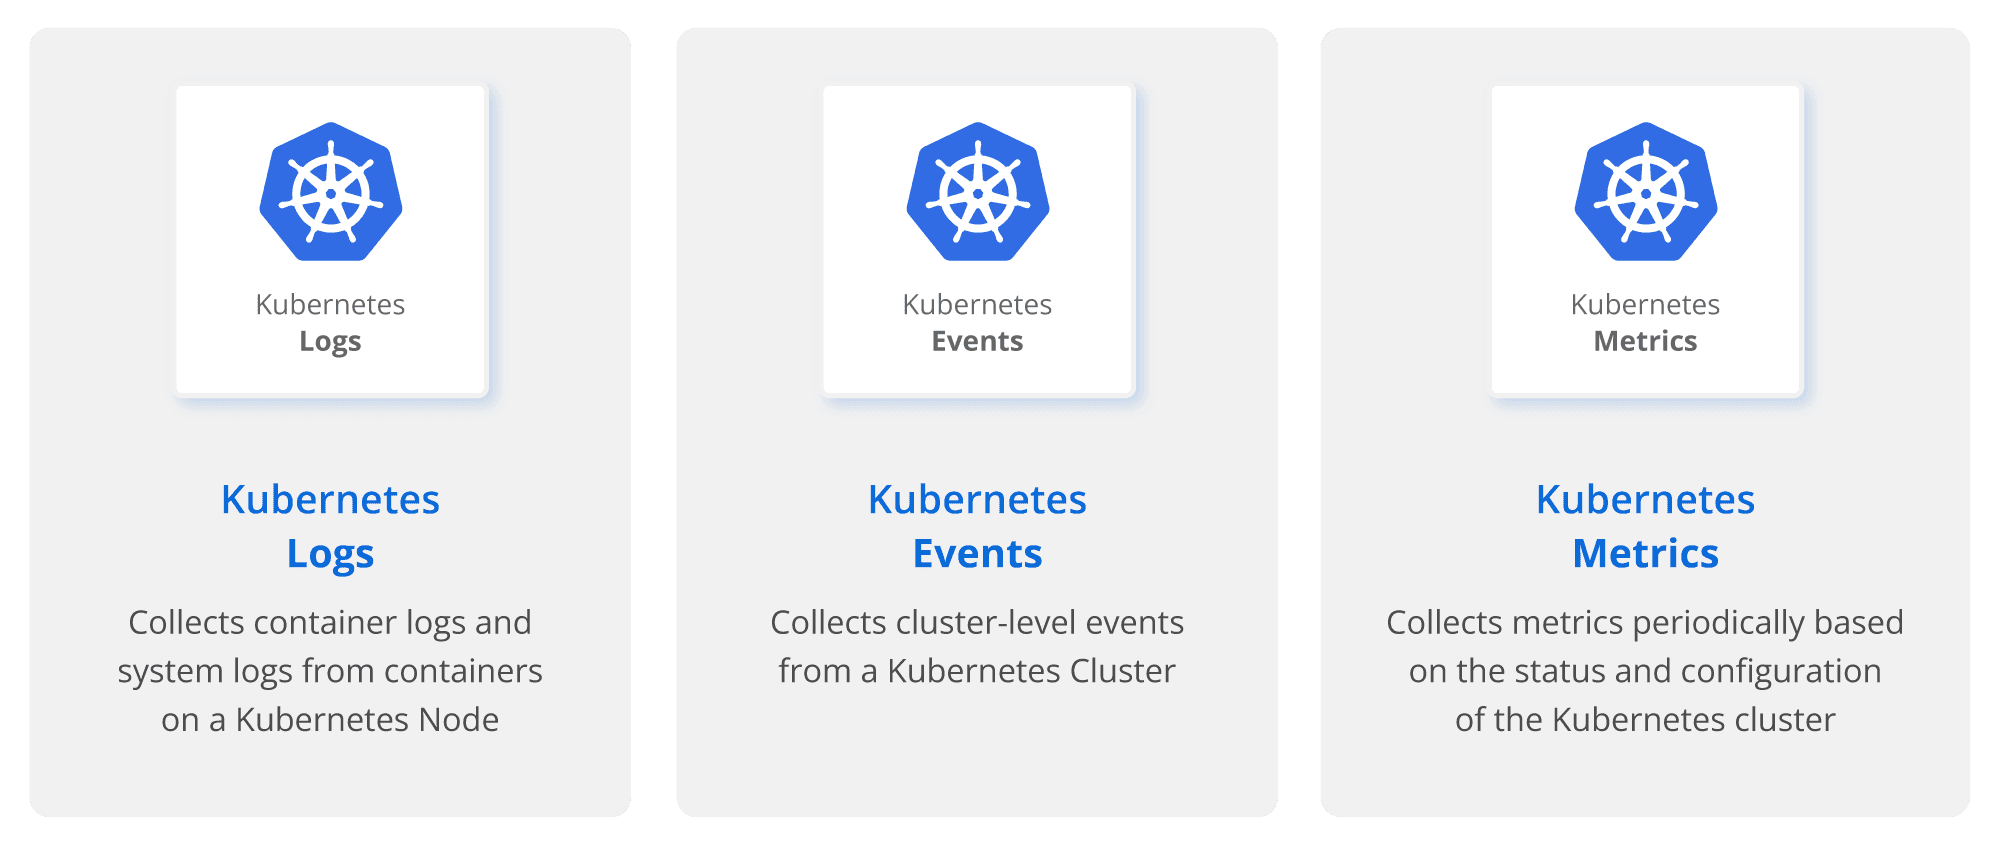
There are various reasons why it is important to gather logs, metrics, and events from Kubernetes. Firstly, it allows for application monitoring, ensuring that applications are functioning as intended and keeping track of error rates. Secondly, performance monitoring helps to keep track of CPU and memory usage by the app or container. If usage is higher than expected, it may indicate an issue with the app, which could potentially be a security concern. Thirdly, monitoring resource utilization in the cluster can aid in capacity planning, ensuring that the cluster is appropriately sized. Fourthly, security monitoring, primarily through logs, can help to detect anomalous activity, suspicious network activity, and spikes in logs or CPU utilization. Lastly, Kubernetes Events can capture important information such as frequent pod restarts or evictions, suspicious pods being deployed, and an audit trail of activity. Cribl Edge for Kubernetes can assist with gathering Logs, Events, Metrics, and Metadata from the Kubernetes cluster.
Kubernetes Logs collection
The three most common approaches to collecting logs from Kubernetes are:
Use a node-level logging agent that runs on every node.
Include a dedicated sidecar container for logging in an application pod.
Push logs directly to a backend from within an application.
At Cribl, we always like coming up with new solutions and shaking things up. Hence Cribl Edge selected to use a DaemonSet approach for its implementation.
A DaemonSet allows Cribl Edge node-level logging agent to run on every node in the Kubernetes cluster.
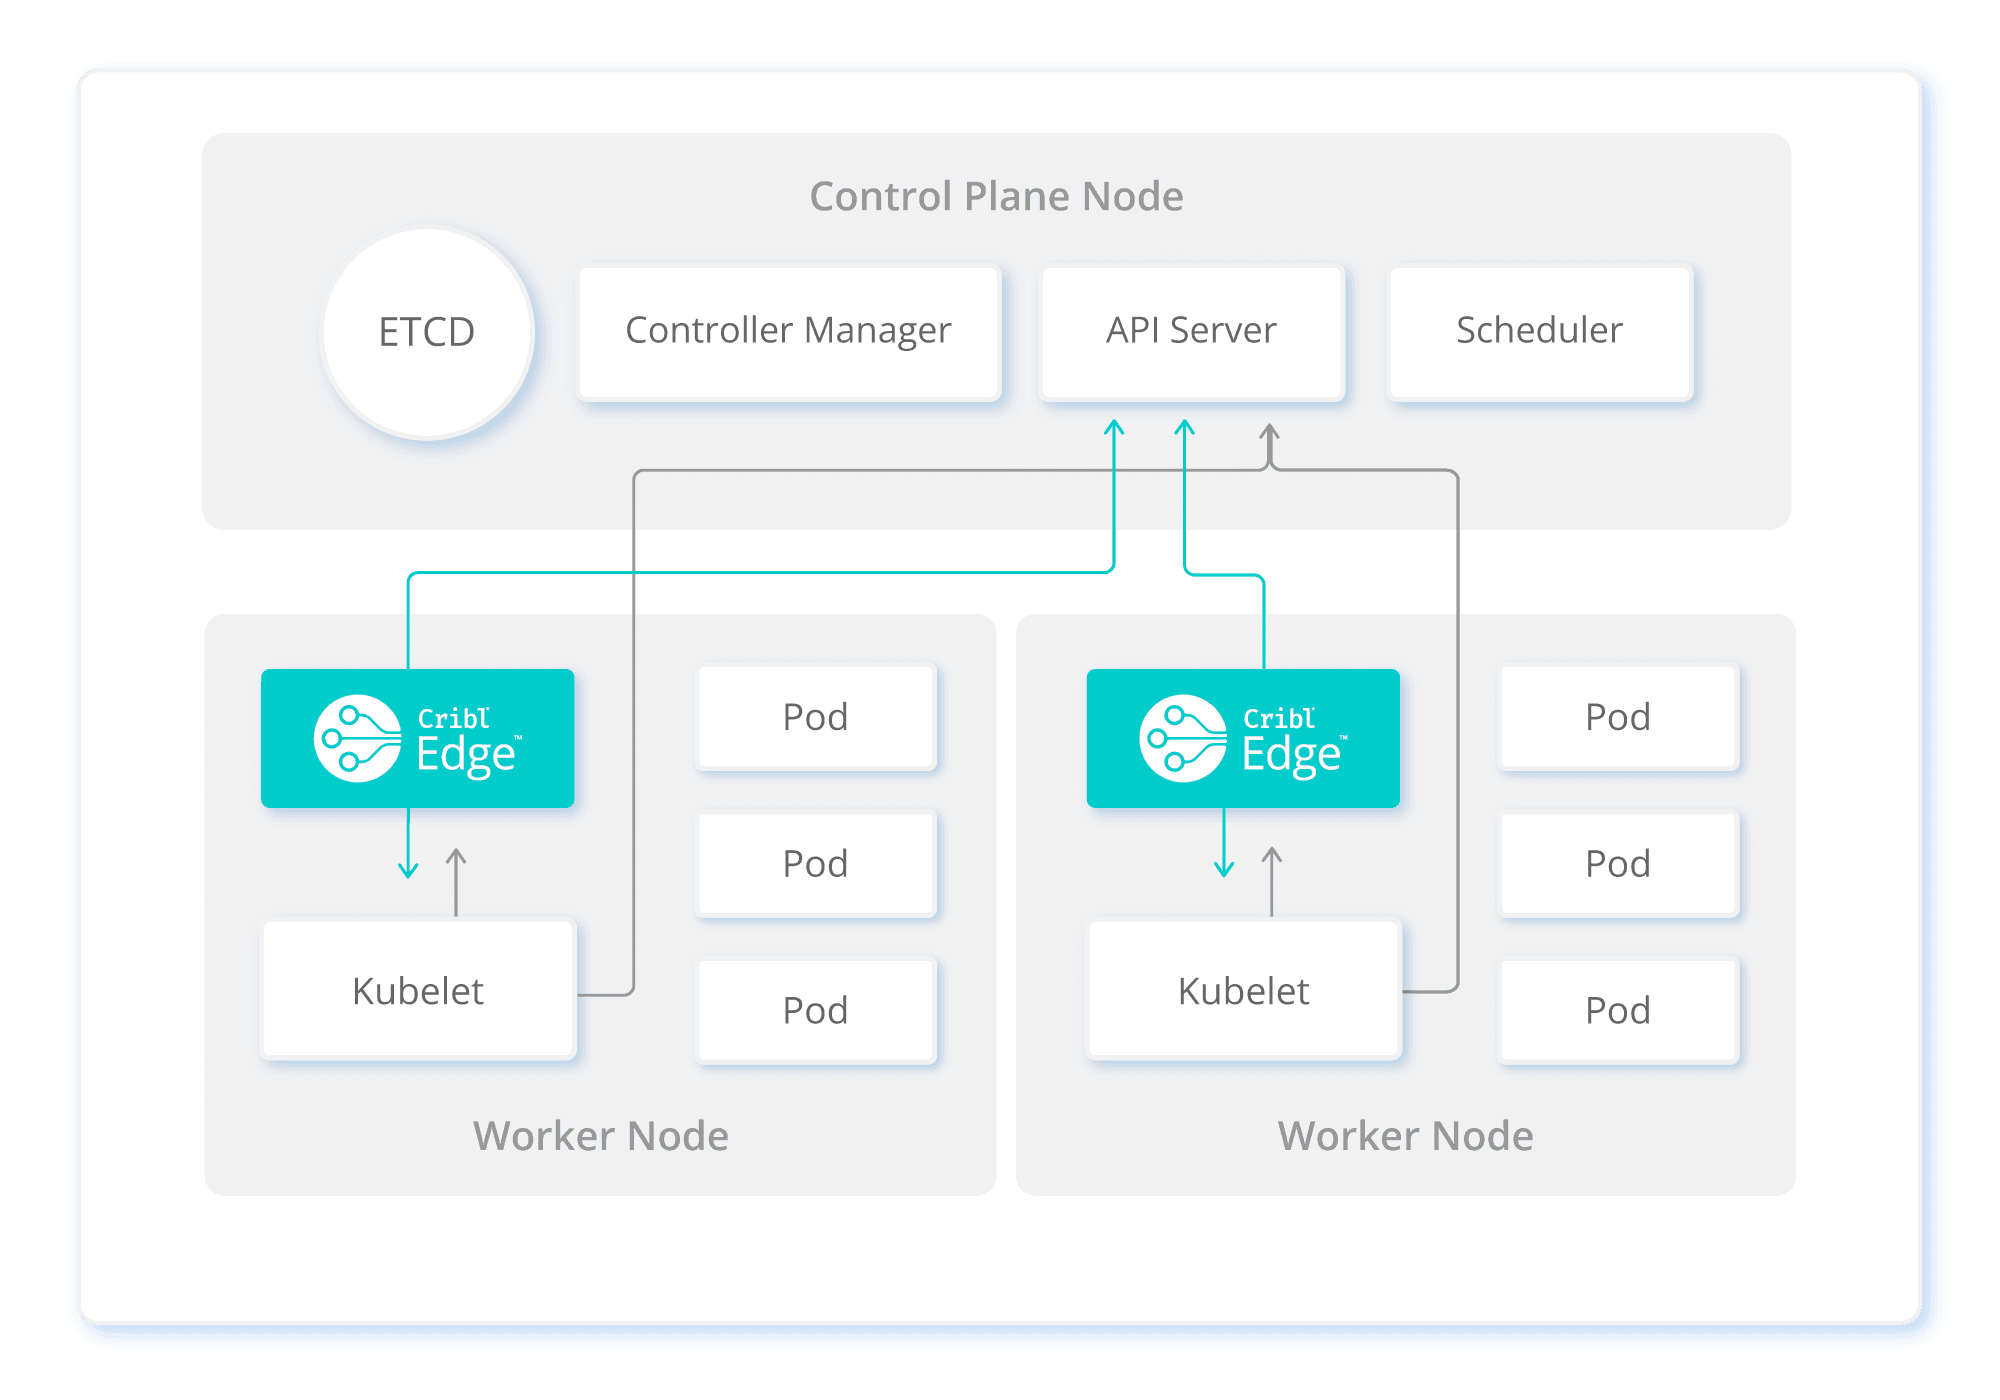
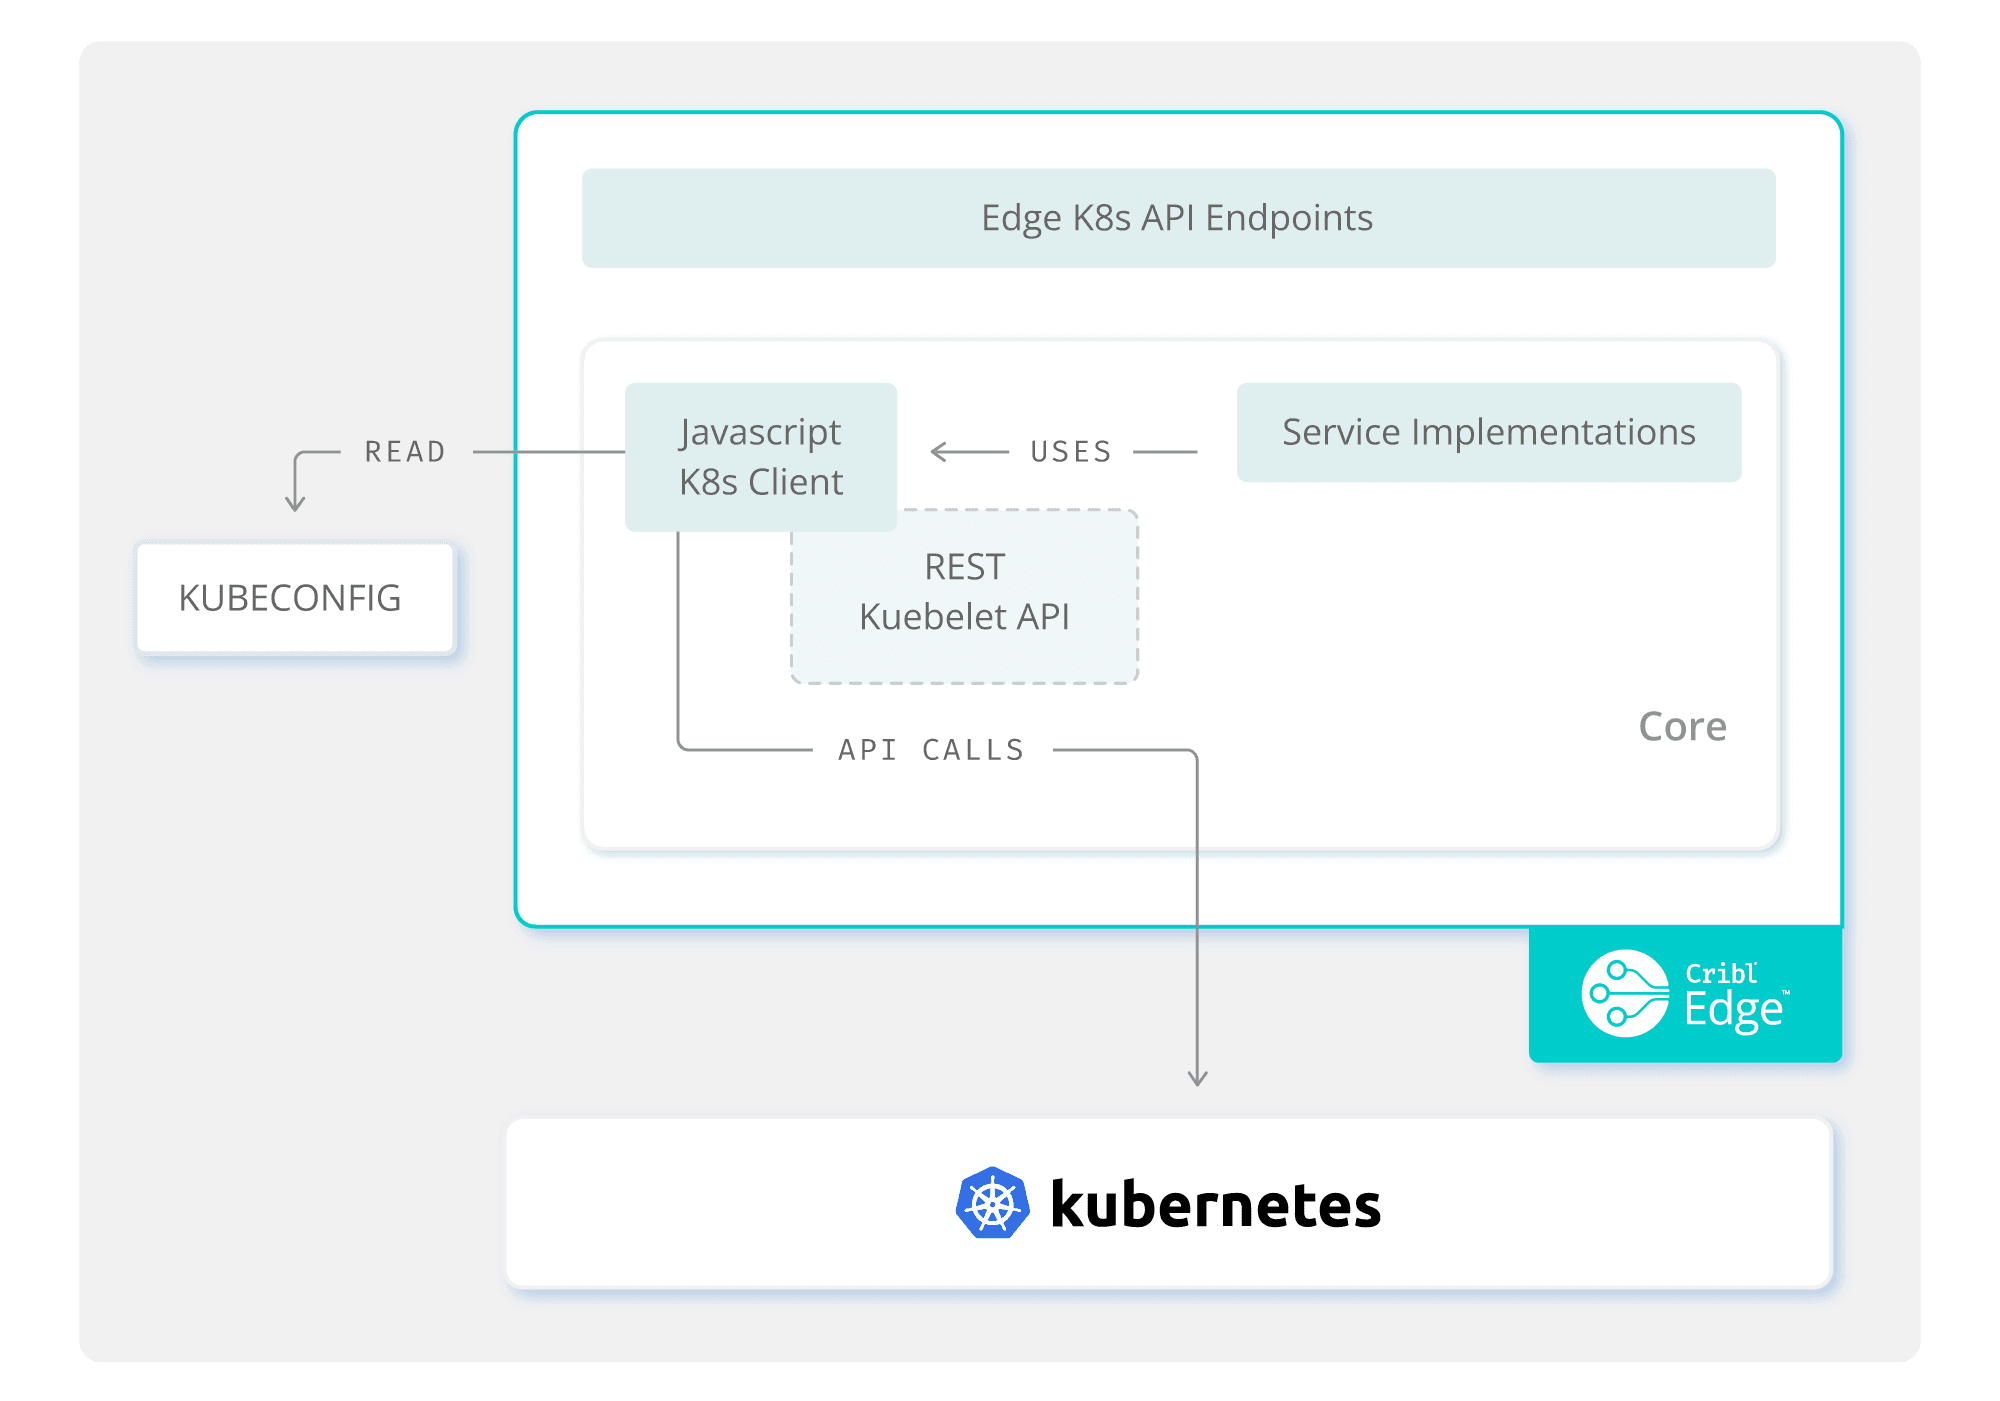
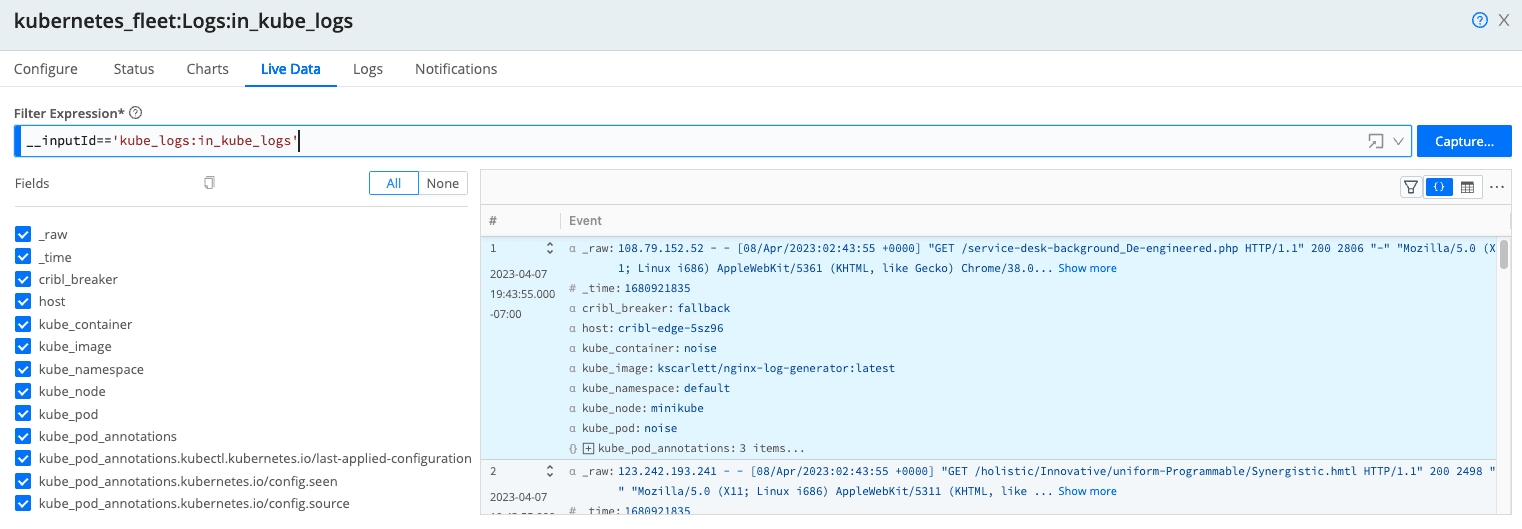
The Kubernetes Logs Source connects to the Kubernetes API and loads the lists of Pods on the node, on a configurable Polling interval.
The Integration is using the Kubernetes Client Javascript API
Logging – Cribl Edge, the cool factor
The Source then runs the Pods through the Filter Rules to determine which ones to report on. For example:
Ignores Pods in the kube-* namespace –
!metadata.namespace.startsWith('kube-')Collect logs from Pods on a specific Node –
spec.nodeName == 'node1'Ignore all DaemonSets –
metadata.ownerReferences[0].kind != 'DaemonSet'Ignore Pods with specific Container names –
spec.containers[0].name != 'edge'
To see the large amount of metadata Cribl Edge returns, click on the ‘ show internal fields ‘ and explore the __metadata field
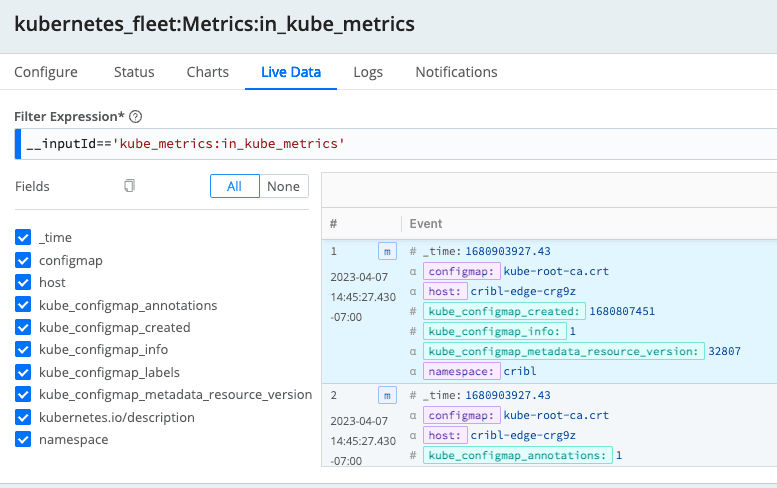
Kubernetes Metrics collection
Cribl Edge use of a DaemonSet for metrics collection
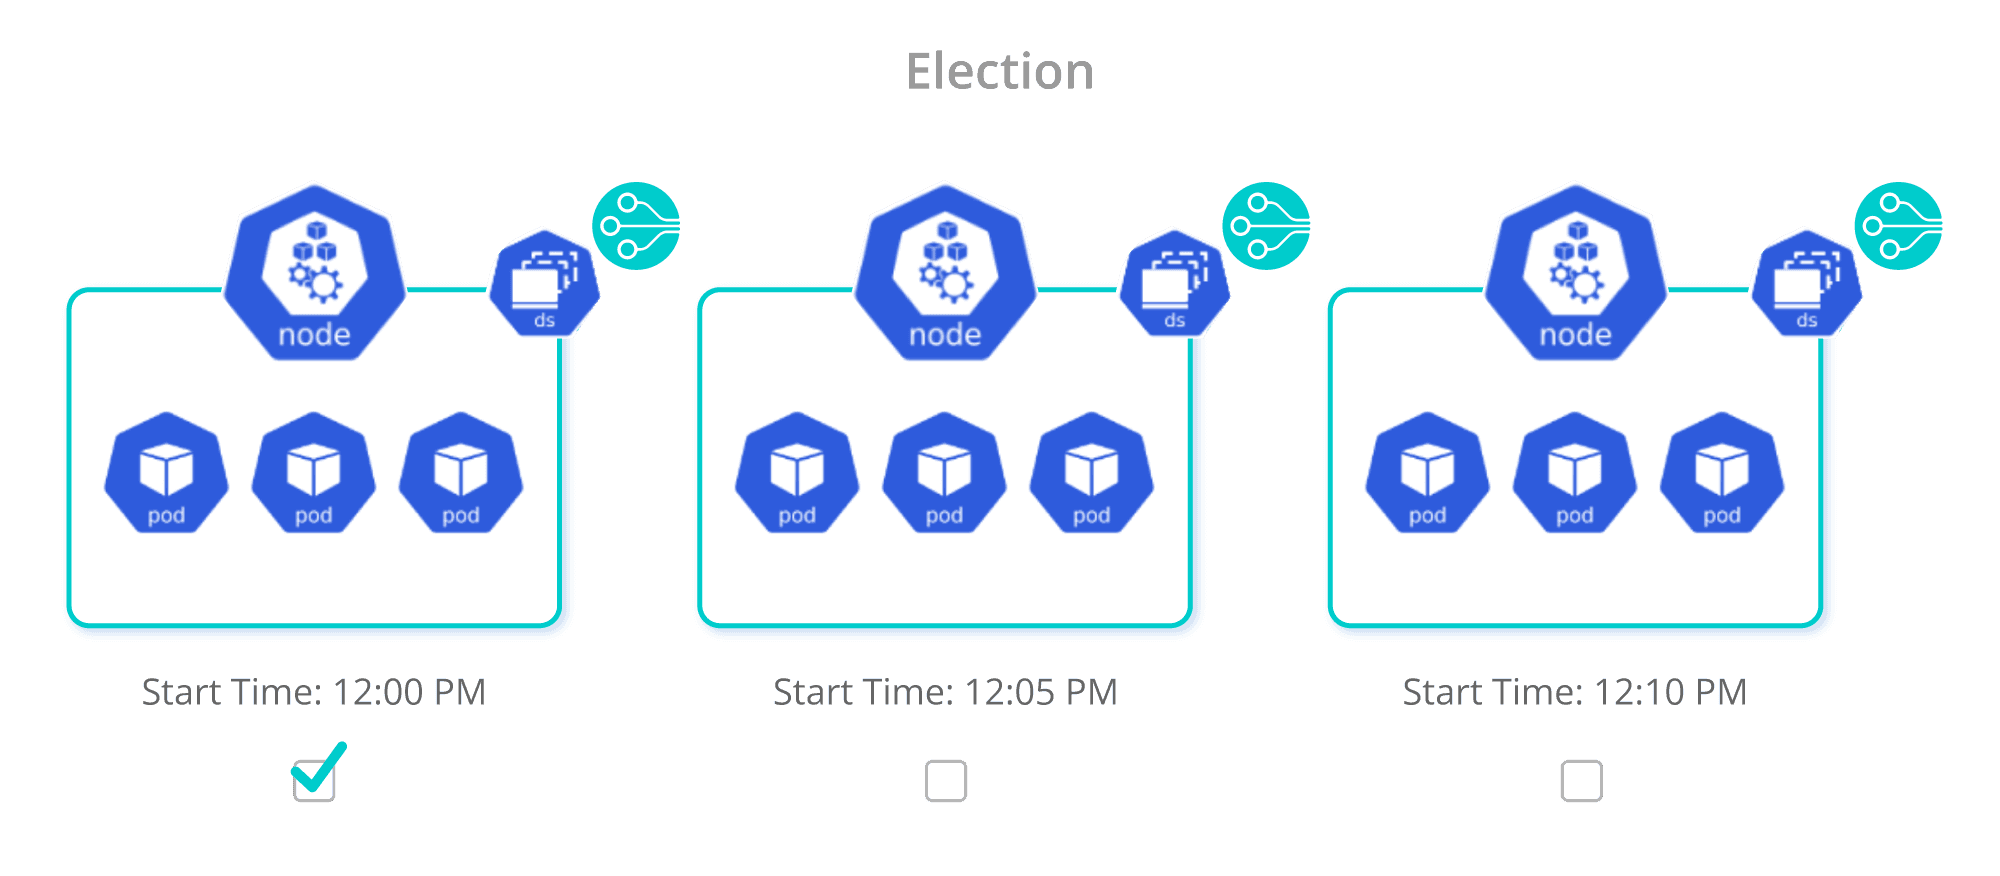
Cribl Edge on Kubernetes to avoid collecting the same metrics from multiple nodes uses an election to collect metrics from only one node.
The election happens every 5 minutes on all of the nodes and the oldest node in the cluster wins
To check the Cribl Edge metrics Source’s operational state, go to Status and expand the host details. The Operational State Column shows either an Active state or Standby. Active indicates the Source is running or won the election. Standby means it’s waiting to be re-elected and not currently running.
To collect Kubernetes metrics, Cribl Edge uses the
/metrics and /metrics/cavisorendpoints on the kubelet. This information gives us a really good idea of what’s going-on on each Node and Pod.
Metrics – Cribl Edge, The Cool Factor
In addition to all of the same cool options highlighted above, Cribl Edge metrics also support Disk Spooling. This option enables Cribl Search the ability to query metrics collected by Cribl Edge. Cribl Edge and Cribl Search provide a powerful and comprehensive observability solution that allows observability engineers to quickly access and analyze logs and metrics from edge nodes without needing to ingest data into other security or analytics tools.
To know more about Searching at the Edge, give this video on “Searching the Edge” a look
New! Cribl Edge’s Prometheus Scraper:
Cribl Edge offers a purpose-built-for-Kubernetes collector that can receive batched data from Prometheus targets, in addition to the native Kubernetes integrations. This feature is particularly useful in Kubernetes deployments where Prometheus is already a widely used standard, as it provides a vendor-neutral approach to monitoring Kubernetes.
Wrap up
If you’re interested in Cribl Edge for Kubernetes monitoring, it’s time to try it out for yourself. We offer a Kubernetes Observability with Cribl Edge Sandbox, which guides you through the process of installing Cribl Edge on a Kubernetes cluster using our Helm Charts. You’ll also learn how to configure sources for capturing logs and metrics generated by Kubernetes and your applications running in the cluster. Additionally, we’ve included pre-built dashboards in Grafana to help you visualize the data. Don’t hesitate to give it a try and see how it works for you.