Recently, I have seen a trend of enterprises moving toward OpenTelemetry (OTel) for application tracing. Tail sampling, in particular, has emerged as a preferred approach to gain actionable insights while balancing data volume and cost. OpenTelemetry offers developers and practitioners the ability to instrument their code with open-source tools, moving away from vendor-provided tools for application instrumentation. This comes at a cost, as enterprises are left to create solutions to replace vendor-equivalent experiences, such as auto-instrumentation, sampling methods, and visualization.
In observability systems, we are often managing cost and visibility as divergent interests. In an ideal world, practitioners would have all telemetry data for all time periods. Metrics resolution would be infinite. Logs and traces would be available forever. In reality, the volume of data makes this unrealistic. First, it is too costly to have total visibility. All of that telemetry data needs to be collected, transported, and stored. Secondly, due to the volume of data, analysts would drown in logs and traces that show expected performance, while missing abnormal behavior or performance. In order to control costs and time, practitioners often sample the data.
Trace sampling can be done several ways. This approach offers differing levels of complexity and visibility. Head sampling is an option that samples traces based on a decision at the start (head) of the trace. It’s fairly simple to implement. It has a fixed cost, with predictable hardware sizing and profiles. Sampling decisions are based on a static probabilistic selection. For example, a practitioner may decide to sample 2% of traces, but limit that to only deterministic selection. For the chosen traces, all the spans are collected and forwarded for analysis, regardless of the user experience captured in the trace. Traces with errors or poor performance are more interesting than normal traces to practitioners. With head sampling, decisions to sample the trace lack the context to know if a trace contains an error or poor performance.
Unlike head sampling, which samples traces at the beginning and can miss critical events, tail sampling evaluates traces after they complete, providing full context, and enabling targeted insights into issues like errors and latency. For example, sampling decisions can be made on error conditions that happen in the middle of the trace. Tail sampling systems have to track the state of each trace to have the context of when the trace is complete. This approach requires aggregating and storing the traces until a sample decision has been made. It is significantly more costly and complex to implement, relative to head sampling.
Cost of Tail Sampling
Tail sampling sounds like the ideal way to surface the most important traces while controlling the volume of data. But most customers struggle with the cost of tail sampling, too. Tail sampling can incur significant expenses due to the need for high compute power and storage capacity. These costs stem from requirements for real-time data processing, state management, and large-scale data retention, particularly in dynamic cloud environments.
At Cribl, we offer our customers choice and control over how they ingest, store, and analyze their observability and security data. Using Cribl Stream and Search, OpenTelemetry traces can be tail sampled using low-cost blob storage and ephemeral cloud compute, rather than large systems. By leveraging blob storage for cost-effective data retention, and ephemeral cloud compute for scalable processing, Cribl optimizes tail sampling to control costs while maintaining performance. This approach allows flexibility in scaling compute resources based on demand, without permanent overhead.
Below is an example of how to set up tail sampling with the OTel Demo app, using Cribl Stream, Cribl Lake, and Cribl Stream. Details on each of those products can be found below:
An Example
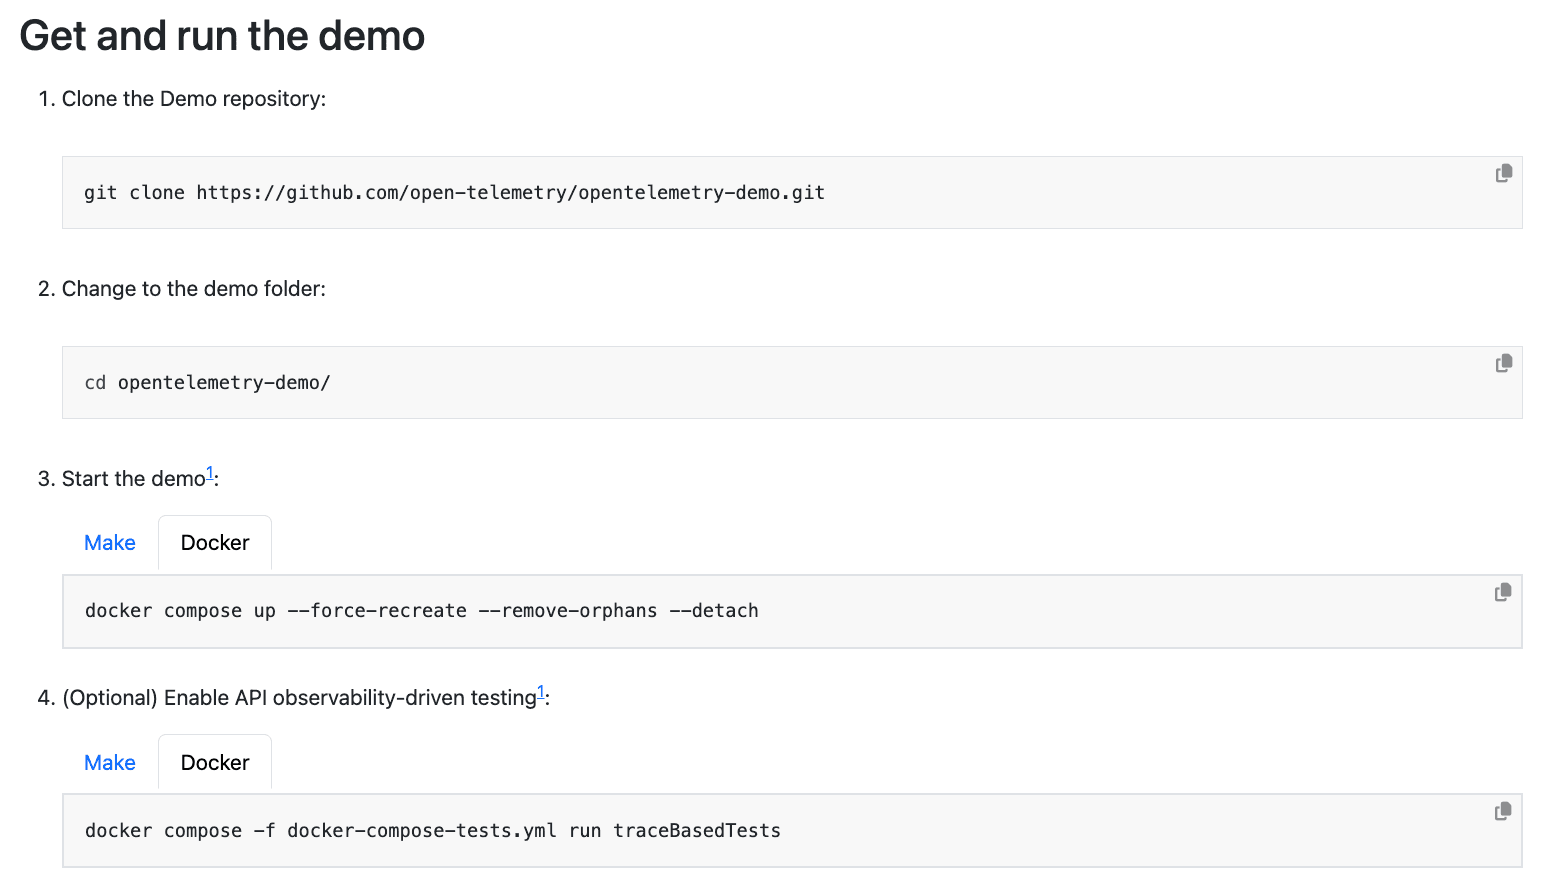
This guide details how to set up the OTel Demo app to send traces to Cribl Stream, route the traces to Cribl Lake for cheap storage, and sample the 10 longest traces in the last hour. To start, set up and run the OTel Demo app, as outline here.
Once the demo app is up and running, set up Cribl Stream to receive OTel traces, metrics, and logs. Start by signing up for a free Cribl.Cloud account here. Once logged in, navigate to the default Worker Group in Cribl Stream. Add a new OpenTelemetry Source.
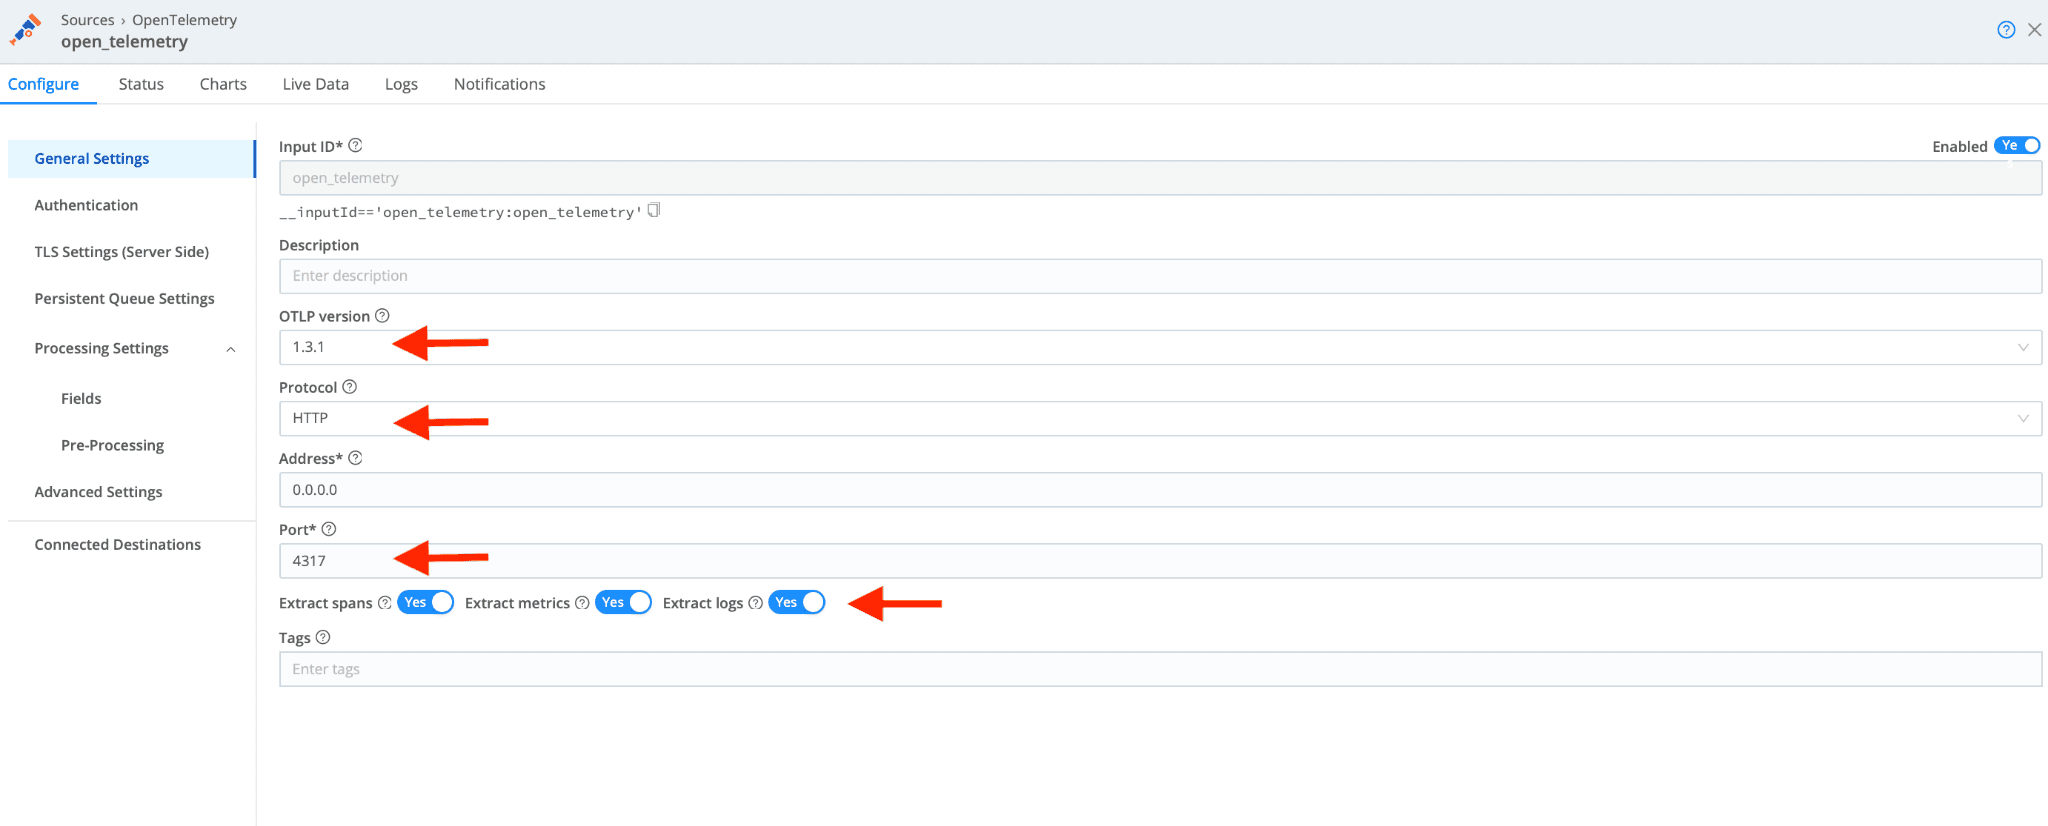
As shown above, configure the OpenTelemetry source to use OTLP protocol version 1.3.1. Configure the Source to extract spans, metrics, and logs. This configures Cribl to create events for each metric, log, and trace. More details on the advanced configuration details can be found here. Commit and deploy your OTel Source changes to your Cribl Worker Group.
Next, point to the OTel Demo app to send telemetry data to Cribl. To configure the OTel Demo app to send the telemetry to a new backend, we need to modify the otel-config-extra.yaml file.
From the OTel docker setup documentation, make the changes shown below:

In this case, set the endpoint to be the Cribl Stream OTel Source:
https://<Your tenant information>.cribl.cloud:4317
You can find access details for your specific deployment by navigating to Organizations in the Cribl sidebar. Then find the Workspace and data Sources. Copy the ingest address corresponding to your OpenTelemetry Source.
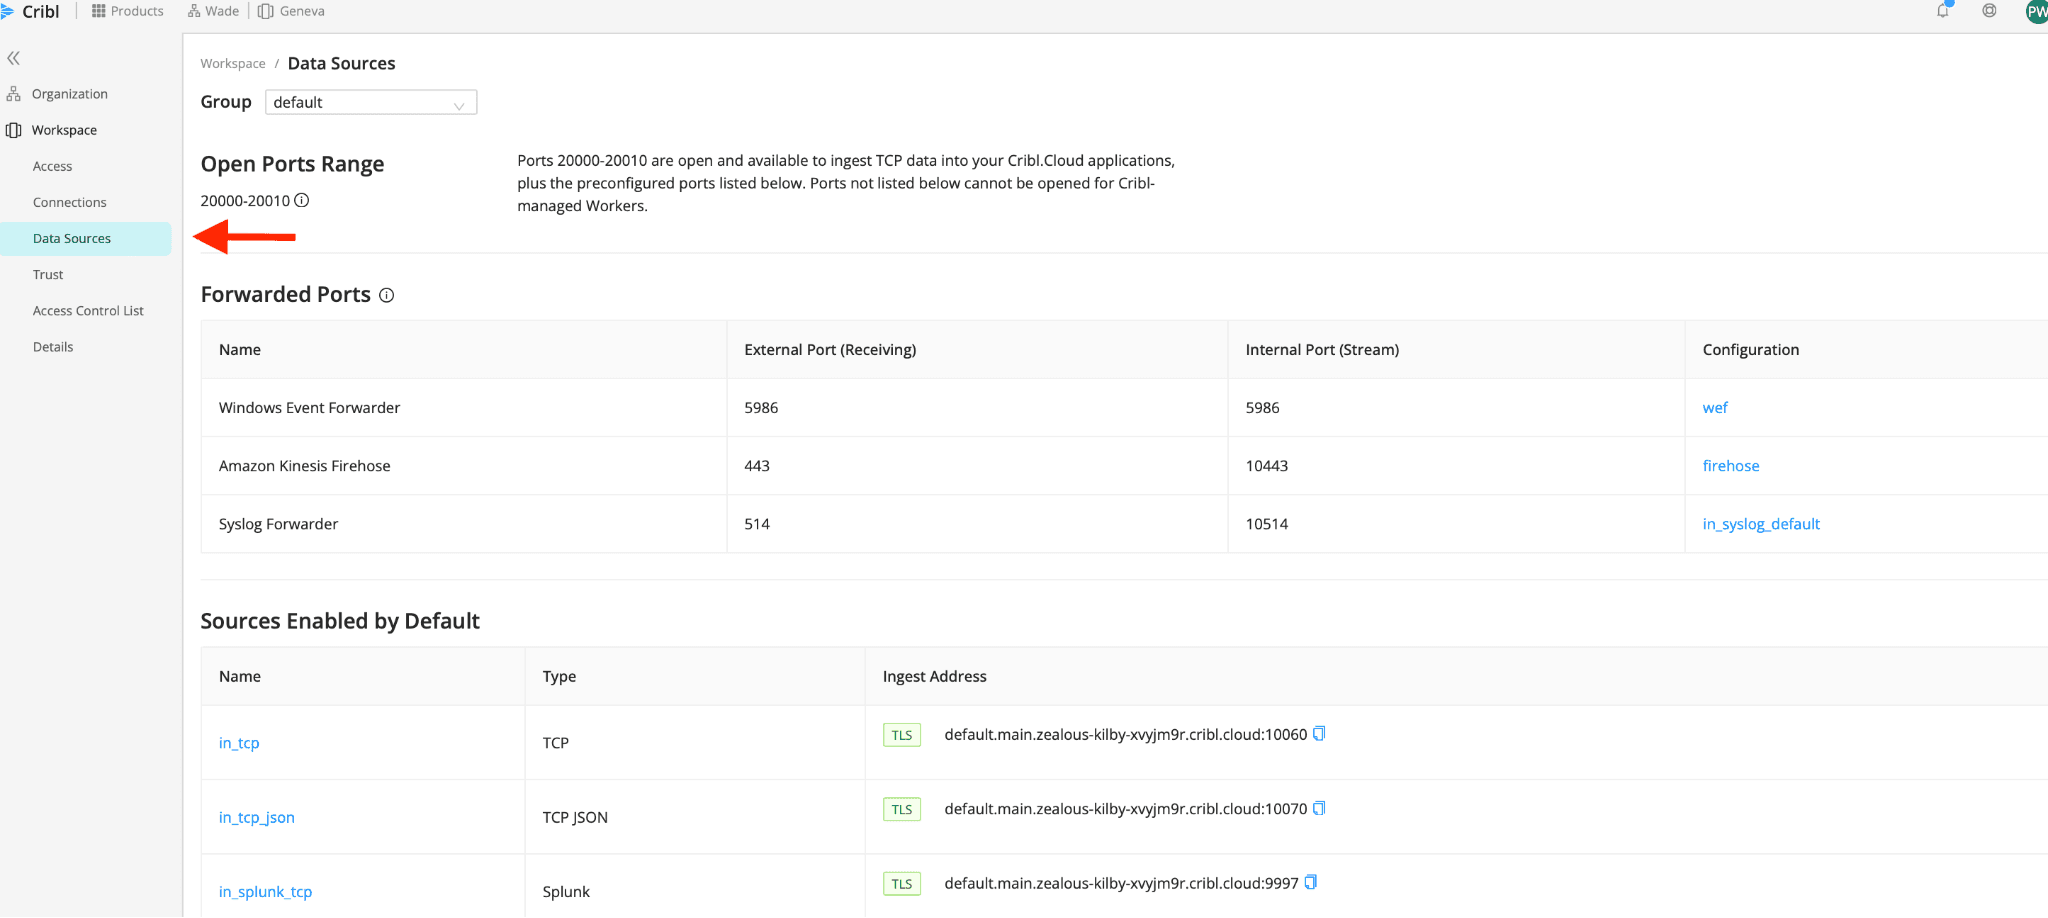
Once you have the changes saved in the otel-config-extra.yaml file, restart the OTel Demo app with docker-compose down and docker-compose up -d. Validate that you are sending telemetry data, by using the live capture feature on the Cribl OpenTelemetry Source. Details for running a live capture can be found here.
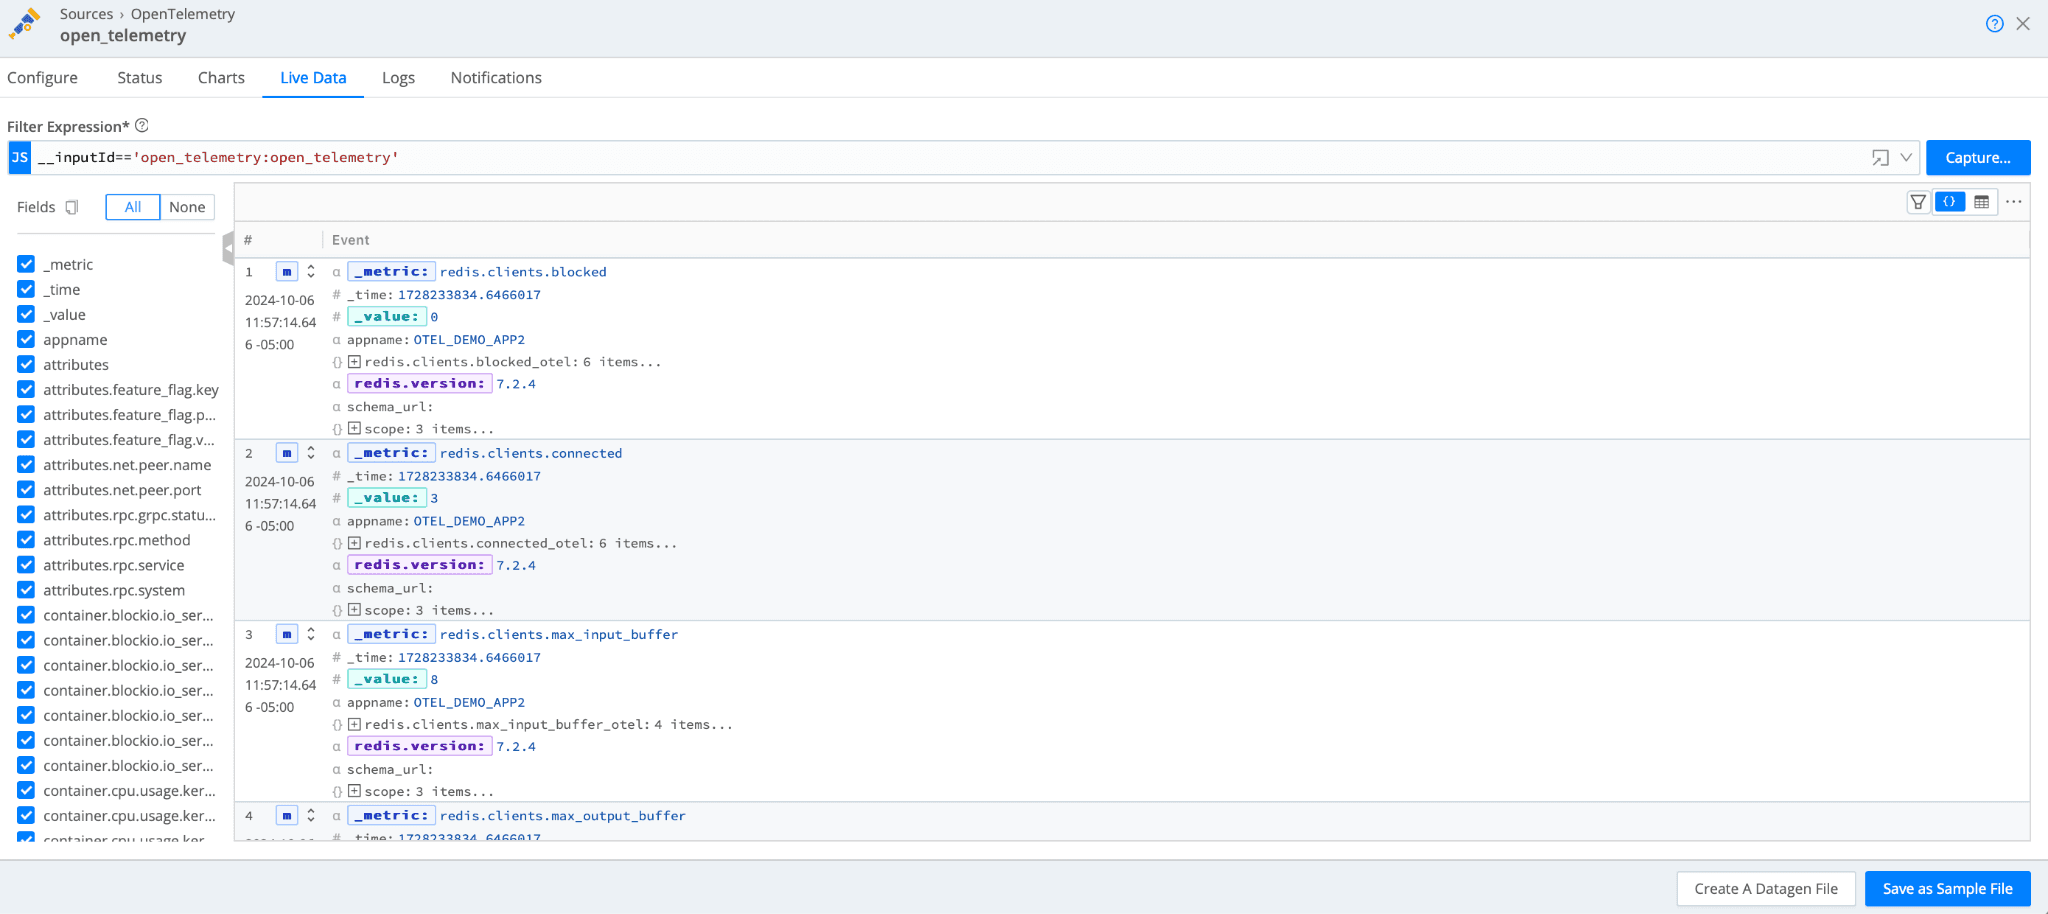
This demonstrates successfully exporting OTel telemetry from the Demo app to Cribl Stream.
Next, configure a place to store the traces for sampling. This could be blob storage locations, such as Amazon S3. For now, set up a Cribl Lake destination to receive the OTel data. The steps include:
Configure a Dataset in Cribl Lake.
Add the new Dataset as a Destination on Cribl Stream.
Route the data from the OTel Source to the new Destination in Cribl Stream.
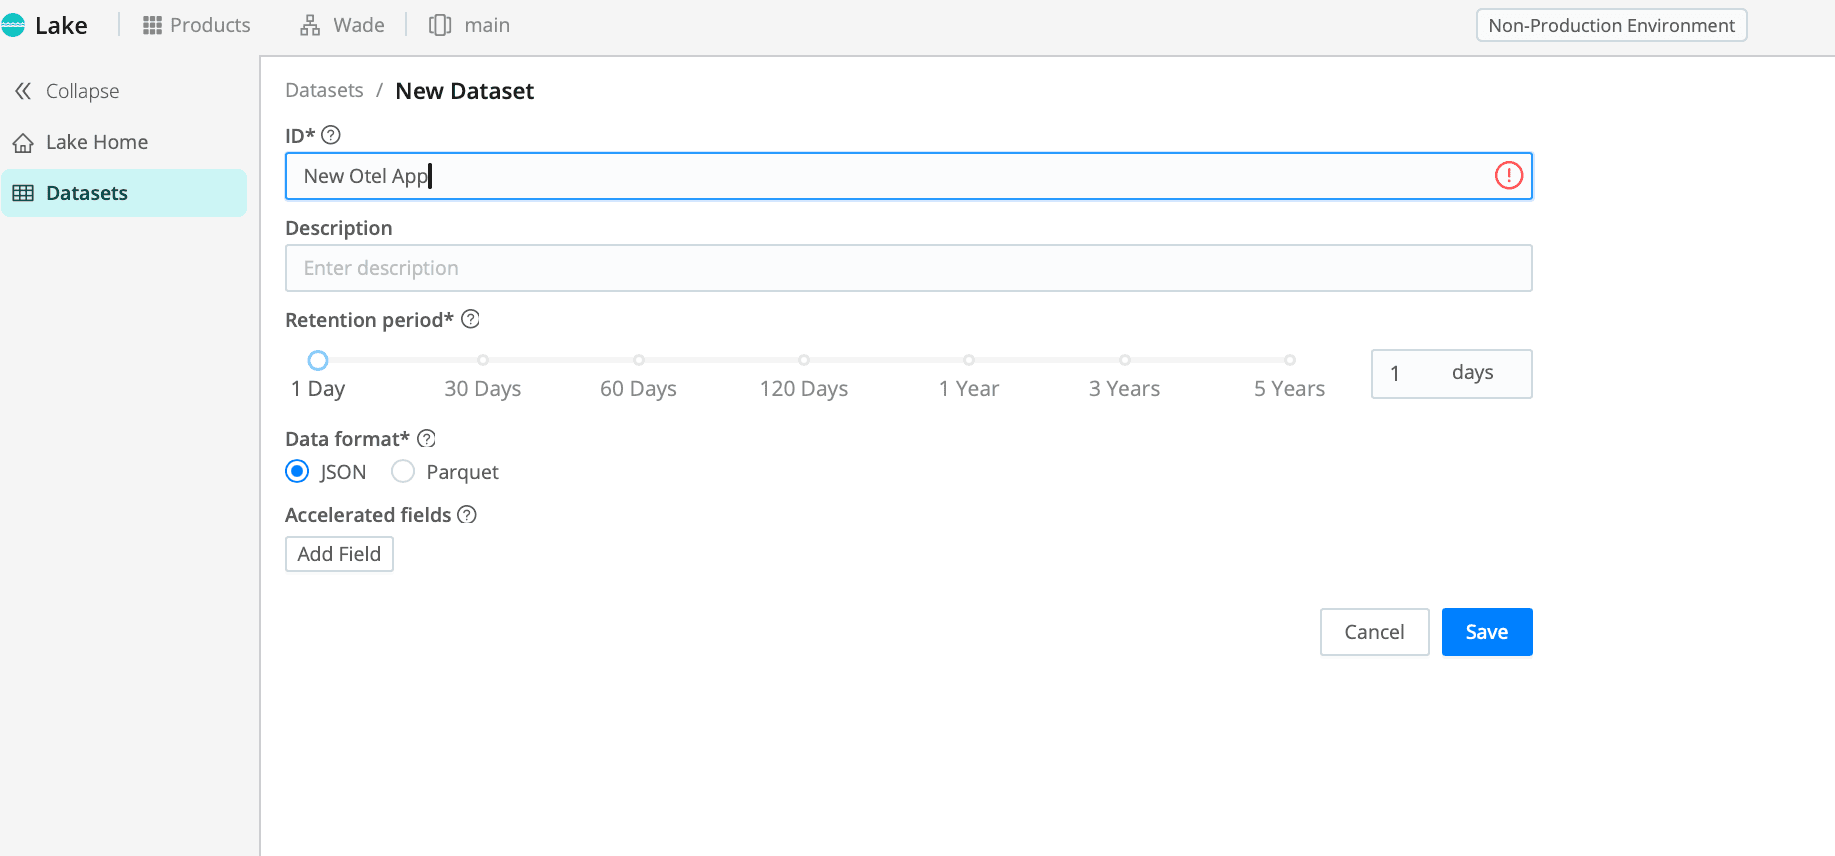
Start by setting up a Cribl Lake Dataset for the new OTel data. Name the Dataset and set the retention to 1 Day. Once complete, save your changes.
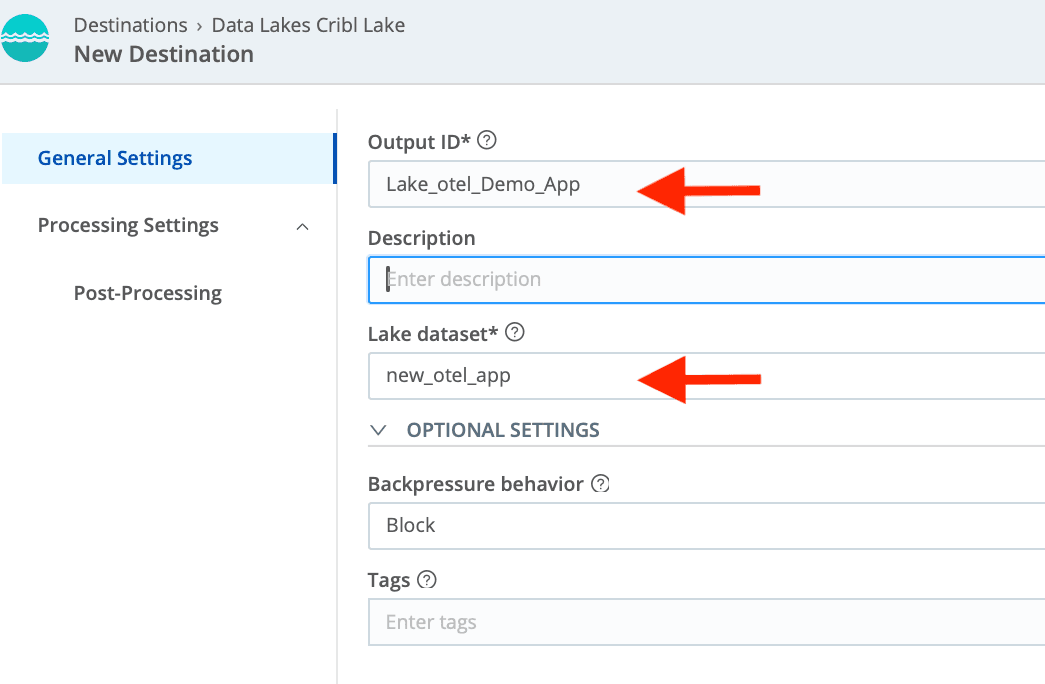
Configure the new Cribl Stream Destination. Choose your newly created Cribl Lake Dataset.
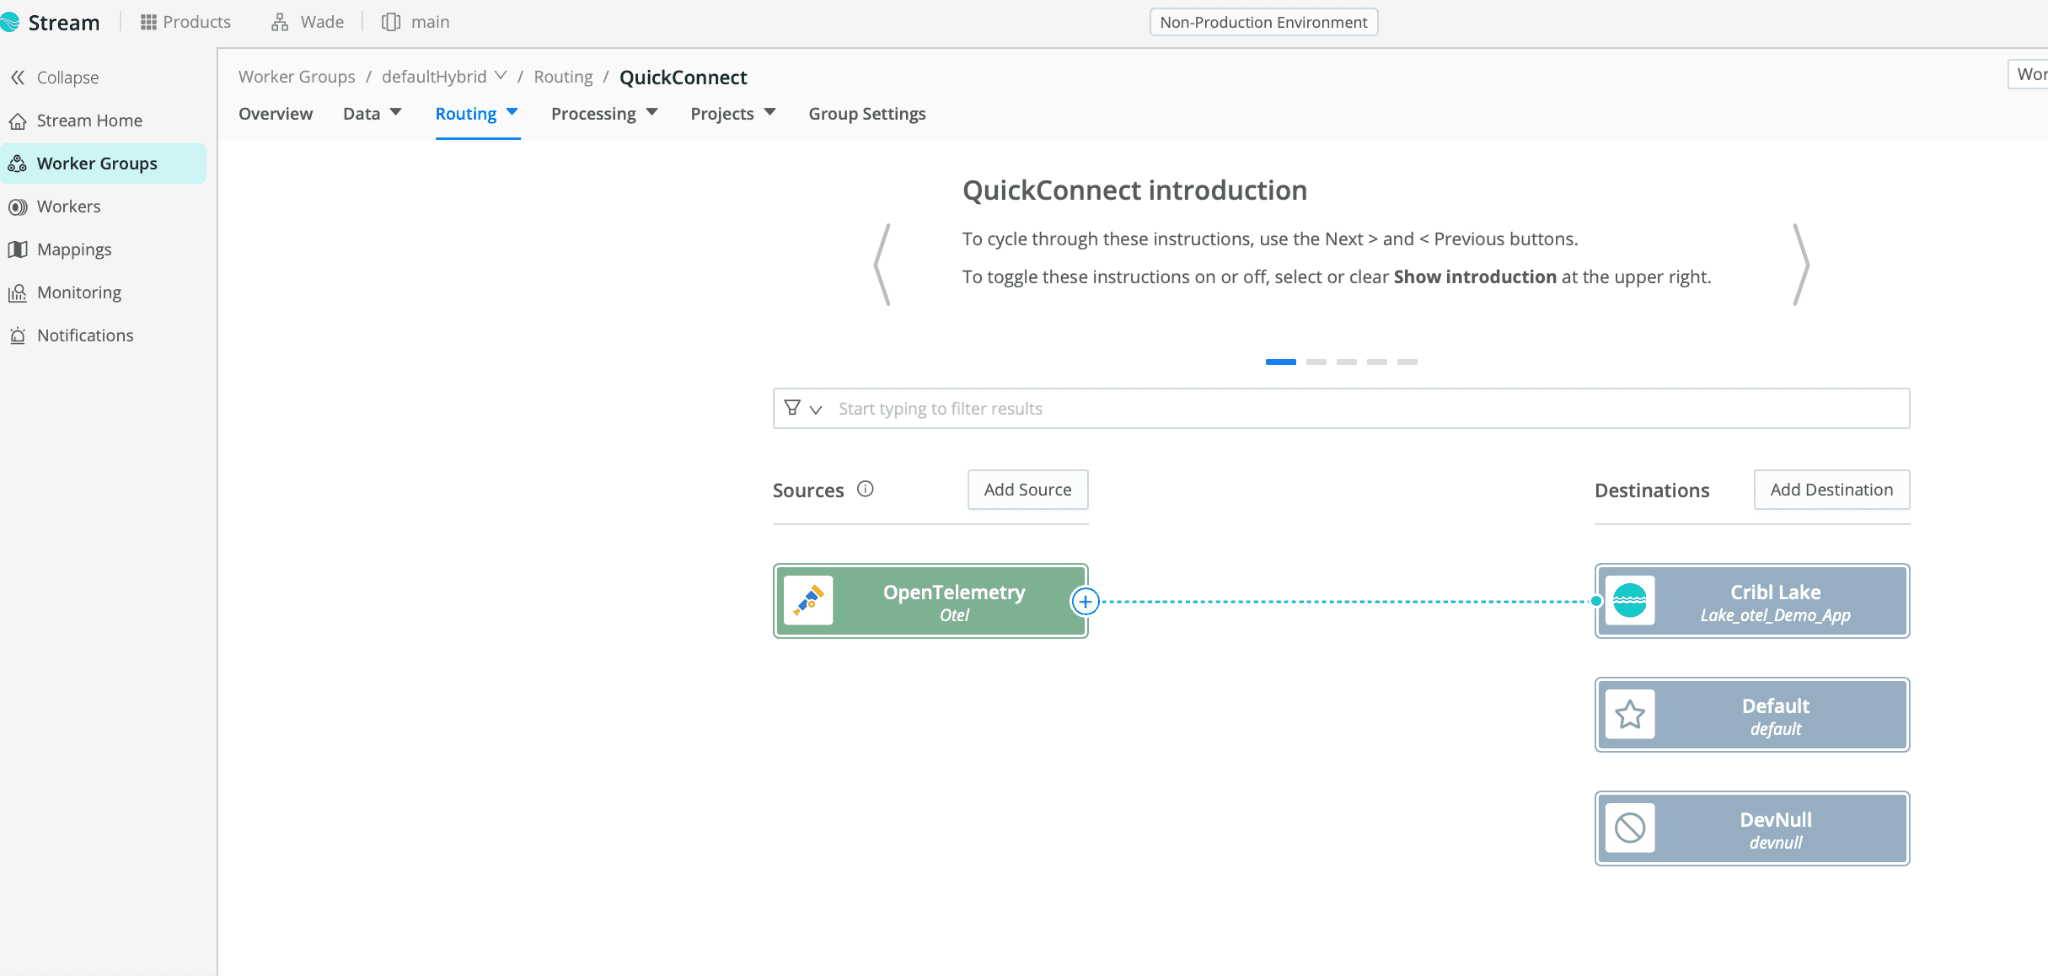
Lastly, using QuickConnect, route the data from the Cribl OTel Source into the new Cribl Lake Dataset.
Now review the data, using Cribl Search. Cribl Lake Datasets work as Cribl Search Datasets, out of the box. Navigate to Cribl Search, then select Data > Datasets. Click the Search button to look at the data in your OTel Demo app Dataset.

Event data from the OTel Demo app should look like this:
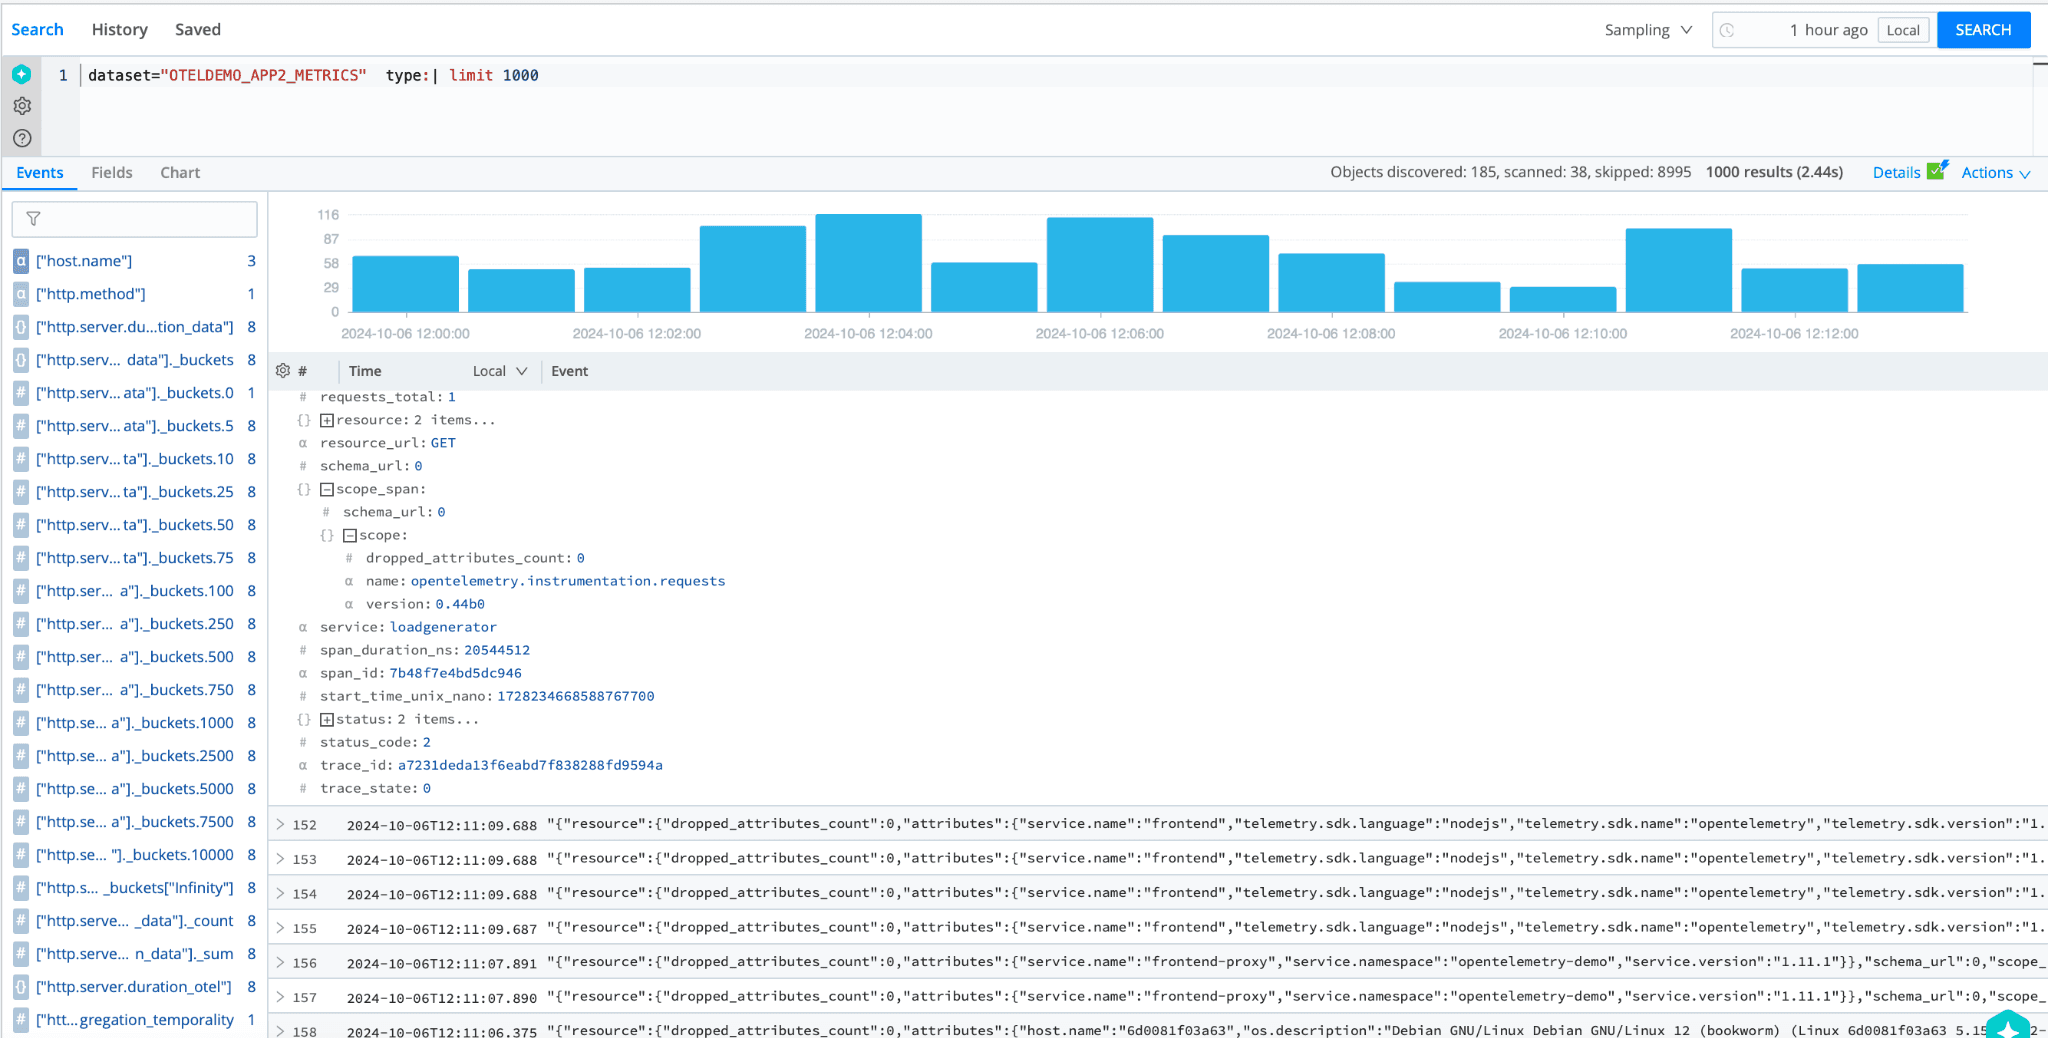
The span data has a span ID and trace ID. We can aggregate all the spans for a single trace by searching for the trace ID.

Great! Now that OTel data is landing in Cribl Lake, create a search that will find the ten longest traces over the last 1hr. The search uses the time window to set the period to 1 hour of data. Then, calculate the total duration of each trace by subtracting the start time of the first span from the last span for each trace by ID. Then, find and sort the top 10 longest traces.
dataset="new_otel_app" | eventstats earliest=findearliest(start_time_unix_nano),latest=findlatest(end_time_unix_nano) by trace_id

| summarize tot_duration=round(sum(latest-earliest)/1000000,2) by trace_id

| top 10 by tot_duration desc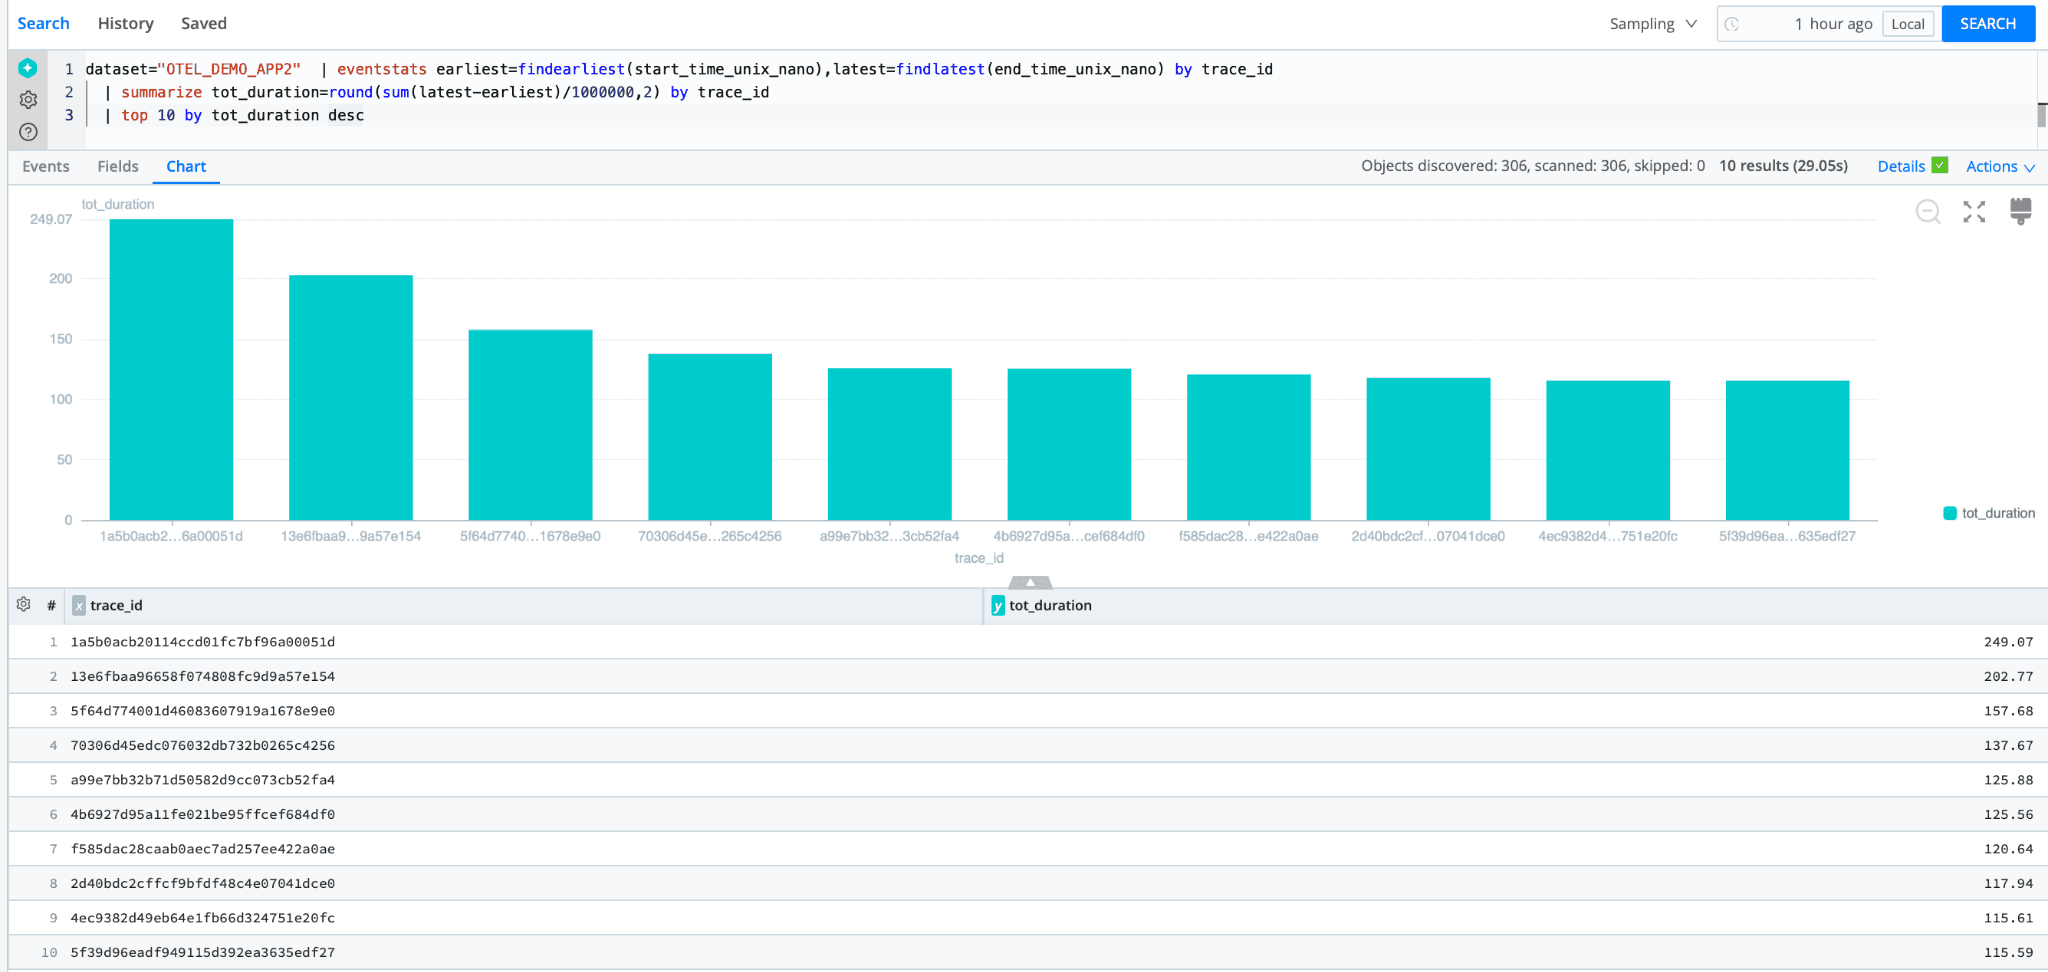
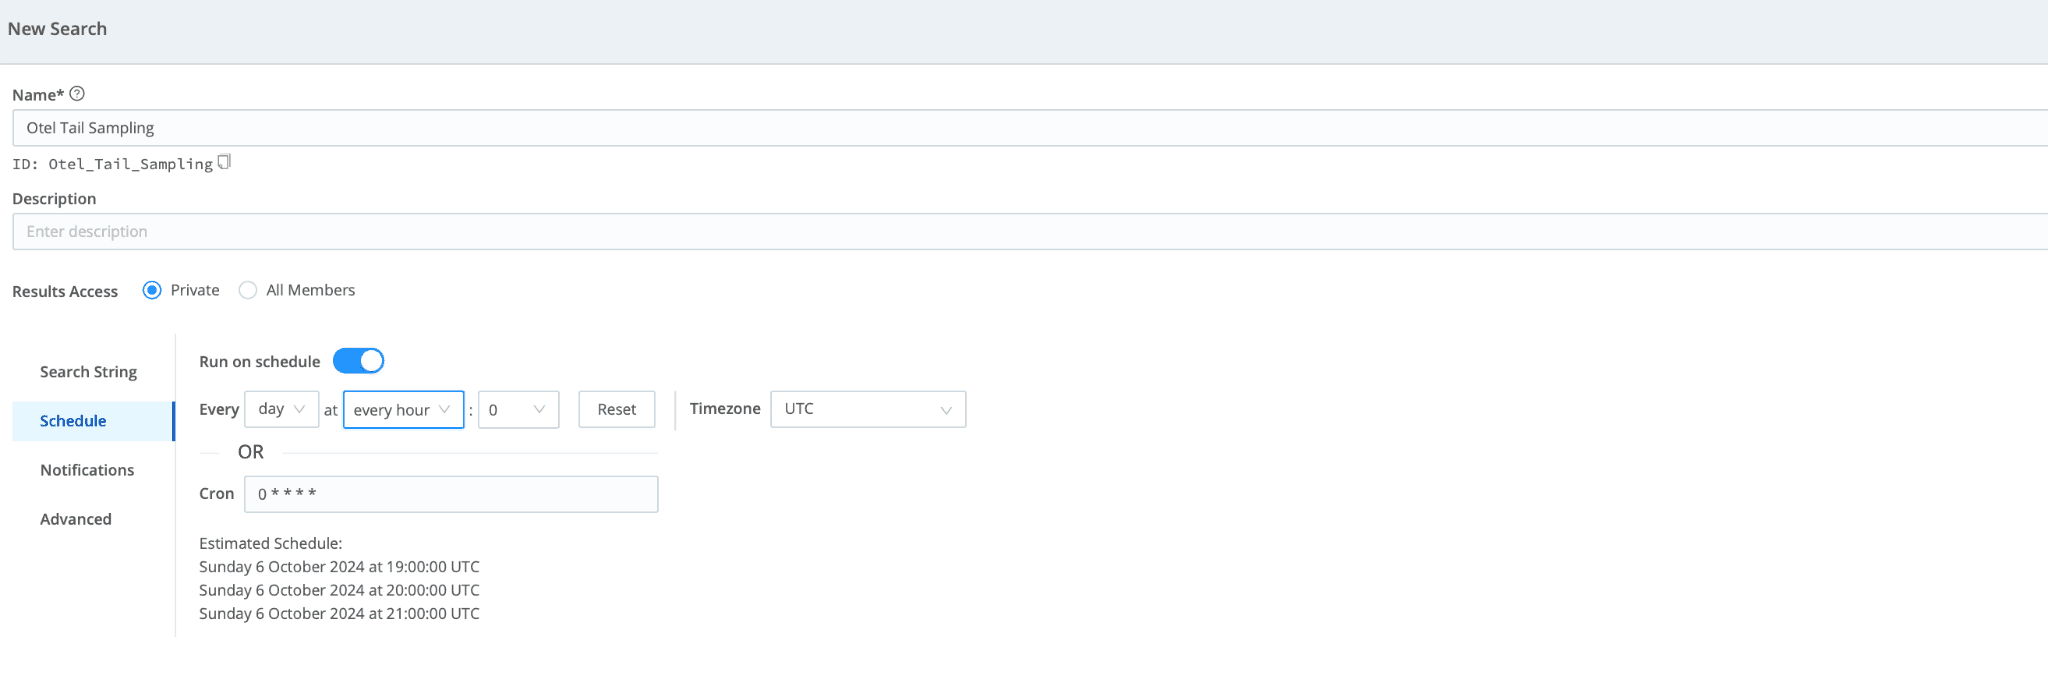
Lastly, schedule the search to run every hour. You can send the results to other APM tools by routing them through Stream: Add the “send” command to the end of your search.
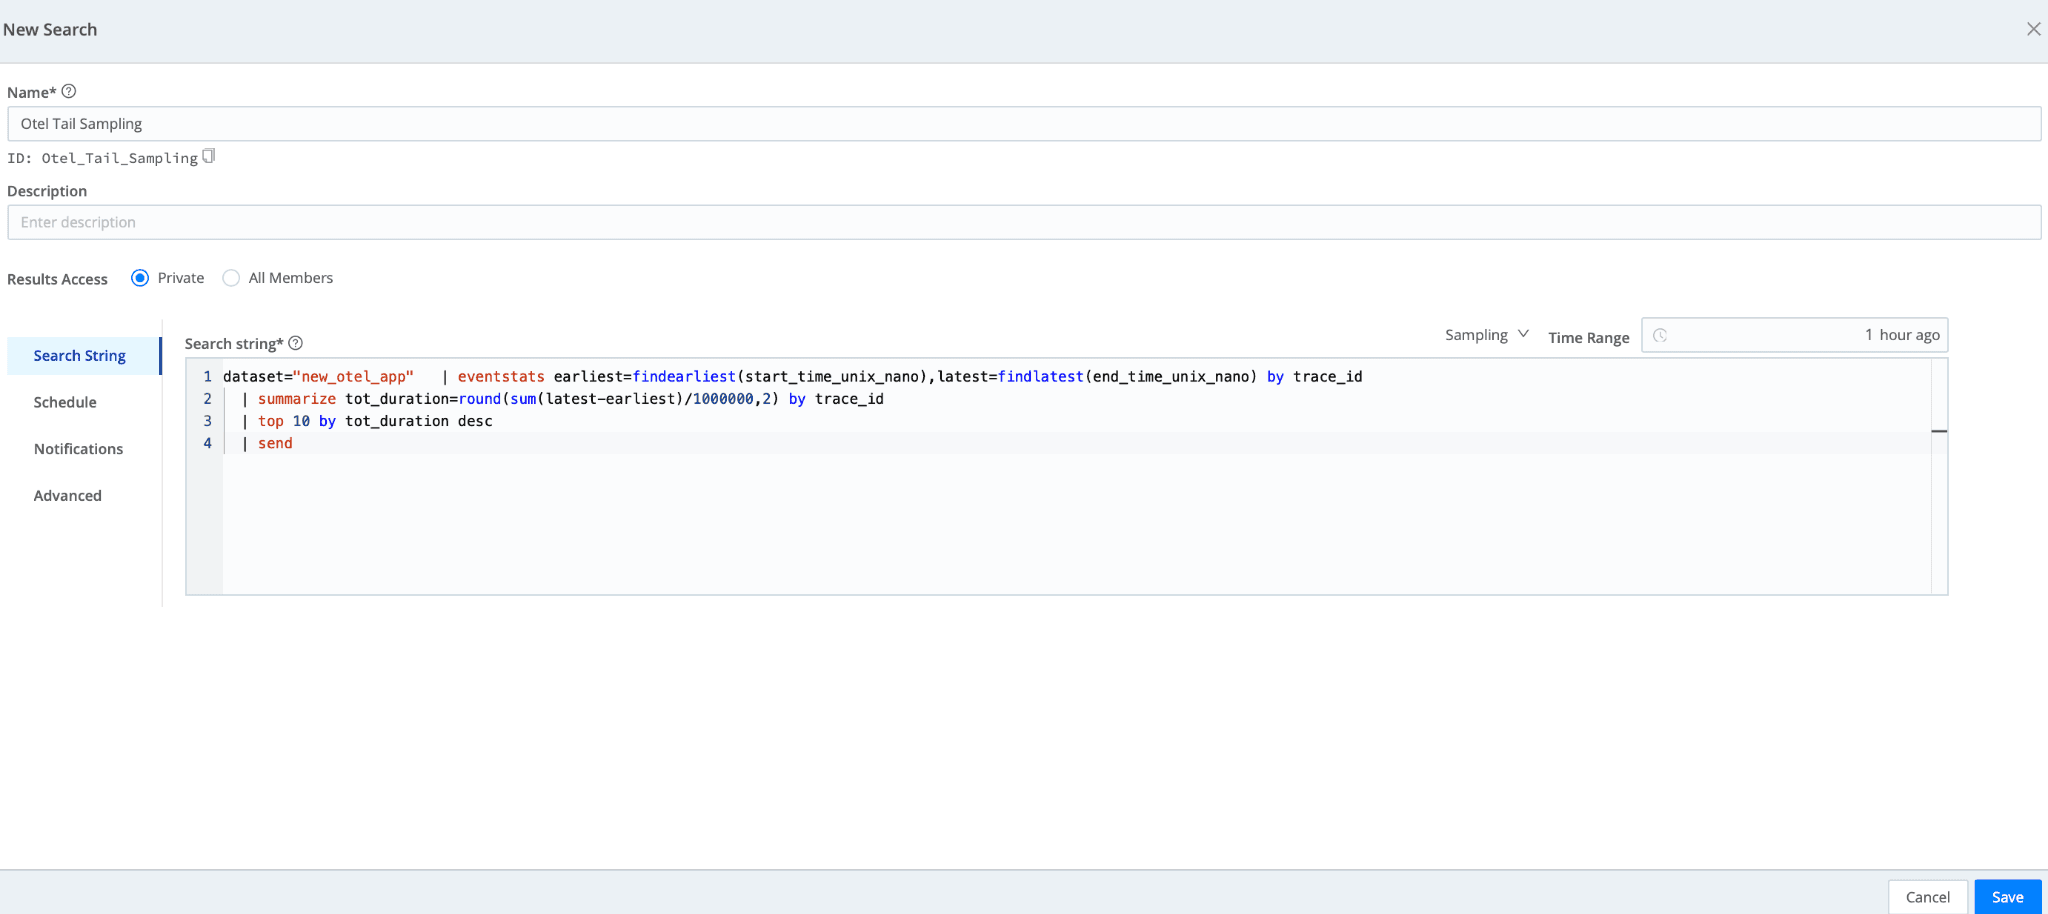
The system now receives OTel data from the Demo app, stores that data in low-cost Cribl Lake, and tail-samples the ten longest traces over the last hour. The sample searches are sent back to Cribl Stream to be routed to your APM destination.
Wrap Up
As observability needs continue to evolve, tail sampling will likely play a pivotal role in helping organizations achieve deeper insights with fewer resources. Tail sampling offers the ideal balance between visibility and cost for OTel traces. Using Cribl Stream and Lake, customers can quickly collect and store OTel traces. With Cribl Search, customers can tail-sample their OTel traces at a significantly lower cost and higher scale than alternatives. This comprehensive approach allows organizations to store and process trace data efficiently and query and prioritize high-value insights in real-time. Cribl’s tailored solutions ensure that observability strategies remain comprehensive and sustainable, balancing detailed trace data needs with data volume and cost realities.


