

It is commonly believed that once data is collected and ingested into a system of analysis, the most difficult part of obtaining the data is complete. However, in many cases, this is just the first step for the infrastructure and security operations teams expected to derive insights. When they launch the company’s SIEM to begin an analysis, they find each set of logs, (operating system, firewall, router, application, etc.) all formatted differently, making it difficult to pull out the key/value pairs and extract the valuable information from the noise.
Cribl Stream has a number of built-in functions to aid operations teams in reformatting and parsing data. Being able to preview and complete these configuration changes prior to ingesting the data, not only reduces the amount of time required for testing, but also makes searches, dashboards, and alerts run more efficiently for end users.
If you’re comfortable writing regular expressions, the Regex Extract function gives you the flexibility to define and parse required fields specific to each individual use case.
However, if you’re less familiar, Grok Patterns provide predefined regular expressions that can be referenced within a Pipeline to extract one or more fields from system logs.
In the remainder of this blog, we’ll review the Grok Pattern library, and use the Grok function to reformat sample logs, giving you all the tools you need to begin transforming the structure of your logs, minimal regex knowledge required!
Grok Pattern Library
Stream ships with a number of Grok Patterns available for end-users to begin implementing on install. By navigating to Processing —> Knowledge —> Grok Patterns, users can review the patterns supported by Stream. We see there are a number of product-specific patterns defined, as well as a file containing core-patterns, which can be adopted for a wider range of use cases.
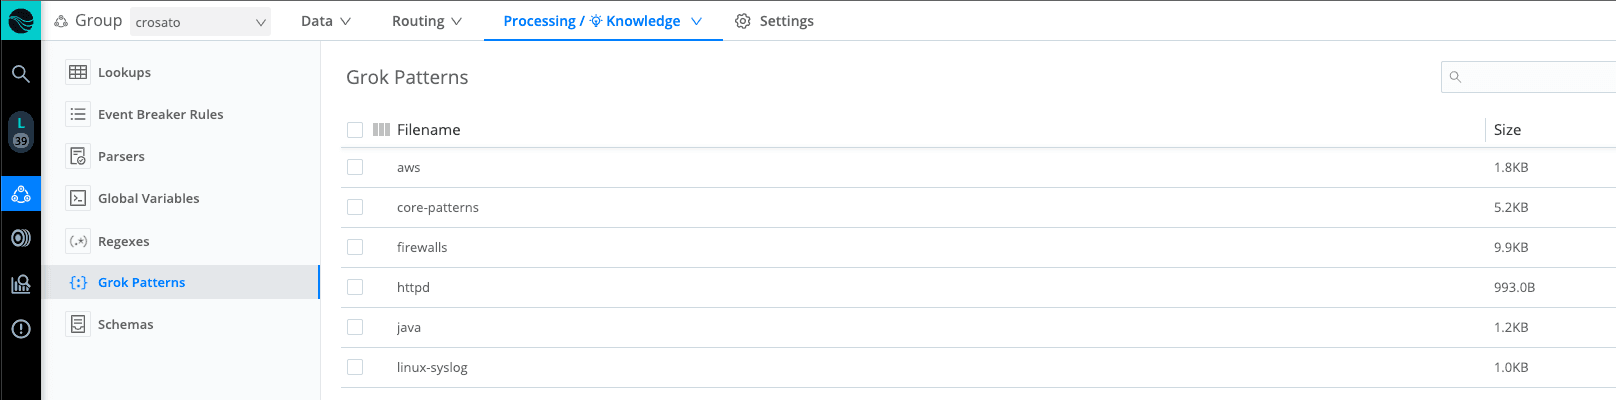
Clicking into core-patterns, we see a list of patterns available for use. The word, written in all capital letters at the start of each line, identifies the pattern name, while everything following defines the regular expression it evaluates to. To call these patterns into use, we need to insert a Grok function into our processing pipeline.
Grok Function
Select + Function and search for Grok to begin configuring. There are very few inputs required to use this function, but formatting will be critical for our success. Patterns must be called in the following format: %{<pattern>:<field>}, where the pattern references the name specified in the Grok Library and the field identifies the new field name for your extraction. The function will scan the Grok Pattern files and if the pattern source field is matched, a new field with the regex results will be created.
Example Use Case: MQ Logs
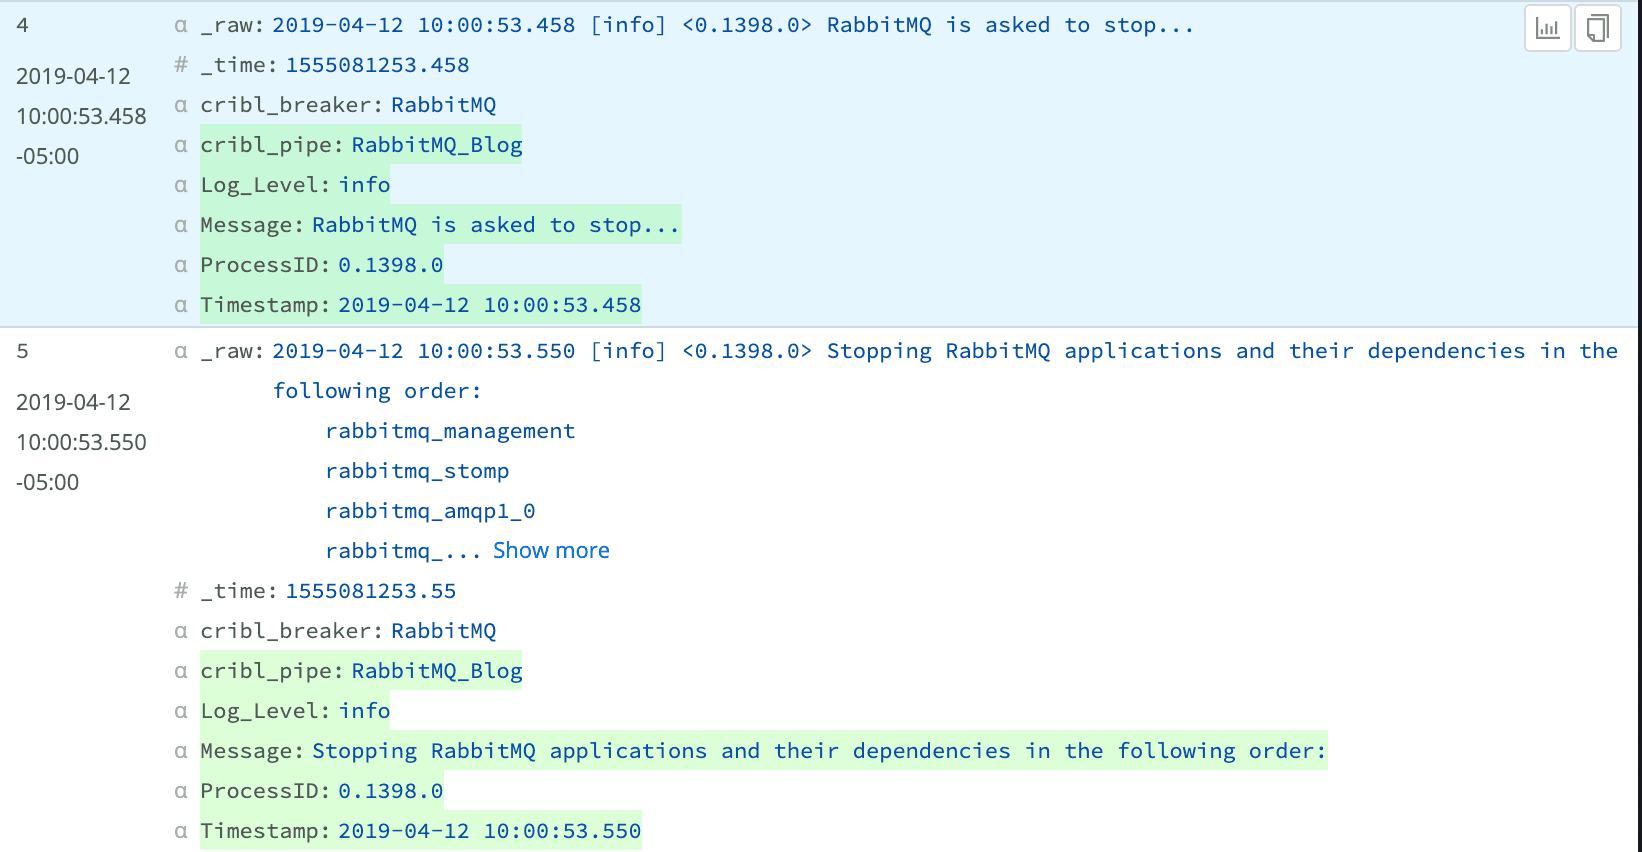
In this example, we’ll be using Grok Patterns to extract key/value pairs from RabbitMQ logs. Messaging Queue logs are a good candidate for Grok Patterns, as they all contain similar information, but are formatted slightly differently depending on the vendor. Reviewing the two sample logs below, we can derive the structure of the events as :
_raw: Timestamp [Log_Level] <ProcessID> Message

Understanding the format of the logs is a great start to help us begin building the pattern input within our Grok function. In the screenshot below, we’ve structured our pattern, following the Grok requirements, identifying the new field names, and including any log specific formatting characters. If we structure our pattern using symbol characters to denote the start and end of fields, we can use generic Grok Patterns (like DATA or GREEDYDATA) and still ensure the correct information is being returned. Further reviewing the ProcessID field, we see the Grok statement is enclosed in \< and \>, to match the format in the raw log.

Now that we understand the required format, we can revisit our Grok Library and identify the patterns to call to extract each field. We’ve identified DATA, LOGLEVEL, and GREEDYDATA as patterns to reference.

When we save and review our output, the Timestamp, Log_Level, and ProcessID fields appear to be complete. However, the Message field has various structures. The first log contains all the information on a single line, while the second uses line breaks to separate input. Because the regular expression defined for GREEDYDATA in the core-patterns file doesn’t account for line breaks, we are losing some information from the Message field in the second log.
To solve for this, you can create your own Grok Patterns and add them to the library to be referenced across source logs in your environment. In the screenshot below, we’ve created a new pattern called, GREEDYMULTI to account for line breaks within fields.

When we update the Grok function to call the new pattern, save and review the output, we now see complete Message fields for both sample logs.


With their reusable structure, predefined Grok Patterns can help organizations clean their logs, pulling out critical key/value pairs, with little regular expression experience necessary!
Are you interested in testing Grok Patterns to see how they could enhance logs in your environment? Sign up for a Cribl.Cloud account and instantly launch an instance of Stream Cloud. You can add sample data and start customizing your logs today! Want to try out Stream without signing up? Check out the Stream Sandbox to use a hosted version with sample data.