

Are you managing a Cribl environment? We love that for you; you’re at the forefront of complex data orchestration. As the steward of this dynamic data ecosystem, you have to manage and optimize the flow of information from diverse sources. As data volumes grow, the struggle gets even more real.
No worries, though. You’ve got Cribl Stream.
Monitoring Stream is critical. When you do it effectively, you can address issues, enhance operational efficiency, and maintain peak performance in your data strategy.
Elasticsearch is one way to do that, with its capabilities for quick searches, ability to handle large data volumes and AI-driven insights.
Whether you’re already an Elastic shop, are interested in custom dashboard functionalities, or want to explore some cool features, Cribl offers the flexibility to direct Cribl Metrics/Logs to your chosen destination.
Let’s get into it.
How?
Send metrics to Time Series Data Streams (TSDS) for 70% less storage. Crank that up with the Downsample ILM action for even more disk space savings! 🚀✨
Logs are saved in Data Streams.
Link Cribl Internal Metrics and Logs to Elasticsearch with QuickConnect.
We made dashboards and alerts for you—just import them into Kibana.
Getting Started
See how quickly Elasticsearch can help troubleshoot your Cribl setups.
This short demo only uses Cribl Stream, but full instructions are over on GitHub, covering:
Elasticsearch preparation with Index Templates
Cribl Pipeline for mapping conflicts and ECS support
Populating leader logs for the included Dashboard
Cribl Configuration
Go to Stream > Manage > (Select a Worker Group) > Data > Destinations and enter
elasticsearch
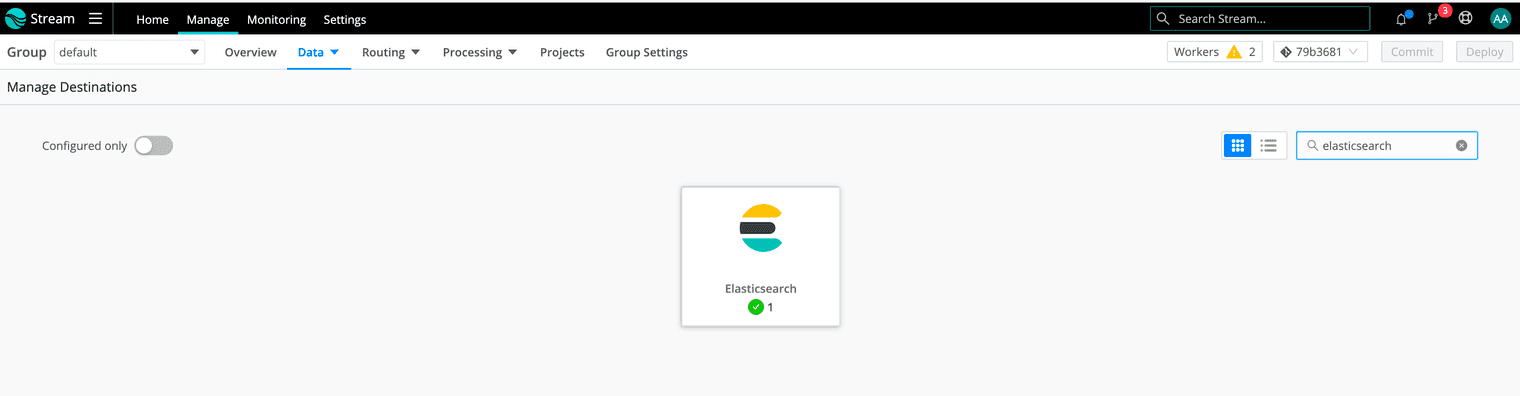
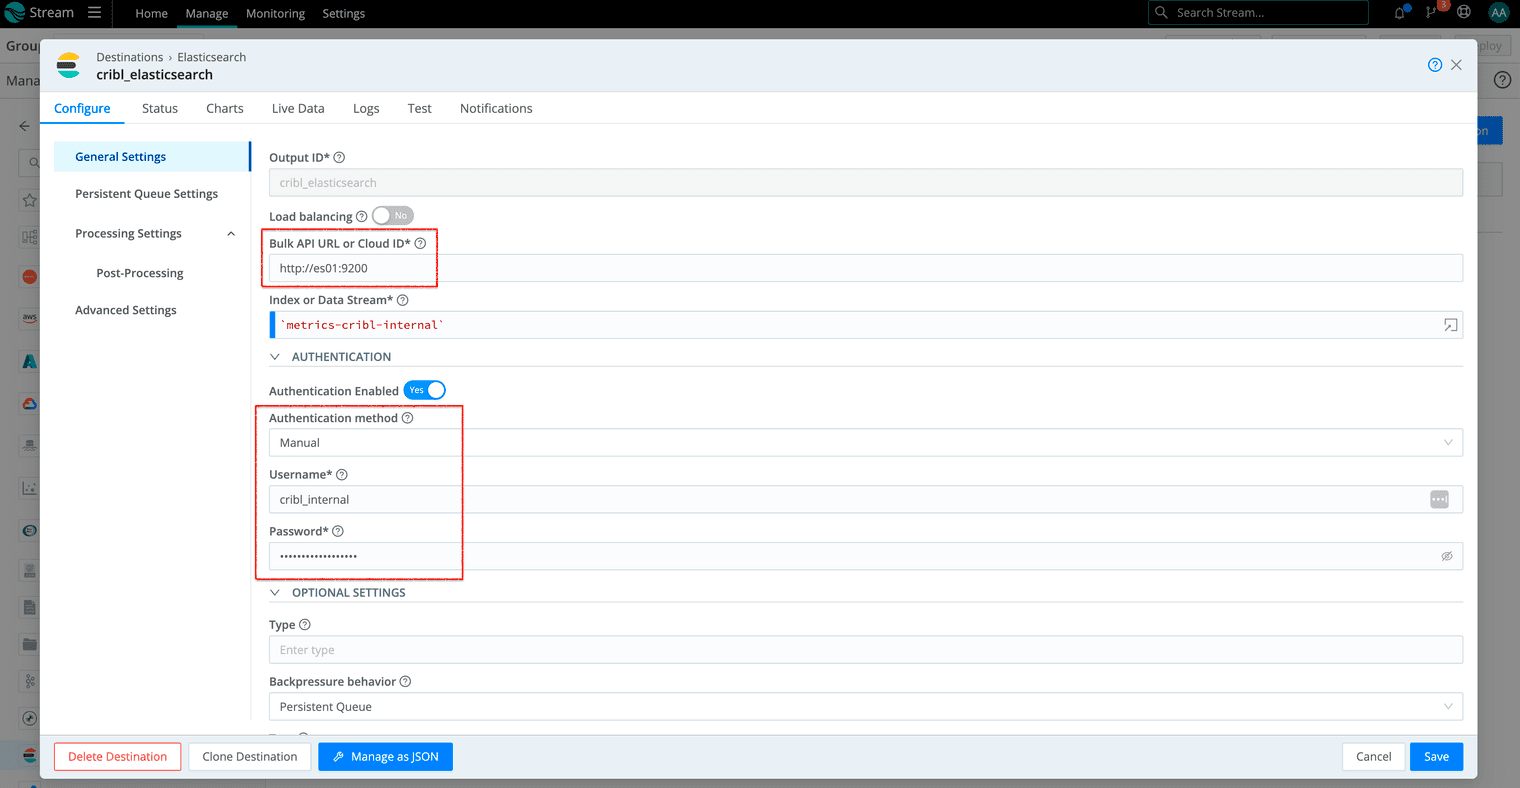
Go to Elasticsearch and then Add Destination
Set Output ID to cribl_elasticsearch
Set Index or Data Stream* to `
metrics-cribl-internal`Fill in the appropriate Bulk API URL and Authentication for your Elasticsearch cluster:
Save and go to Data > Sources and enter cribl
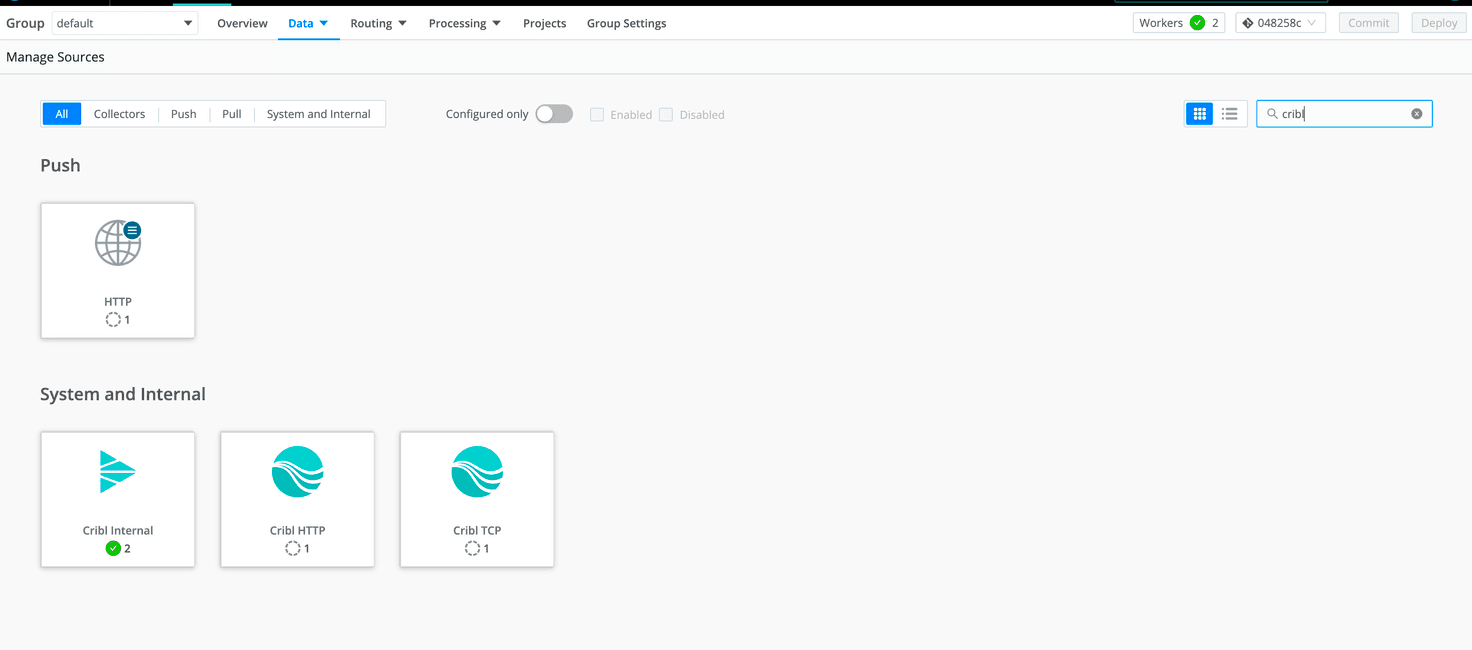
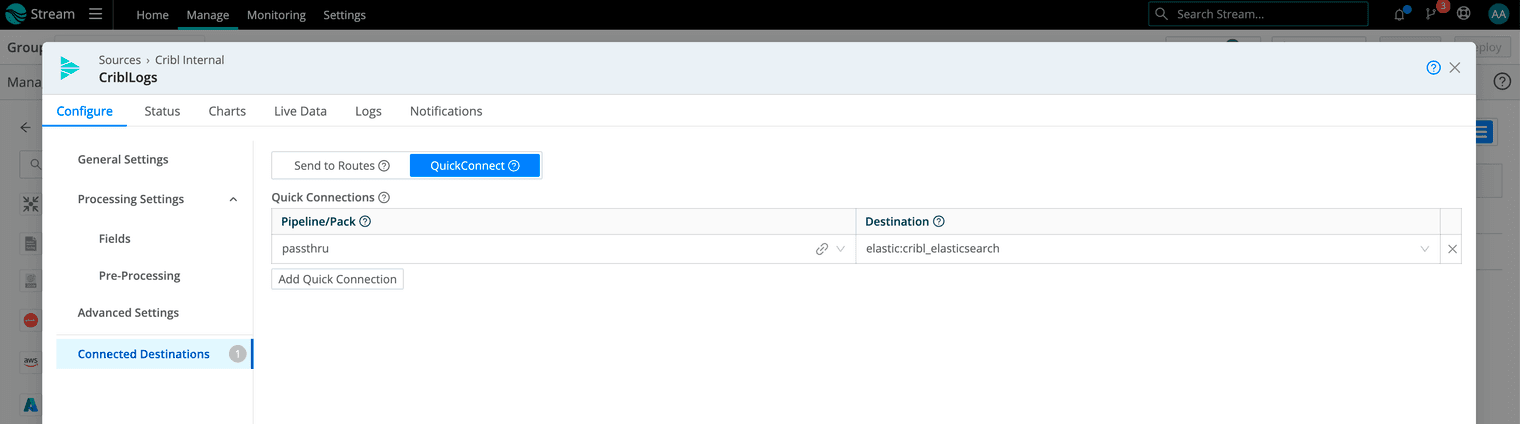
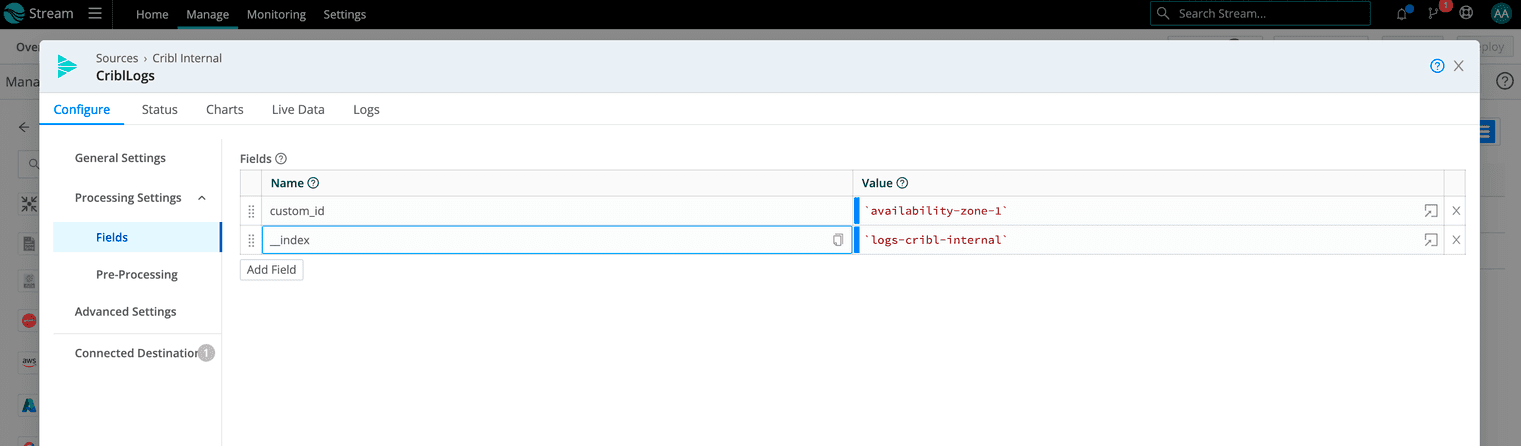
Go to Cribl Internal and then CriblLogs
Go to Connected Destinations to enable QuickConnect with your Elasticsearch destination and the
passthrupipeline:
Go to Pre-Processing and set an __index field to logs-cribl-internal. (Optional: set a custom value in the
custom_id field)
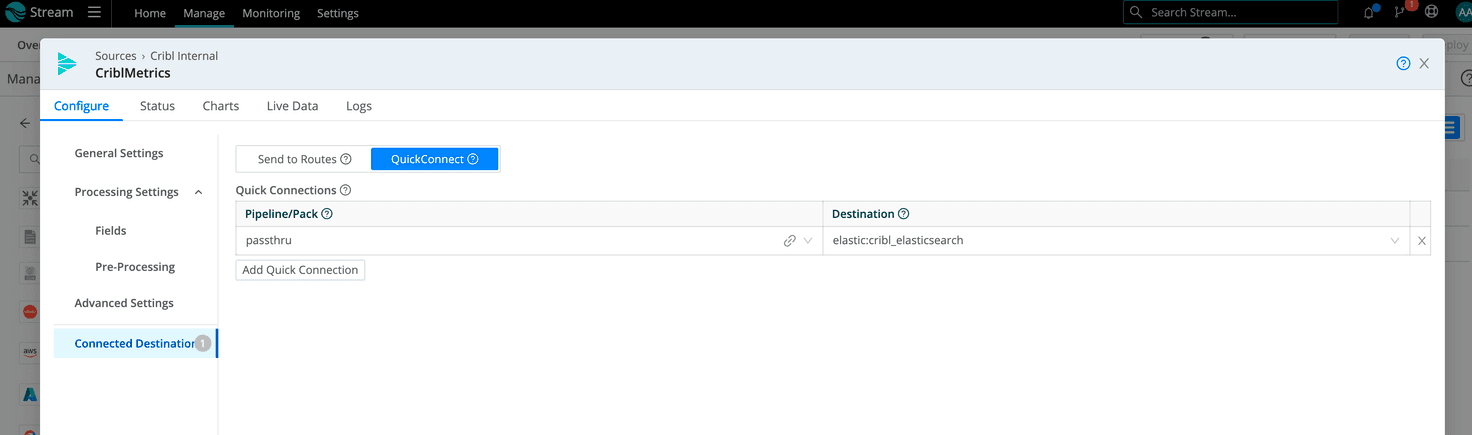
Save and select CriblMetrics
Go to Connected Destinations to enable QuickConnect with your Elasticsearch destination and the
passthrupipeline. (Optional: add the cribl_metrics_rollup pipeline for reduced storage by aggregated metrics)
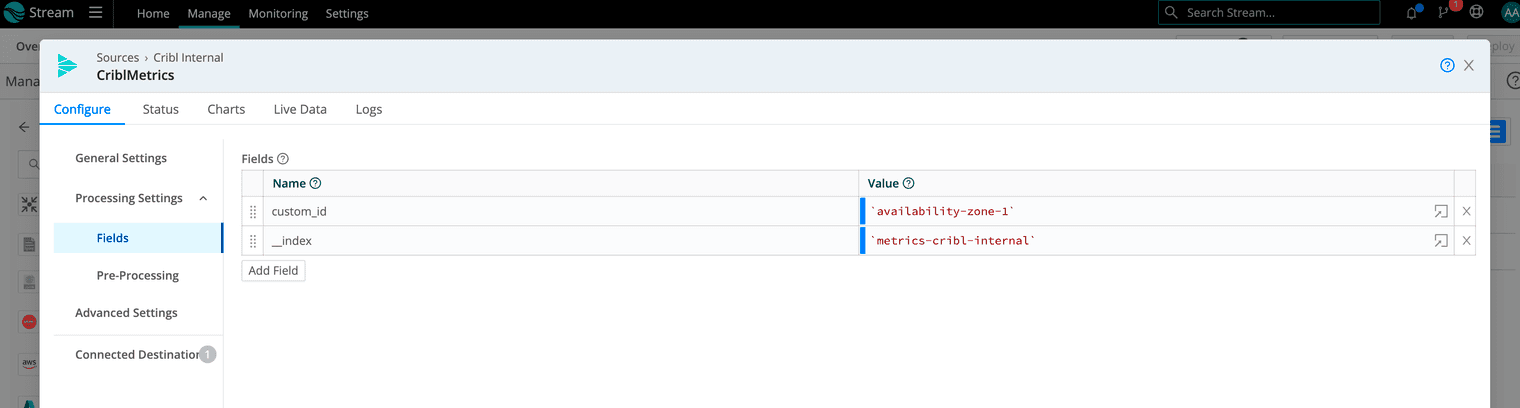
Go to Pre-Processing and set an
__indexfield to metrics-cribl-internal. (Optional: set a custom value with custom_id here too)
Save and then commit and deploy the changes
Kibana Configuration
Dashboards, as well as Rules, can be imported with the Kibana UI:
Download this file (link).
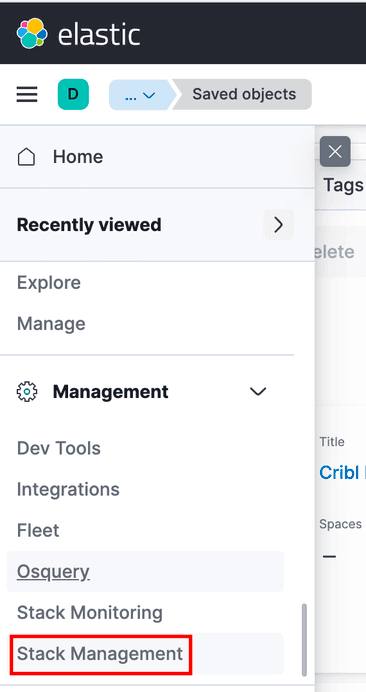
Sign in to your Kibana space.
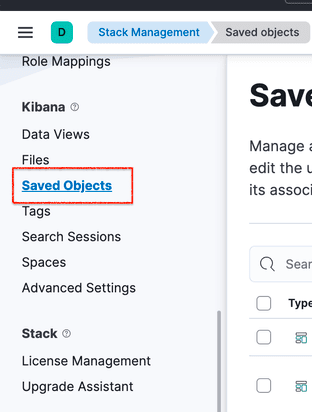
Go to Management > Stack Management:
Go to Saved Objects:
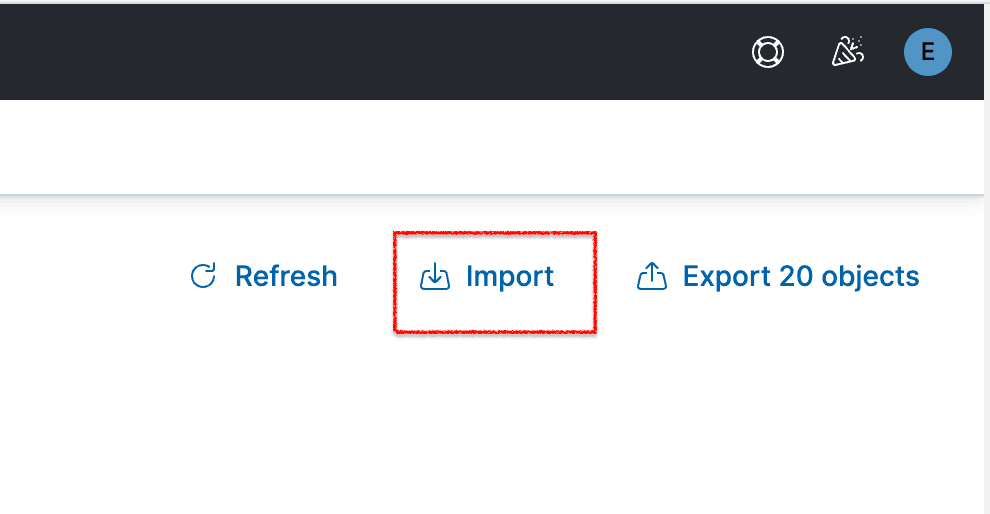
Select Import:
Click Import under the Select a file to import section and select the downloaded file:
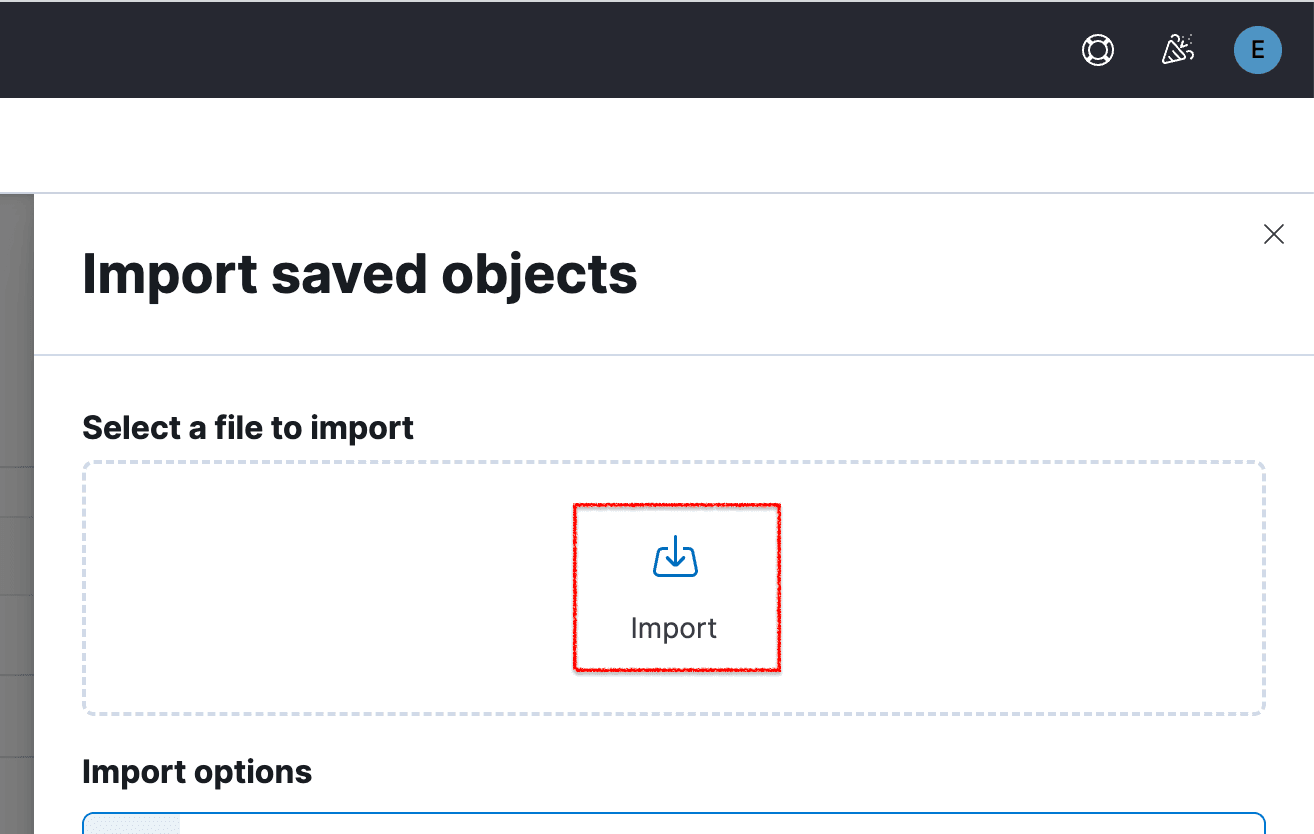
Click Import again:

You should now have imported all available Dashboards and Rules! If you’re running into issues here, note that the Kibana setting xpack.encryptedSavedObjects.encryptionKey may need to be configured.
The Demo
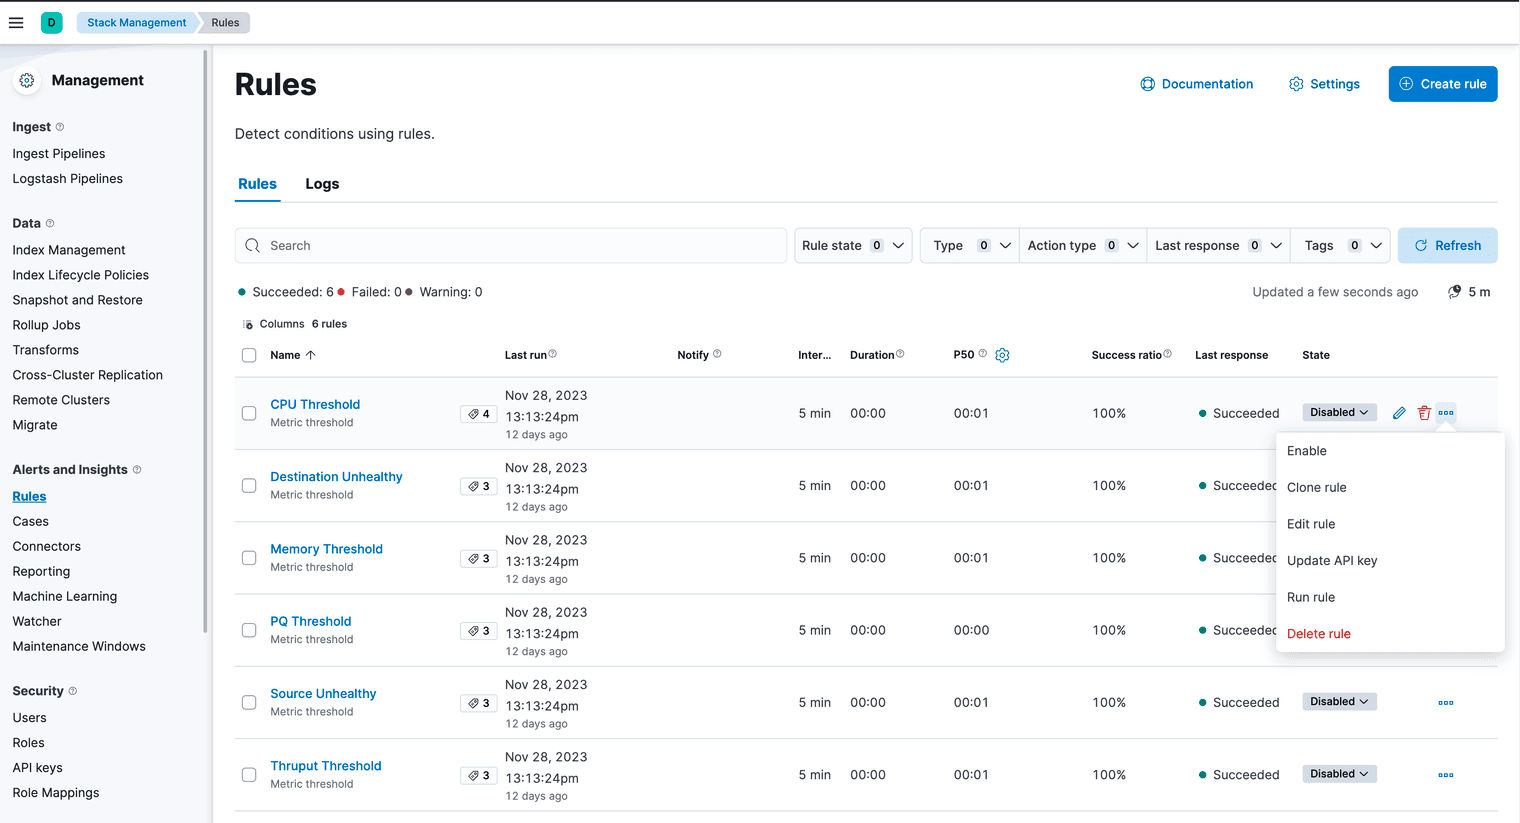
From Management > Stack Management > Rules, you can now enable the included Rules:
Go to Dashboards and select the Cribl tag to filter for all Cribl dashboards easily:

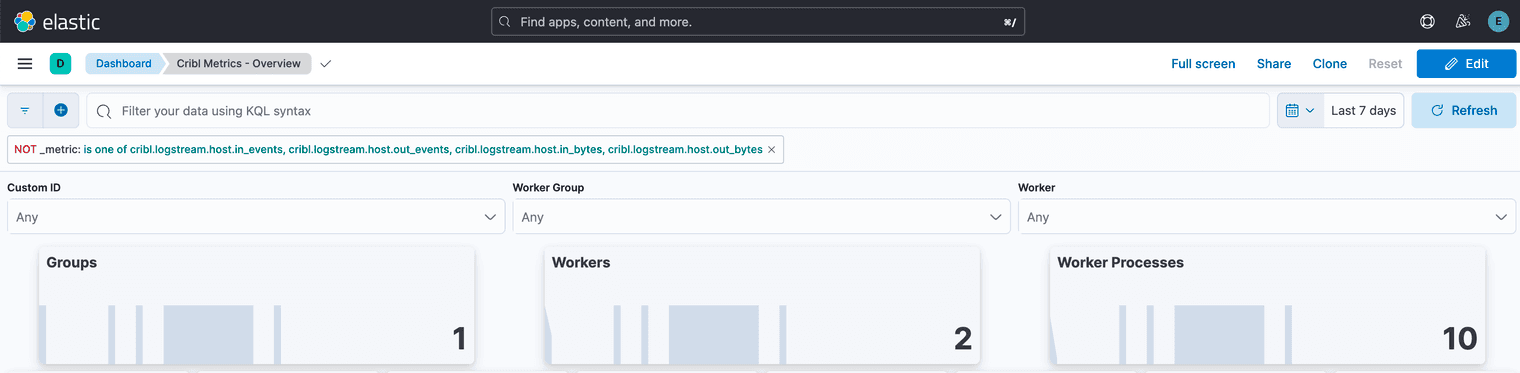
Go to the Cribl Metrics – Overview dashboard—a go-to hub for effortlessly gauging your cluster’s performance.
Quickly see if Groups, Workers, or Worker Processes stopped reporting metrics:
At a glance, spot outliers for workers in the Overview. Afraid of load distribution imbalance? The dashboard shows this too:
You can Drill In to the details of Worker Processes or Sources and Destinations:
After narrowing down a time range, we can open the Cribl Home – Logs dashboard, to see if the logs provide clarity:
What’s Next?
So now you’ve seen how quickly and effectively we can monitor Cribl. Clone and create your dashboards or use some of the features not mentioned here, such as Machine Learning or ES|QL.
Also, follow the instructions on our GitHub page for the whole experience. Feel free to contribute or report issues there.
You’re welcome to share feedback and ideas in our community slack channel. Are you not a member of our Slack Community? Join us!