

OpenTelemetry is starting to gain critical mass due to its vendor neutrality and having worked in the APM space for the last five years. I can see the appeal. Using OpenTelemetry libraries to instrument your code frees you from putting vendor libraries in your codebase. The other challenge most customers face is balancing cost versus visibility. While effective, most APM solutions are costly. When an issue does occur, having an APM solution is invaluable, but for the most part, it’s costly and comparable to flood insurance.
For this reason, you have to decide which applications are the most critical, so you end up instrumenting a handful of applications to control cost. In a perfect world, cost is not an option, so you can instrument all your applications. Sampling is an attempt to control volume, and most solutions today use head-based sampling. More advanced solutions have moved to tail-based sampling to capture a complete distributed transaction and index a sample of successful and unsuccessful transactions. This is where Cribl Stream + Cribl Search comes into play.
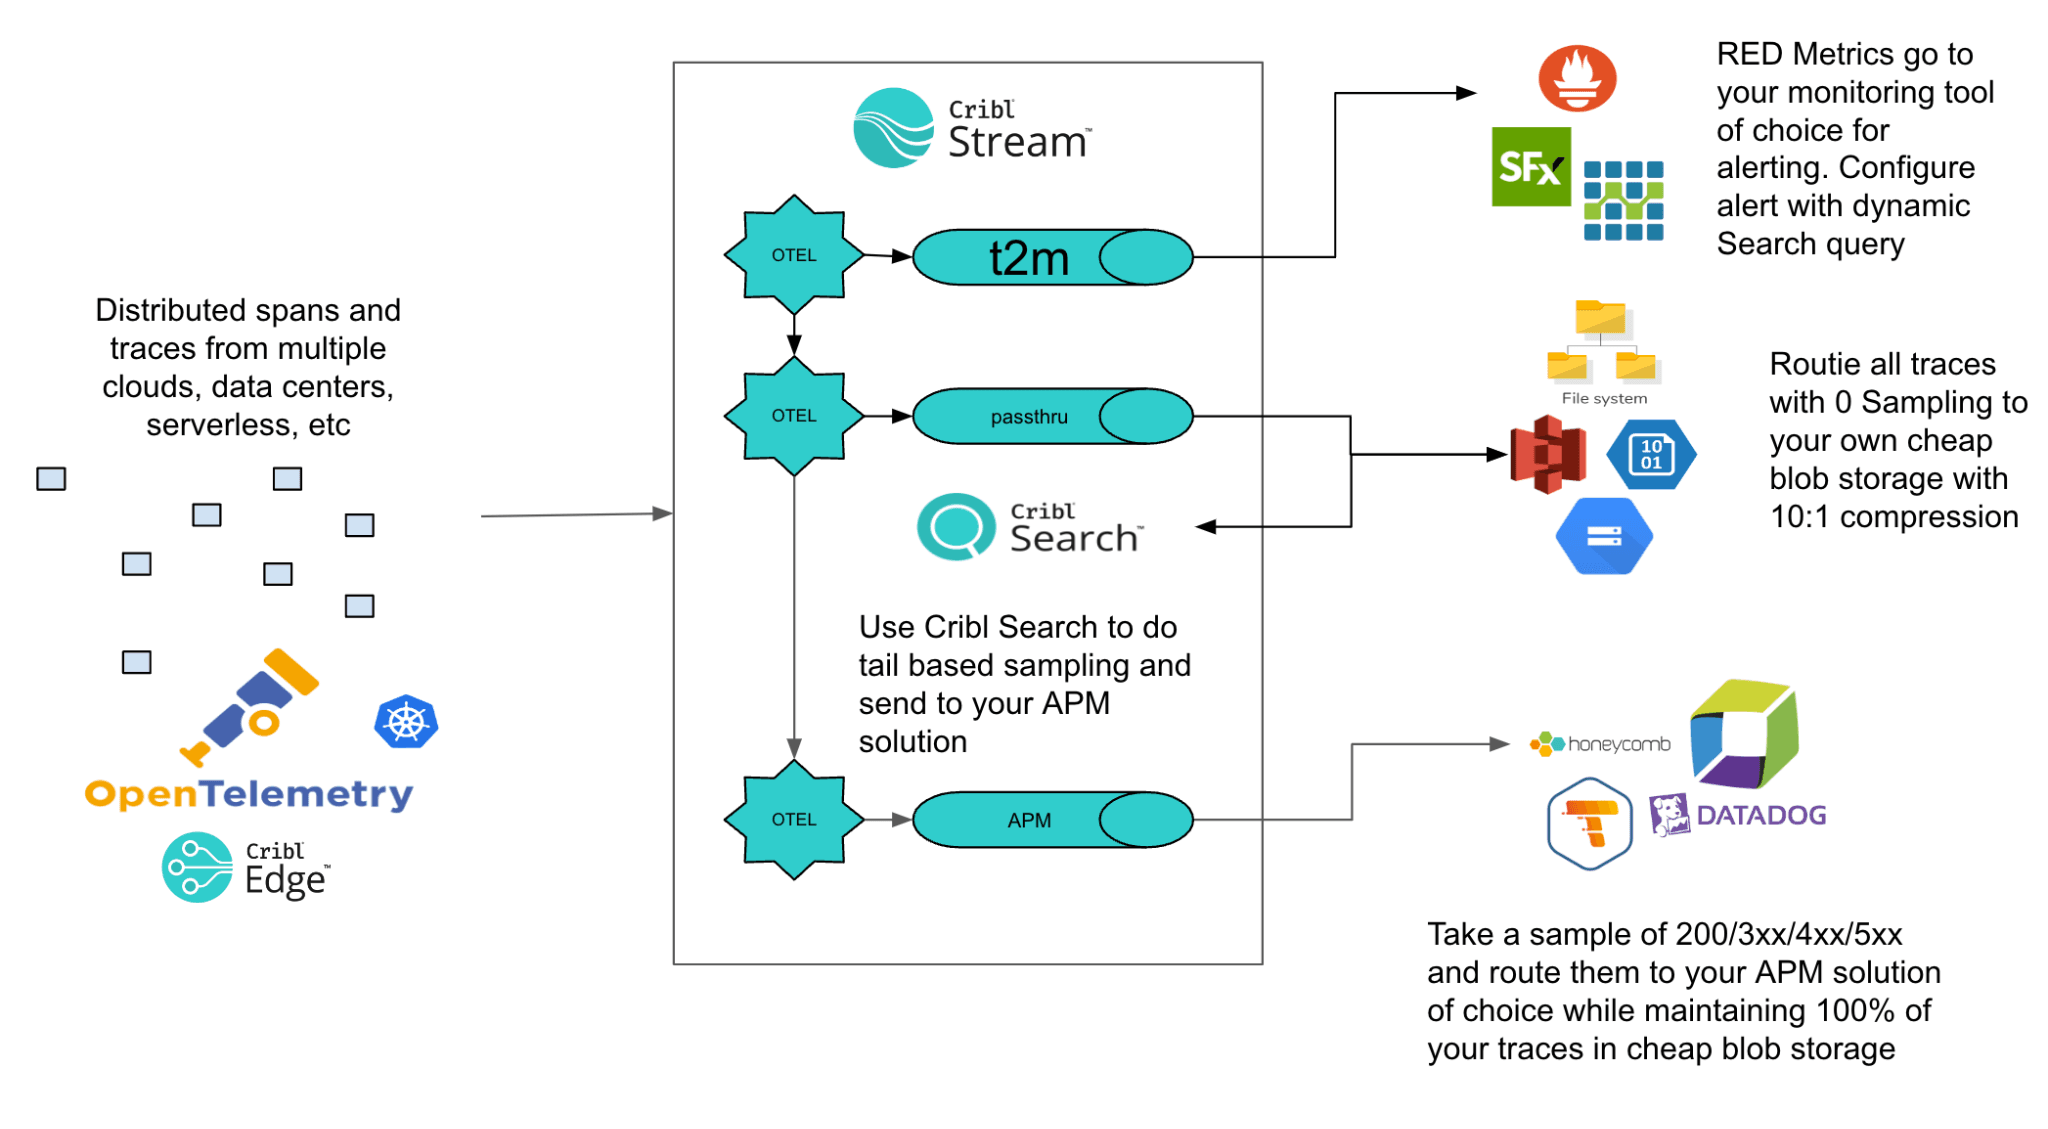
Stream allows you to calculate RED (Rate, Error, and Duration) metrics and send them to the monitoring tool of your choice for dashboarding, alerting, and correlation. While simultaneously sending 100% of your traces and spans into your own blob storage for long-term retention, analysis, and tail-based sampling. This approach offers a balanced APM solution, ensuring cost control without sacrificing observability.
How It Works
In this example, I’m using Cribl Stream to replace the OTEL Collector. You can send your traces directly to a Cloud Stream gRPC endpoint. Here we will scale up the infrastructure to meet the throughput of your transactions. Our goal here is choice. If you still want to use the OTEL collector, you can set Stream up as an OpenTelemetry gRPC or HTTP endpoint. Next, use our OpenTelemetry pack to convert your Traces to RED metrics. RED stands for Rate, Error, and Duration. The pack will generate these metrics along with service and resource_url dimensions for correlation and to help keep cardinality to a minimum.
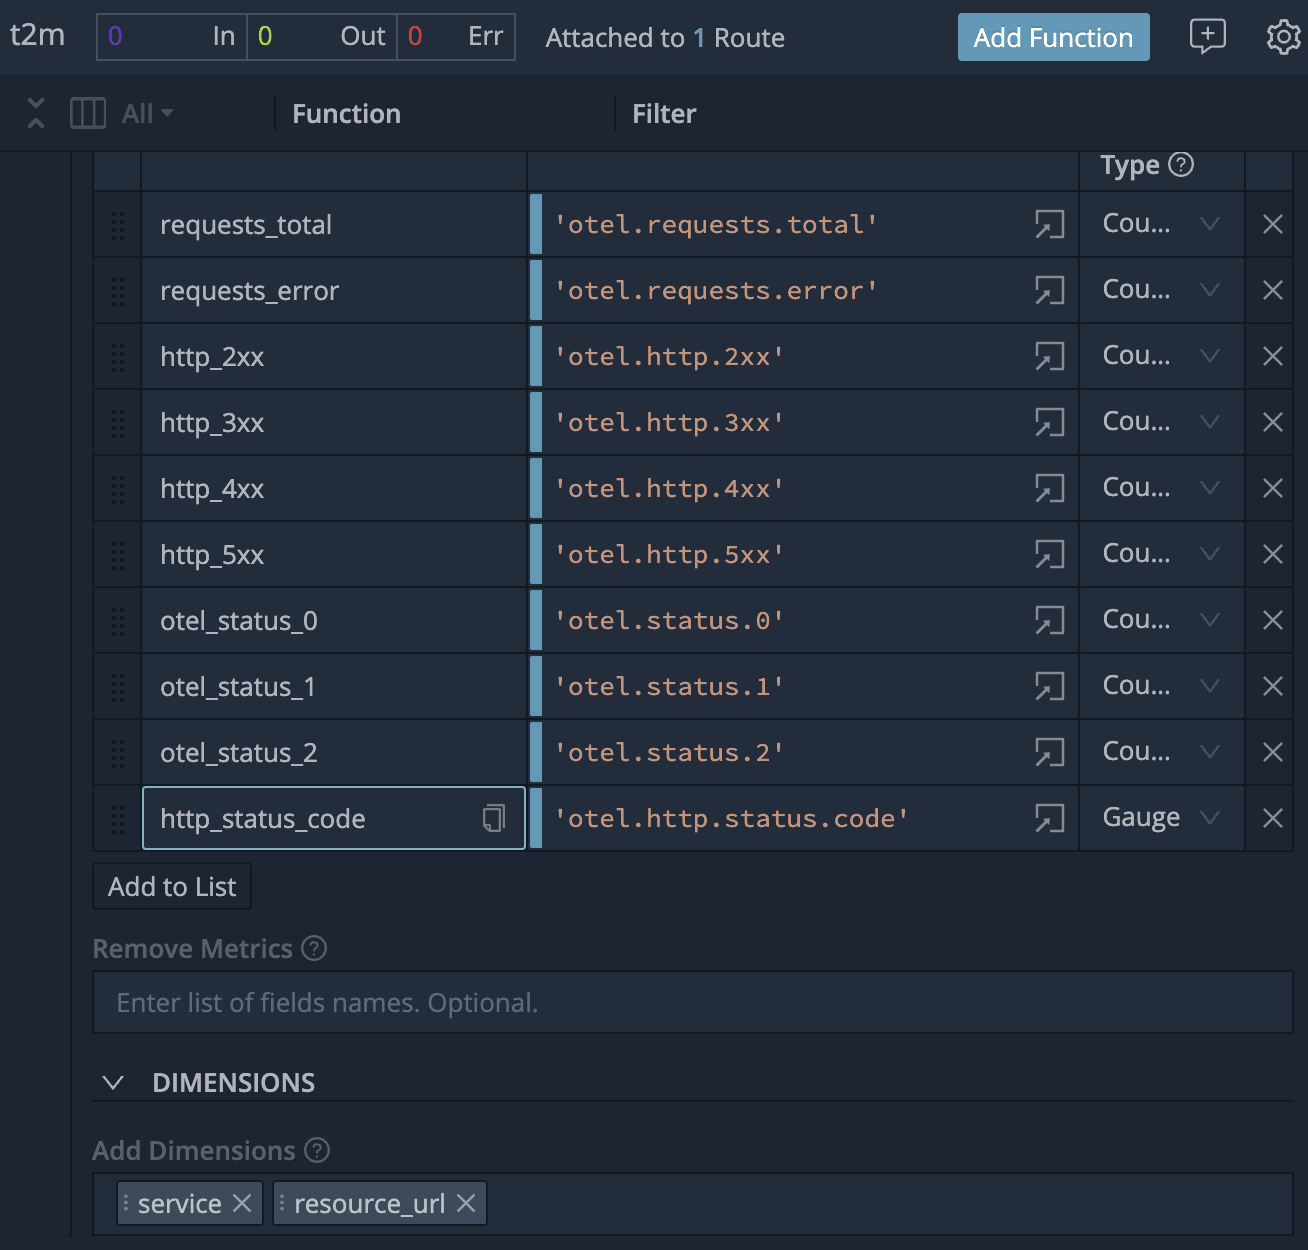
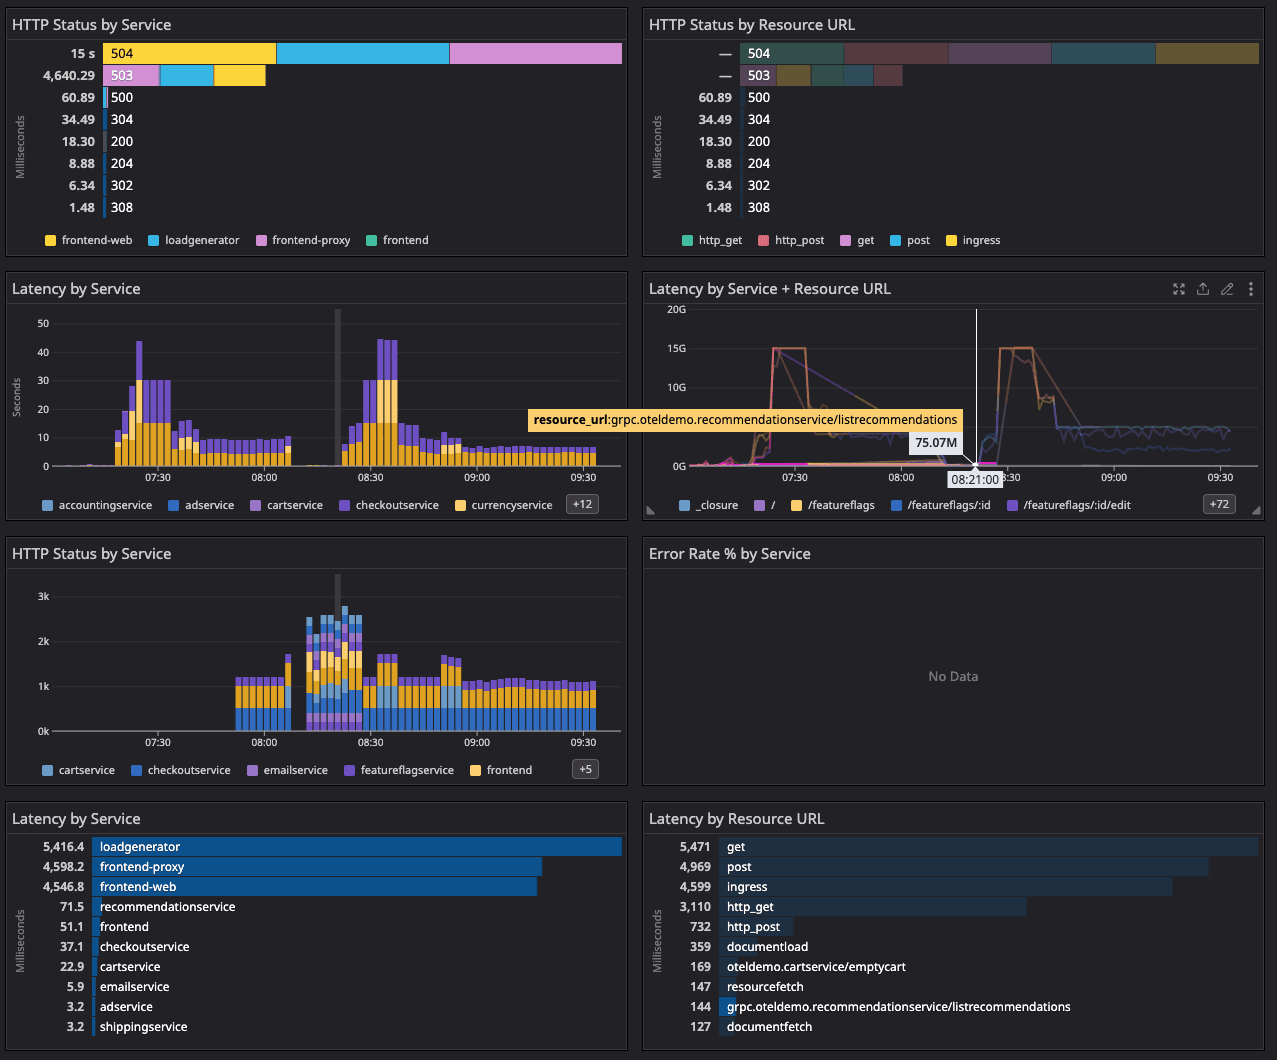
From there, you can send them to your monitoring tool of choice for dashboarding and alerting. The OTEL pack will generate the duration, hit rate, and error rate for each service and resource URL. This will allow you to create a dashboard of leading indicators to help alert you when an issue arises.
Metrics are now flowing into your TSDB. At the same time, we are sending all raw traces to cheaper blob storage. See my other blog post for possible lifecycle policies and retention strategies
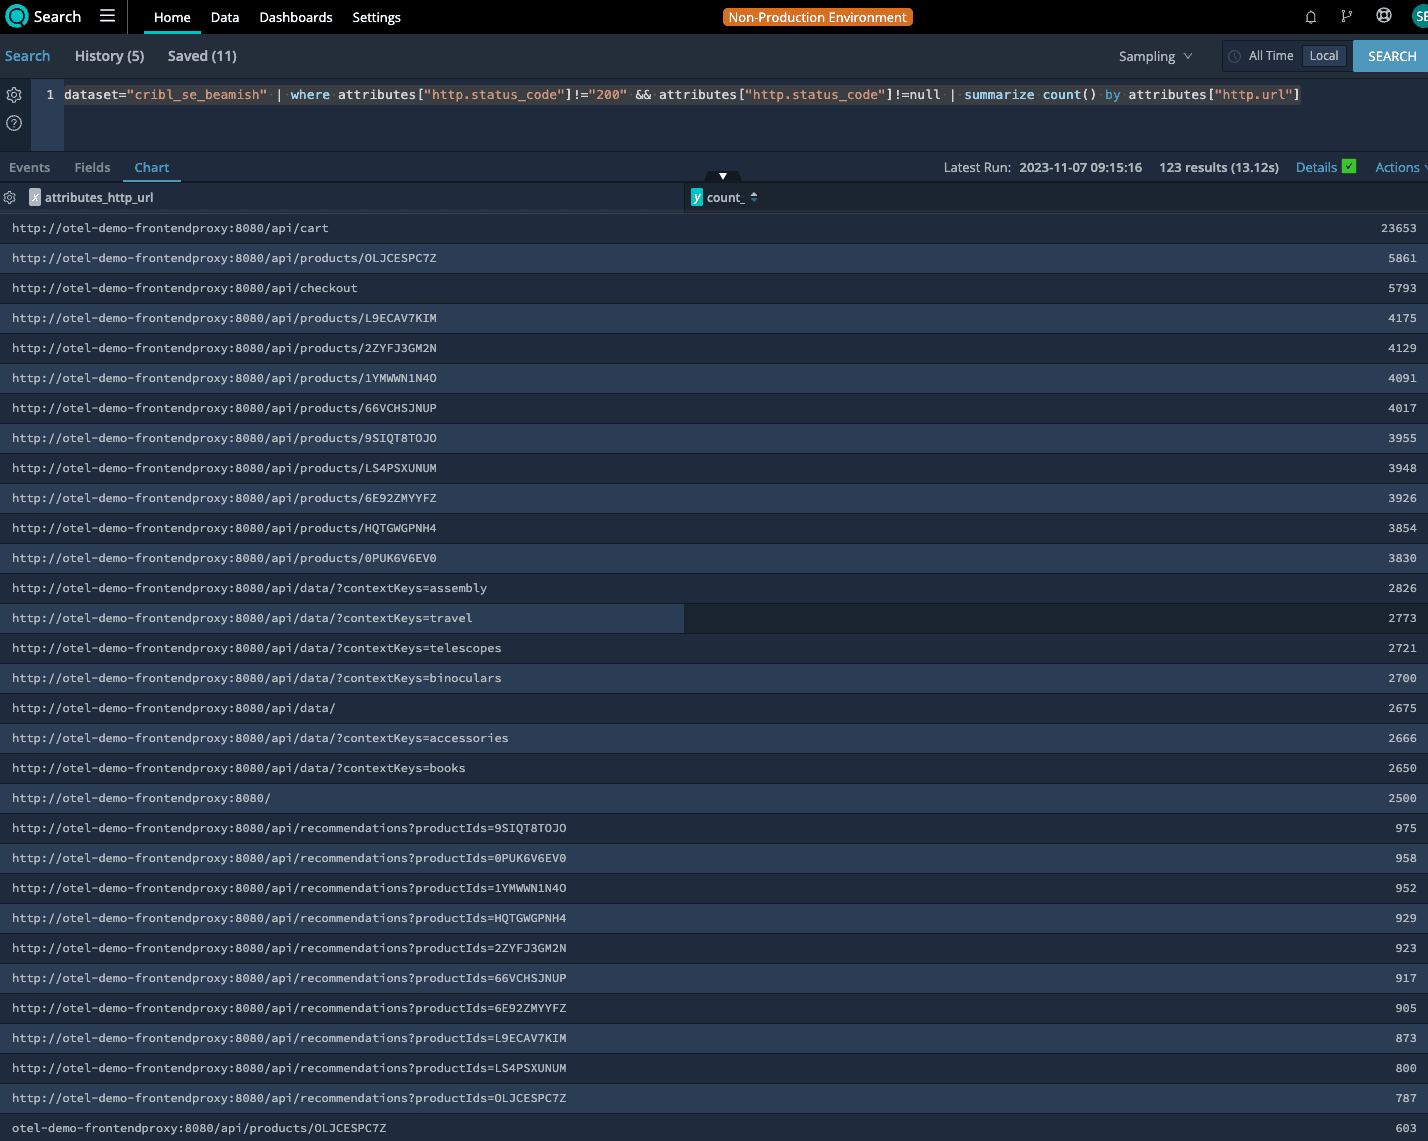
This is where Cribl Search comes into play. We use blob storage as a buffer to collect 100% of all traces before using tail-based sampling to send them to your APM tool of choice. Using cheap, durable blob storage is a great way to keep costs under control. Not only are you using lower-cost storage, but high-volume data is being compressed 10:1. Once the traces have landed in blob storage, you can use Search to find slow or unsuccessful transactions, generate top lists of failed resource_urls, and drill deep into the details of failed transactions. Here you can see URLs that have failed most frequently as a starting point to find the root cause of the failures.
This search is a top list of the slowest transactions by trace_id. This is the root level key that ties in all spans. Pivoting from this list, you can drill into each specific transaction.
Pro Tip: Write traces to the local file system and use search in place to find your Exceptions and stack traces.
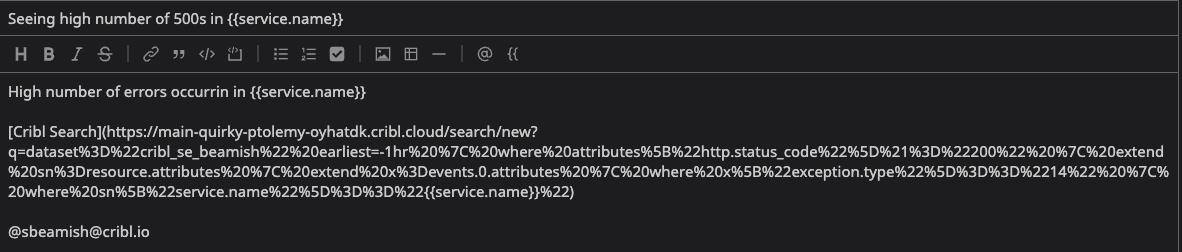
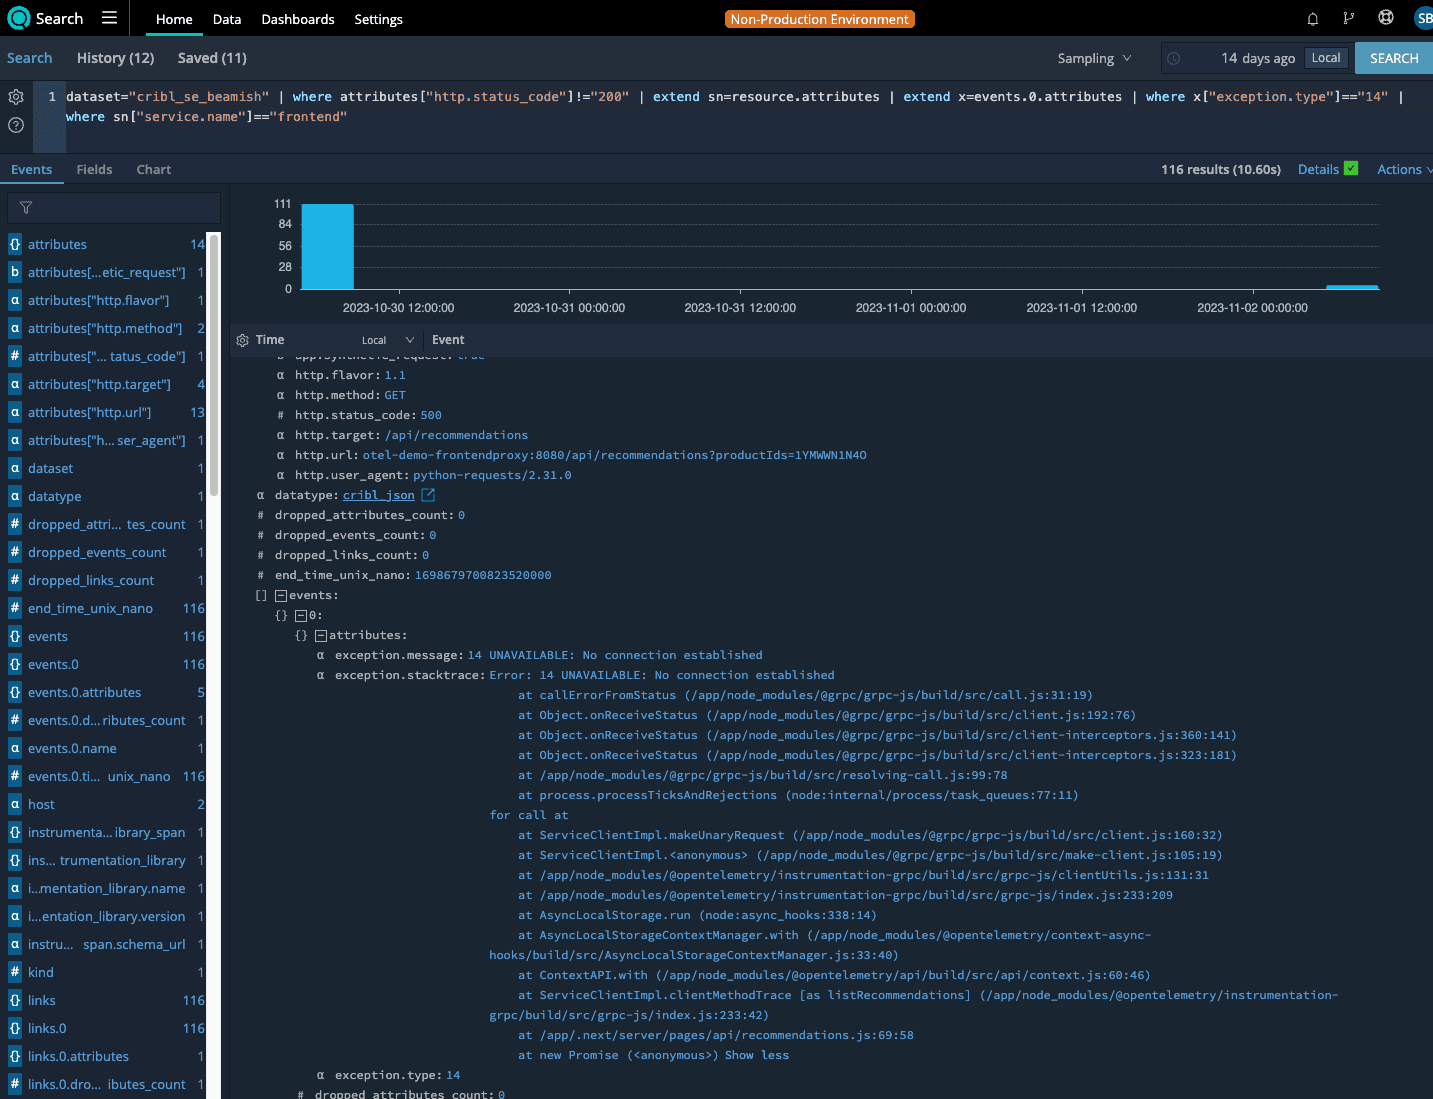
From your monitoring solution, you can create dynamic Search queries to pivot from your alert detection to the exact transactions contributing to the incident. In this case I’m generating an alert for high error rates by service, and I dynamically create the search string using template variables.
Clicking on the link in the alert brings you directly to the transactions causing the issue. Your SREs can go directly to the failures and drill into the root cause of the problem. The OTEL span contains the stack trace that is causing the problem. In this example, the service is UNAVAILABLE: No connection established
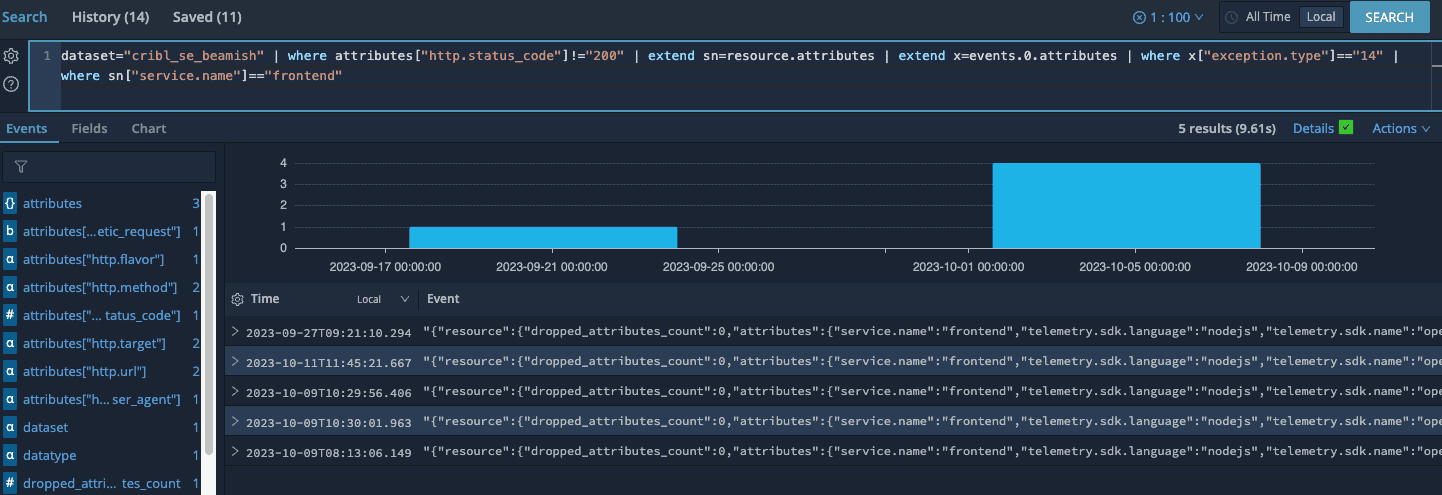
The last piece of the puzzle is to do distributed sampling to send a representative set of successful and unsuccessful transactions to your APM solution. Here you can see the same query as above but with a sample rate of 1:100 set.
Using this pattern, you can selectively include what types and how many of each transaction make it into your APM solution. Appending | send to your query allows you to send the results back through Stream to route to another analysis system. For example, representative samples can be selectively sent to other systems of analysis.
Send 10% of your 200’s -> APM
Send 20% of your 3XX -> APM
Send 50% of your 4XX/5XX -> APM
Send top X slowest transactions -> APM
Send 100% to Blob Storage (Compressed 10:1) in cheap storage
In conclusion, using Cribl Stream and Cribl Search gives you the best of both worlds—100% Data capture/retention while selectively sampling traces and sending them to your APM tool. Alternatively you can use Search alone to give insights into your applications without sending data anywhere. This approach will provide you with control over the trace volume, sending the correct data to your APM solution, and help keep costs under control, while giving you 100% observability. Ultimately, this approach eliminates the need to choose between cost and observability. Ready to learn more? Check out our Sandbox to try out Cribl Stream with sample data.