Remember the Tabs vs. Spaces arguments? It seems that observability has grown up enough that we are arguing over which signals are the “best” signals for observability. Often referred to as the Pillars of Observability, Metrics, Logs, and Traces (sometimes adding Events for MELT) each provide a unique perspective on a system. What happens when we change our perspective from finding the “best” telemetry format to finding the telemetry that aligns with the problems we need to solve?

It Started With Traces
Since joining Cribl, I have talked to many customers about logs, metrics, and traces as part of their observability landscape. Being vendor-agnostic and telemetry-inclusive, Cribl is built to enable customers to access the right data and deliver it to the right place and in the right format at the right time. This means that Cribl sees logs, metrics, and traces as equally valuable, at least when delivered to the right audience.
Understanding traces can be challenging, especially when drawing parallels between logs and traces for ITOps teams who are often more comfortable with logs and metrics. Then I realized – that spans and traces are structured and ordered logs about individual functions within code. Admittedly, this isn’t semantically correct, but the concept helps with the cognitive leap from “Logs describe the output of a system” to “Spans and traces describe the output of a unit of code”. Instead of picking a camp and arguing about the superiority of limited solutions, shouldn’t we ask, “What telemetry do I need to understand this problem?”


Technology Is Layers
Remember the OSI and TCP/IP models—those dense stacks we had to memorize. Notice anything? Yep, layers! Layers everywhere. Whether shuttling data across a network or decoding it on the other side, layers are the unsung heroes of our tech world.
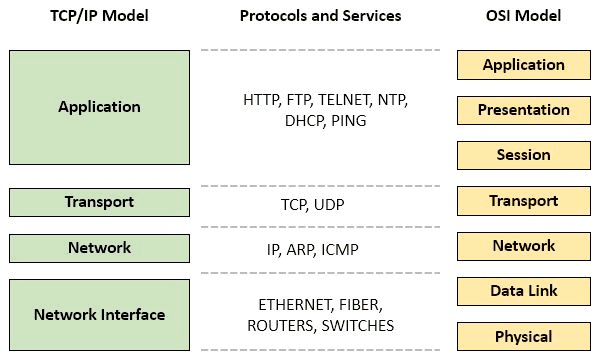
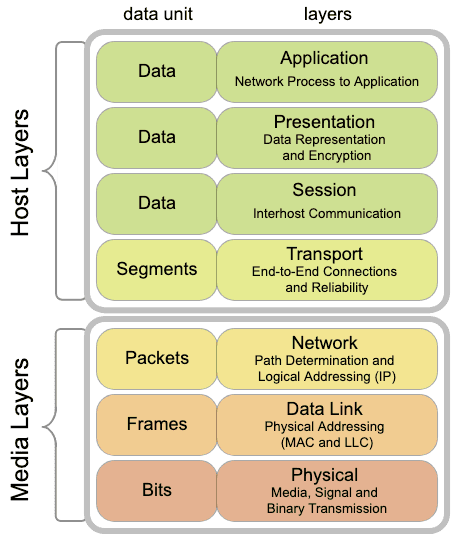
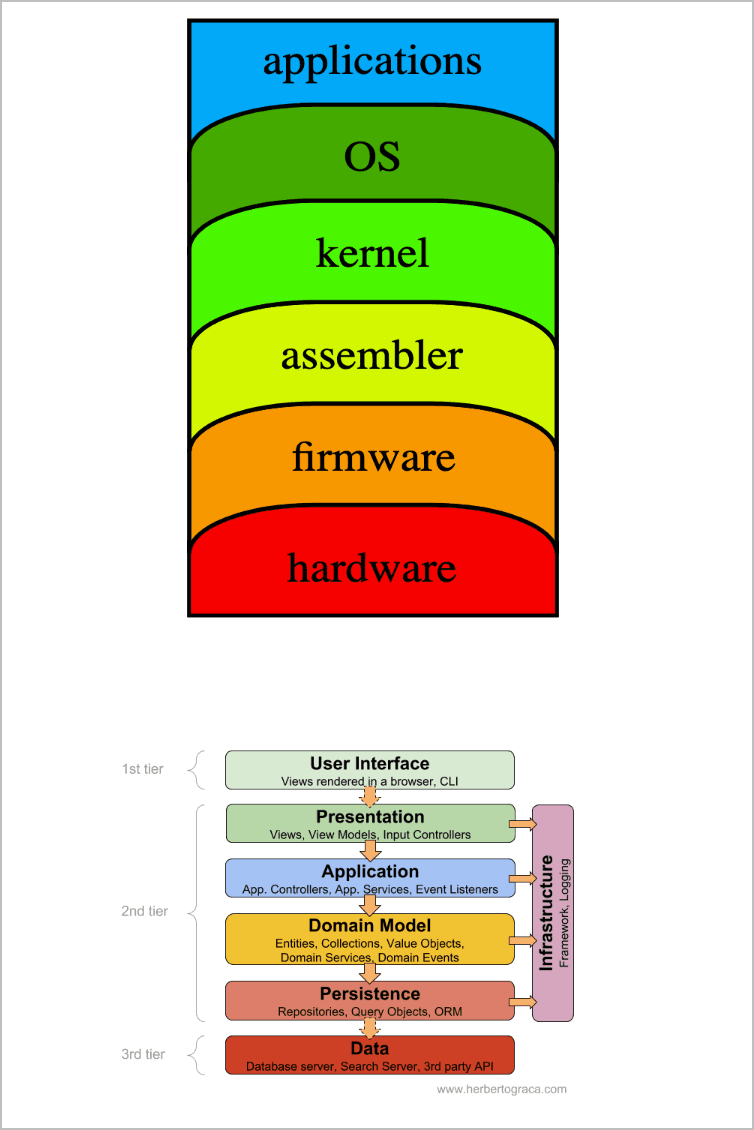
It’s not just the network that has layers. There is an abstraction layer for the hardware and software that describes the compute layer of our modern tech stacks. Even applications have layers!
Observability Is Layers Too!
I’ll admit to having a bias against pillars because they remind me of silos, and the last thing we need in a culture of observability is silos. When we start arguing about the superiority of one type of telemetry over another, or the value of application monitoring vs real user vs infrastructure, we miss the larger picture. When developers proclaim the infallibility of traces, they ignore the network and infrastructure that only emit logs and metrics. SREs and Cloud Ops folks who ignore the value of logs or traces because “metrics are easier to store and search” risk the inability to answer why a problem happened when detected by those metrics.
To understand how this ecosystem of logs, metrics, and traces works together, I’ve overlaid a series of personas on a fantastic visual from IBM that shows the layers of observability, as part of a fantastic article entitled Observability, Insights, and Automation. These aren’t absolutes, and many teams will adopt many of these personas based on their business needs or technology.
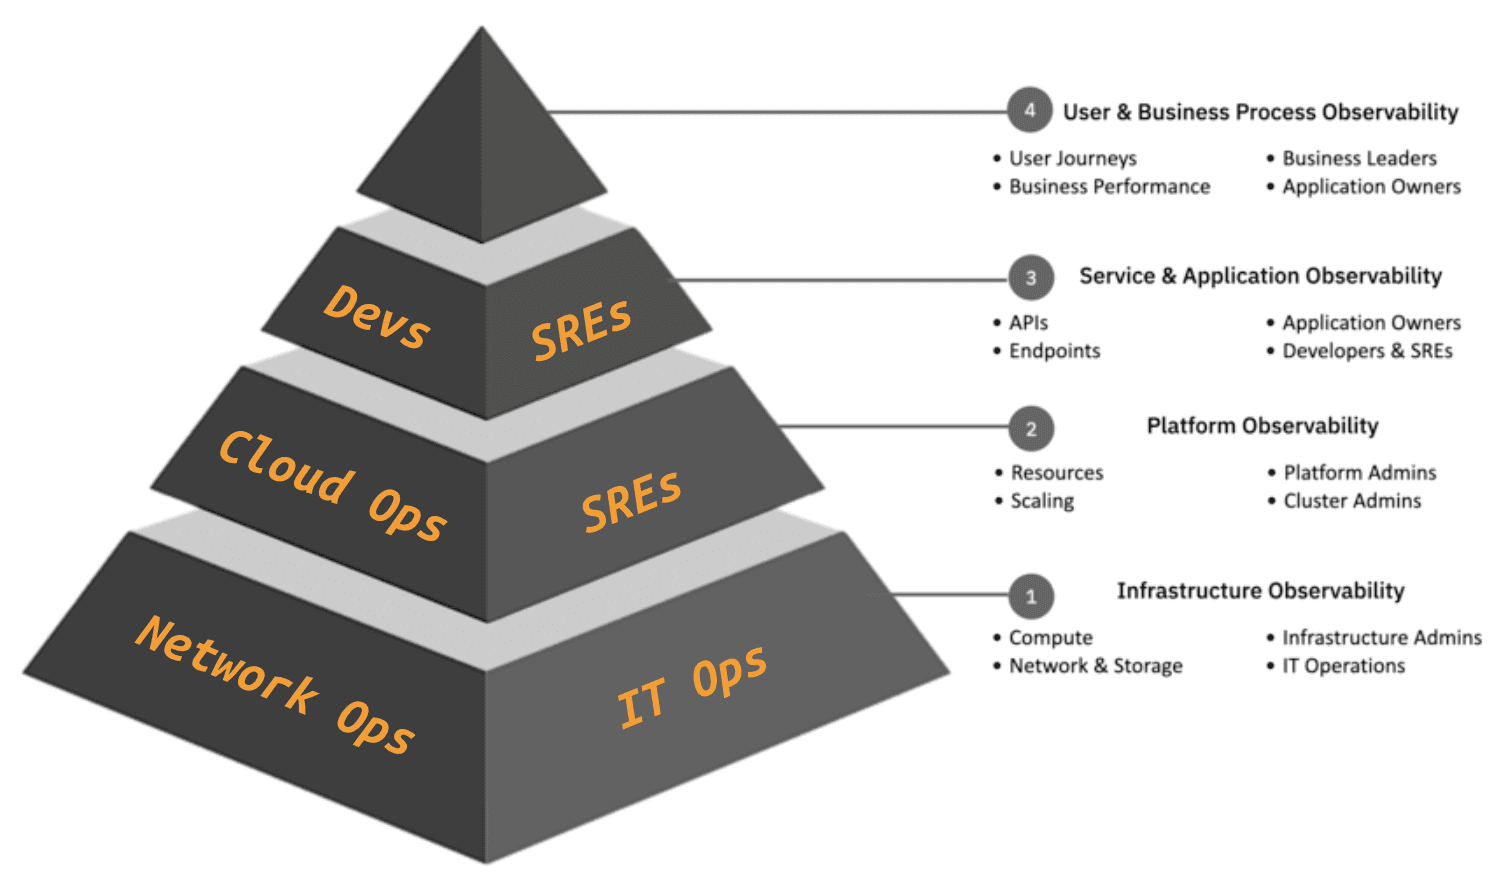
Here is a hot take the next time someone declares one source or type of telemetry superior to another – spans are simply structured logs about the execution of code; traces are groups of linked, ordered logs; and logs describe the result of a trace. Do they sound like fighting words? What if I told you that network flows are just logs about network conversations, too? We can start pursuing a truly observable system when we stop thinking about a specific type of telemetry and a specific layer of the technology stack.
Hot take: The next time someone crowns a type of telemetry the champion, remind them—spans are just logs dressed up in the context of code execution; traces are ordered groups of logs with execution context; and logs are the aftermath of a code execution, in a form that humans can easily understand—fighting words? Maybe, but it’s time we stop idolizing one type over another.
The IBM article states this sentiment in a very eloquent way.
To provide a highly observable system, you need to correlate each of the pillars of telemetry so that the data can be used in context. While the term “pillars” implies that they are siloed, there is significant value in having correlation and context between metrics, traces, and logs…
To fuel a culture of observability, we need to connect the dots across logs, metrics, and traces. That means gathering signals from all corners of your stack and leveraging the right tools to turn that raw data into actionable insights: different signals, different agents, one mission—true observability.
Power Observability With Cribl
Is seamless observability across all telemetry types and tech stacks just a pipe dream? Can we unify different roles and responsibilities across shared telemetry sources to ensure teams have the right data at the right place and time? Absolutely! But it takes more than just wishful thinking—it takes observability built on scalable, resilient, and powerful pipelines.

In the world of observability, choice and flexibility matter. We carry a heavy load as engineers responsible for collecting, enriching, routing, and storing massive volumes of logs, metrics, and traces for ITOps and security teams. Managing the flow of critical telemetry, ensuring operational resiliency, and guaranteeing compliance—it’s all in a day’s work for Cribl and our customers. Whether it’s OpenTelemetry or OCSF, cloud or on-prem, application or infrastructure, Cribl breaks down the barriers between pillars and layers, unifying your observability strategy. And that’s how you build an authentic culture of observability!


