One of the things I really love about working for Cribl is the ability to help our customers optimize their data. Microsoft Windows Event Logs are something I have always looked to as a proverbial Rosetta Stone to help translate semi-structured, classic-style events into something more efficient and less resource-intensive to search. Extracting field values requires a large number of regular expressions to parse the events, which isn’t ideal. We’ve also worked with customers who have a number of agents that ship Windows Events in a variety of formats, which unfortunately adds to the complexity of their data processing. What if there was a real “Rosetta Stone” that allowed you to process Microsoft Windows event logs as you wish? This blog chronicles my quest to find a working solution for taming Microsoft Windows Event Logs using Cribl. I also created a Pack, aptly named the “Cribl Rosetta Pack for Windows Event Logs” to share the approach I detail in this blog.
The Call to Adventure
18 months ago, I had a conversation with an individual, which set in motion this quest. He had a challenge: a customer who, as a managed service provider, did not have control of the events forwarded to them. Events came from a variety of agents like QRadar, McAfee, WinLogBeats, etc., and needed to be translated into a common format for monitoring in their SIEM. He shared a revelation I had not heard before: “There is a way to export Windows Event Log templates”. So began my quest: What if there was a way to know the exact format of every Windows Event Log and their field names for translation? My goal: A “Rosetta Stone” for Windows Logs.
Time passed from this conversation, and during a later proof of concept exercise, I began digging into this concept. This customer wanted to process syslog events from Snare agents installed on Windows Servers and send them to a new SIEM which required the Windows classic event format. To forward Windows Event Logs, the Snare agent formats the event on a single line using a tab-delimited format. All newlines and tabs are replaced with spaces in the message body of the Windows Event Log.
A sample syslog message looks something like this:
<14>Jan 28 13:33:30 myhost.acme.com MSWinEventLog1Security374182Fri Jan 28 13:33:30 20224624Microsoft-Windows-Security-AuditingN/AN/ASuccess Auditmyhost.acme.comLogonAn account was successfully logged on. Subject: Security ID: S-1-0-0 Account Name: - Account Domain: - Logon ID: 0x0 Logon Type: 3 Impersonation Level: Impersonation New Logon: Security ID: S-1-5-21-1234567890-1234567890-1234567890-12345 Account Name: jsmith Account Domain: acme.com Logon ID: 0x3AEFC979 Logon GUID: {91A32AD5-2D11-4416-9F04-6601D95E60AE} Process Information: Process ID: 0x0 Process Name: - Network Information: Workstation Name: - Source Network Address: - Source Port: - Detailed Authentication Information: Logon Process: Kerberos Authentication Package: Kerberos Transited Services: - Package Name (NTLM only): - Key Length: 0 This event is generated when a logon session is created. It is generated on the computer that was accessed. The subject fields indicate the account on the local system which requested the logon. This is most commonly a service such as the Server service, or a local process such as Winlogon.exe or Services.exe. The logon type field indicates the kind of logon that occurred. The most common types are 2 (interactive) and 3 (network). The New Logon fields indicate the account for whom the new logon was created, i.e. the account that was logged on. The network fields indicate where a remote logon request originated. Workstation name is not always available and may be left blank in some cases. The impersonation level field indicates the extent to which a process in the logon session can impersonate. The authentication information fields provide detailed information about this specific logon request. - Logon GUID is a unique identifier that can be used to correlate this event with a KDC event. - Transited services indicate which intermediate services have participated in this logon request. - Package name indicates which sub-protocol was used among the NTLM protocols. - Key length indicates the length of the generated session key. This will be 0 if no session key was requested.788385306
Since we don’t know which spaces are newlines and which are actual tabs, we can’t revert this back to the original Windows classic event. Unfortunately, most vendor solutions also handle Windows events over syslog this way, since RFC3164 and RFC5424 syslog formats treat newlines as event boundaries.
Journey to the Underground (System Internals) on How to Process Microsoft Windows Event Logs
Windows Event Logging is a fairly complex subject. To grossly oversimplify, events are stored in Logging Channels. The Event Viewer displays these Channels by their human-readable names, such as System, Security, Application, etc. Each Logging Channel’s file stores events in binary format. For example, when you request the Event Viewer to render an event, it pulls a template definition from a DLL, and inserts placeholder values into the template. The challenge now is how to get ahold of these event templates from all the DLLs!
Microsoft provides a built-in utility, wevtutil.exe, which allows us to inspect the contents of a Logging Channel publisher’s metadata. By running the following command, we can dump the contents of the logging provider’s metadata:
wevtutil.exe gp <publisher-name> /ge /gm /f:xml
So, where do we get the publisher names for this command? Luckly, wevtutil.exe provides that too. The enum-publishers sub-command lists all registered logging providers:
wevtutil.exe enum-publishers
Unfortunately, this is only half of the equation. wevtutil only provides the template, not the field definitions, which are critical to building XML events. So let’s keep looking.
I next found Microsoft’s PerfView too,l which allows for dumping registered manifests from logging providers. You can download this tool from GitHub.
By running the following command, we are able to export the field definitions from each logging provider:
PerfView userCommand DumpRegisteredManifest <provider-name>
Now we have both sides of the equation to solve! Let’s join them together.
The Reward: Cribl Restores the Value of Your Data
Armed with a ton of information, we need to compile our templates so Cribl can use them. A Lookup file is one of the most efficient ways to use a large data set. At startup, Lookup files are loaded into memory inside each Worker Process. We can do blazing-fast lookups since we don’t need to fetch template and field data from disk while processing each event.
While searching for an easier way to export templates to help process Microsoft Windows Event Logs, I came across a GitHub project that exports all Event Template providers and stores them. It’s in this repo. It makes building a Lookup so much easier.
To join the template definitions with the field values, we extract the templates from the Manifest file using an XPath expression. Unfortunately, the field definitions are nested inside stringified XML in the Event definition. We can parse this data and then extract the names using another XPath expression. (Don’t worry about the details here. The full steps to build the template Lookup file are available inside the Pack and on GitHub.)
Now you can easily obtain the correct template and field data, using a Lookup with three fields as keys: provider/channel, event code, and event template version.
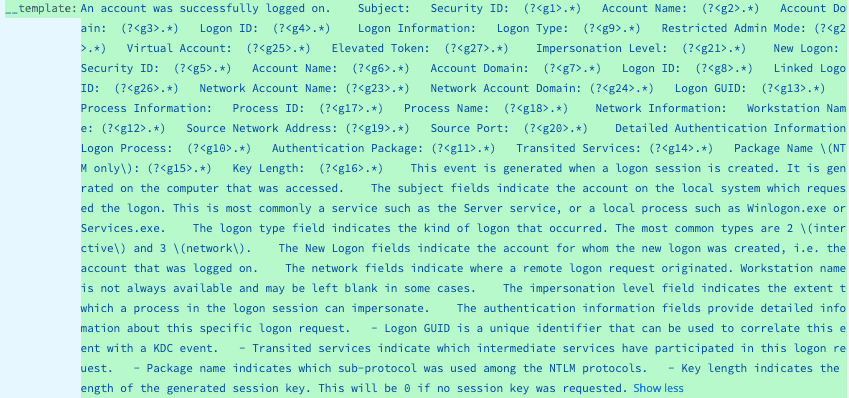
Screenshot of the Lookup file containing the templates and field names:

If you inspect the raw event templates, you can see the placeholders for field values formatted with a percent sign and the index of the field. E.g., %1 would be the value of the first field. The template for the sample Snare syslog message, from earlier in this blog post, is also contained on rows 2–5, due to the varying formats across different versions.
Now that we have the templates stored in a Lookup file, we can convert them inside a Pipeline to the Snare format, to extract the fields from the message body. NXLog Community Edition is open-source, so we can see how the messages are formatted (assuming you can read C code)
In the Pipeline, we can mask this field returned from the Lookup, and convert placeholders into regex capture groups, like the following:

Since we also have the original template, we can use the percent placeholders to replace the values captured by this regex. Our regex capture group g1 will be placed into the %1 placeholder, g2 into %2, etc.

With the field values extracted, they can be substituted back into the original template, turning the Snare event into a true classic Windows Event Log.

Amazing! We were able to convert the Snare-formatted event back into a Classic event using our template Lookup file and regexes. Rosetta Stone is achieved to process Microsoft Windows Event Logs!
You might think this process is inefficient, but it’s surprisingly fast, clocking in at ~1–2ms per event. Faster than trying to extract values with individual regular expressions. The Pipeline profiler shows roughly 37.5 ms to convert the event. Not bad!

The Road Back: Process Microsoft Windows Event Logs
We’ve reached the end of the quest to process Microsoft Windows Event Logs in various formats. While this is just one path on many journeys, Cribl offers you the flexibility and freedom to choose how you forward your data with 1TB/day for free! Our Cribl Edge endpoint agent makes Windows Event collection so easy, with the ability to preview and forward events. If you don’t like agents, Cribl Stream also supports Microsoft’s built-in Windows Event Collection/Forwarding (WEC/WEF) protocol, with a certificate and Kerberos authentication.
Every hero knows the end is just the beginning of more adventures, as there are still challenges to overcome. In our case:
Missing templates need to be added to the Lookup. This is especially common with custom providers, such as software applications that use their own logging channels.
Templates can have multiple versions across different versions of Windows. This can be problematic if the version gap is wide, such as XP versus Server 2022.
We have come a long way from unruly data, though, and now you have control over your events in the format you need. I hope this unique approach to processing Windows Event logs can give you back control of your data. For additional details on my approach, check out my Pack on my GitHub here.
And I’m not done with Windows yet! We have more features coming up to improve the Windows observability experience for customers, and we can’t wait to share more information with you on this front. Stay tuned!


