
I have worked as a helpdesk specialist, cyber security analyst, information systems security engineer, professional services consultant, etc. At this point in my career, I have seen enough to relate with anyone in the IT world. Let’s narrow our focus and chat about monitoring system health and troubleshooting. Tool sprawl is the standard. Let me say it louder for the people in the back, “Tool sprawl is the standard.” 🗣️As Whitney Houston once said, “It’s not right, but it’s okay…they’re gonna tool sprawl anyway…” (I may have taken some liberties on the quote). Agents are some of the worst offenders. Everyone wants the mythical single pane of glass, but very few see it. The security and IT homies want the ability to observe everything, so they stick multiple agents on their servers – leading to resource-intensive processes and services accompanied by a lot of tabs and windows. I have seen it in each of my professional eras. Considering the aforementioned, I am hyped to discuss my Cribl Edge and Cribl Search use case.
Imagine this:
Using a UI to explore service error logs to identify the root cause of an issue while maintaining the flexibility to route and store them. Being able to monitor and troubleshoot services and host with an all-in-one agent. Bypassing the need to rely on awk, grep, sed, etc. to modify multiple files.
Imagine knowing this describes a fraction of what Cribl Edge and Cribl Search can do. 🤯
Use Case
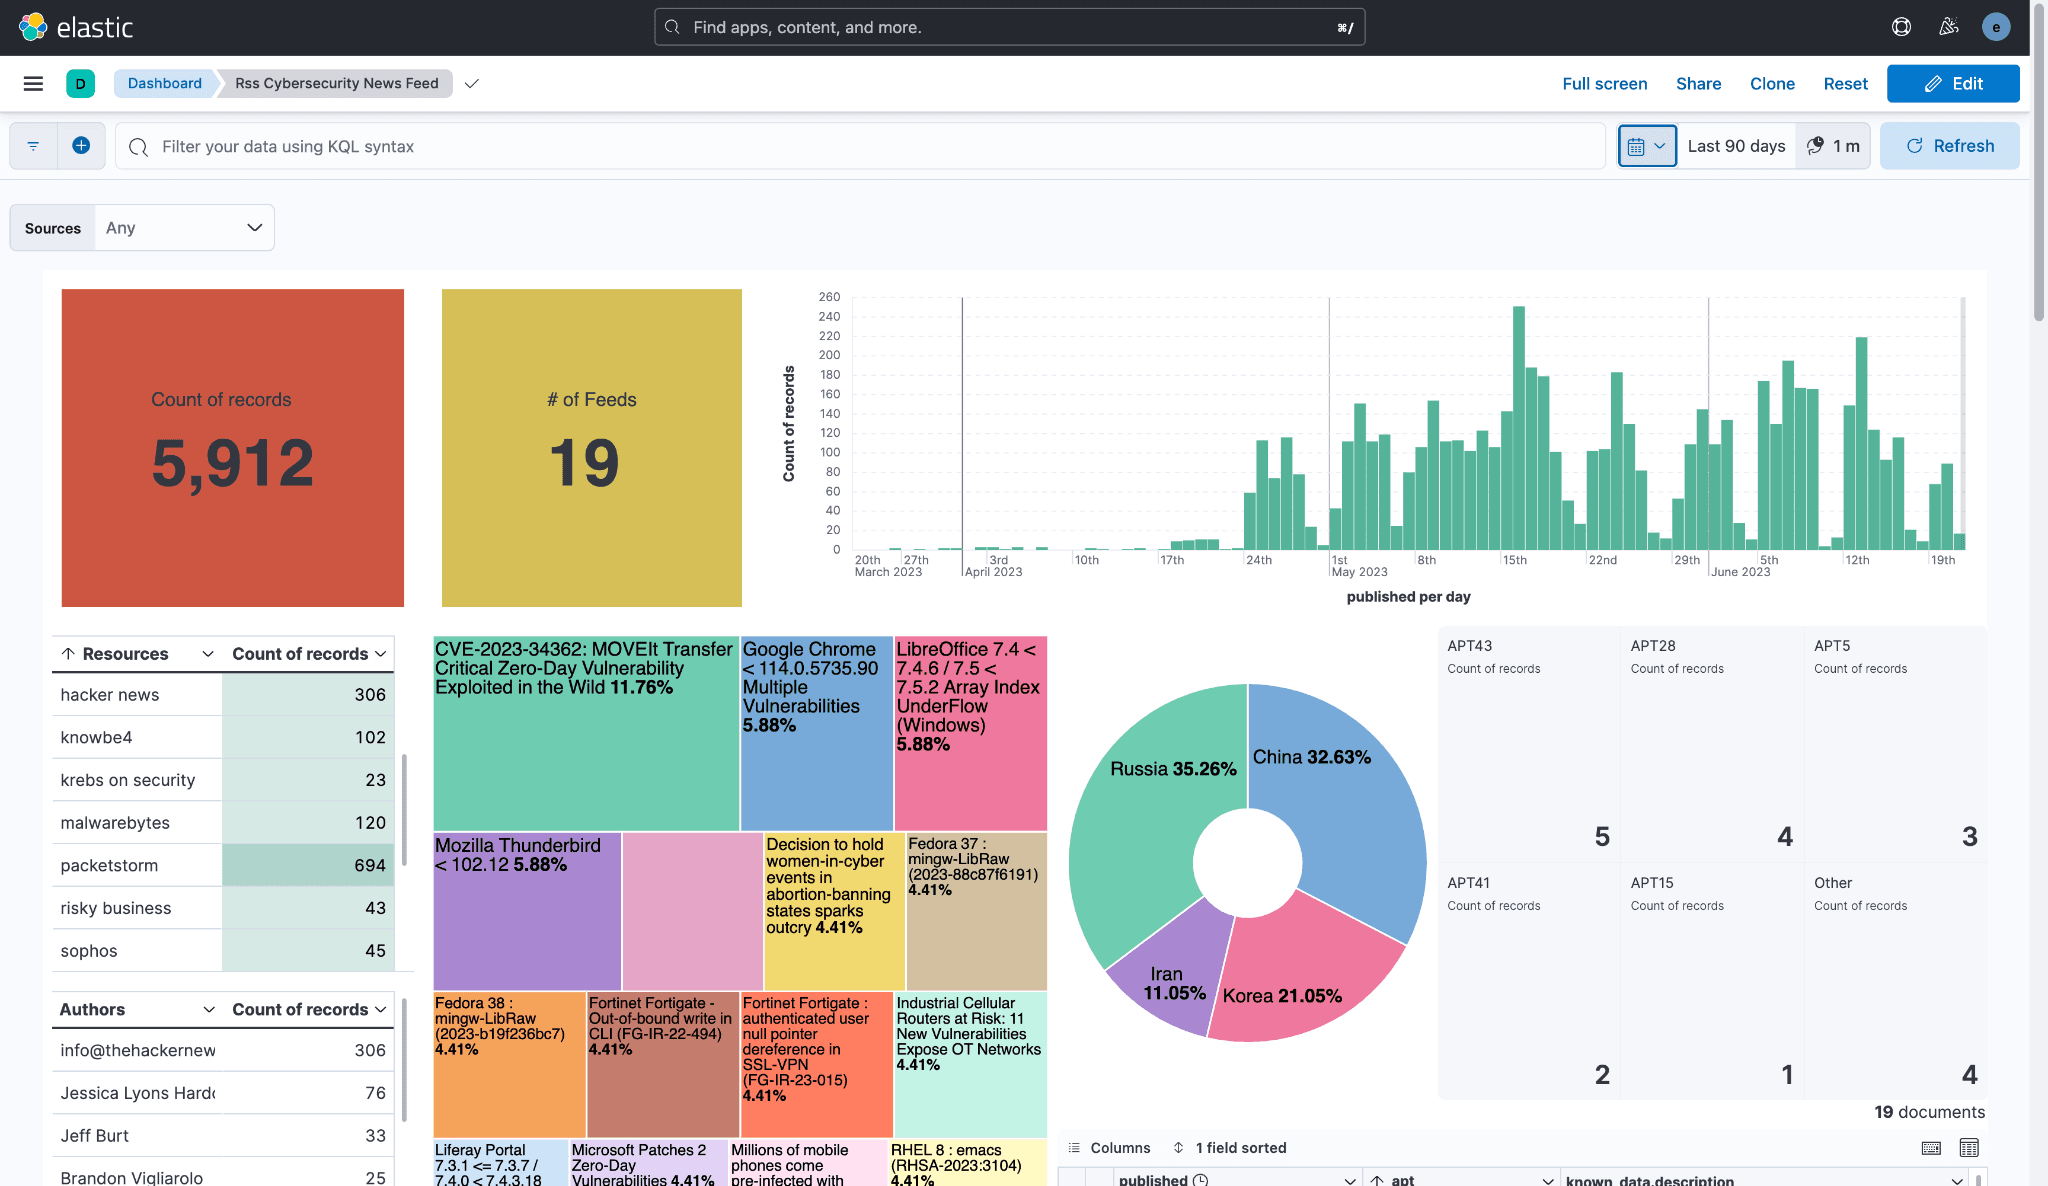
Last year, I built an RSS Cybersecurity News Feed that visualizes various cybersecurity news feeds. I collect different news feeds, consolidate them into Logstash, route the logs to Elasticsearch, and visualize them with Kibana. I keep it open all day for items of interest.
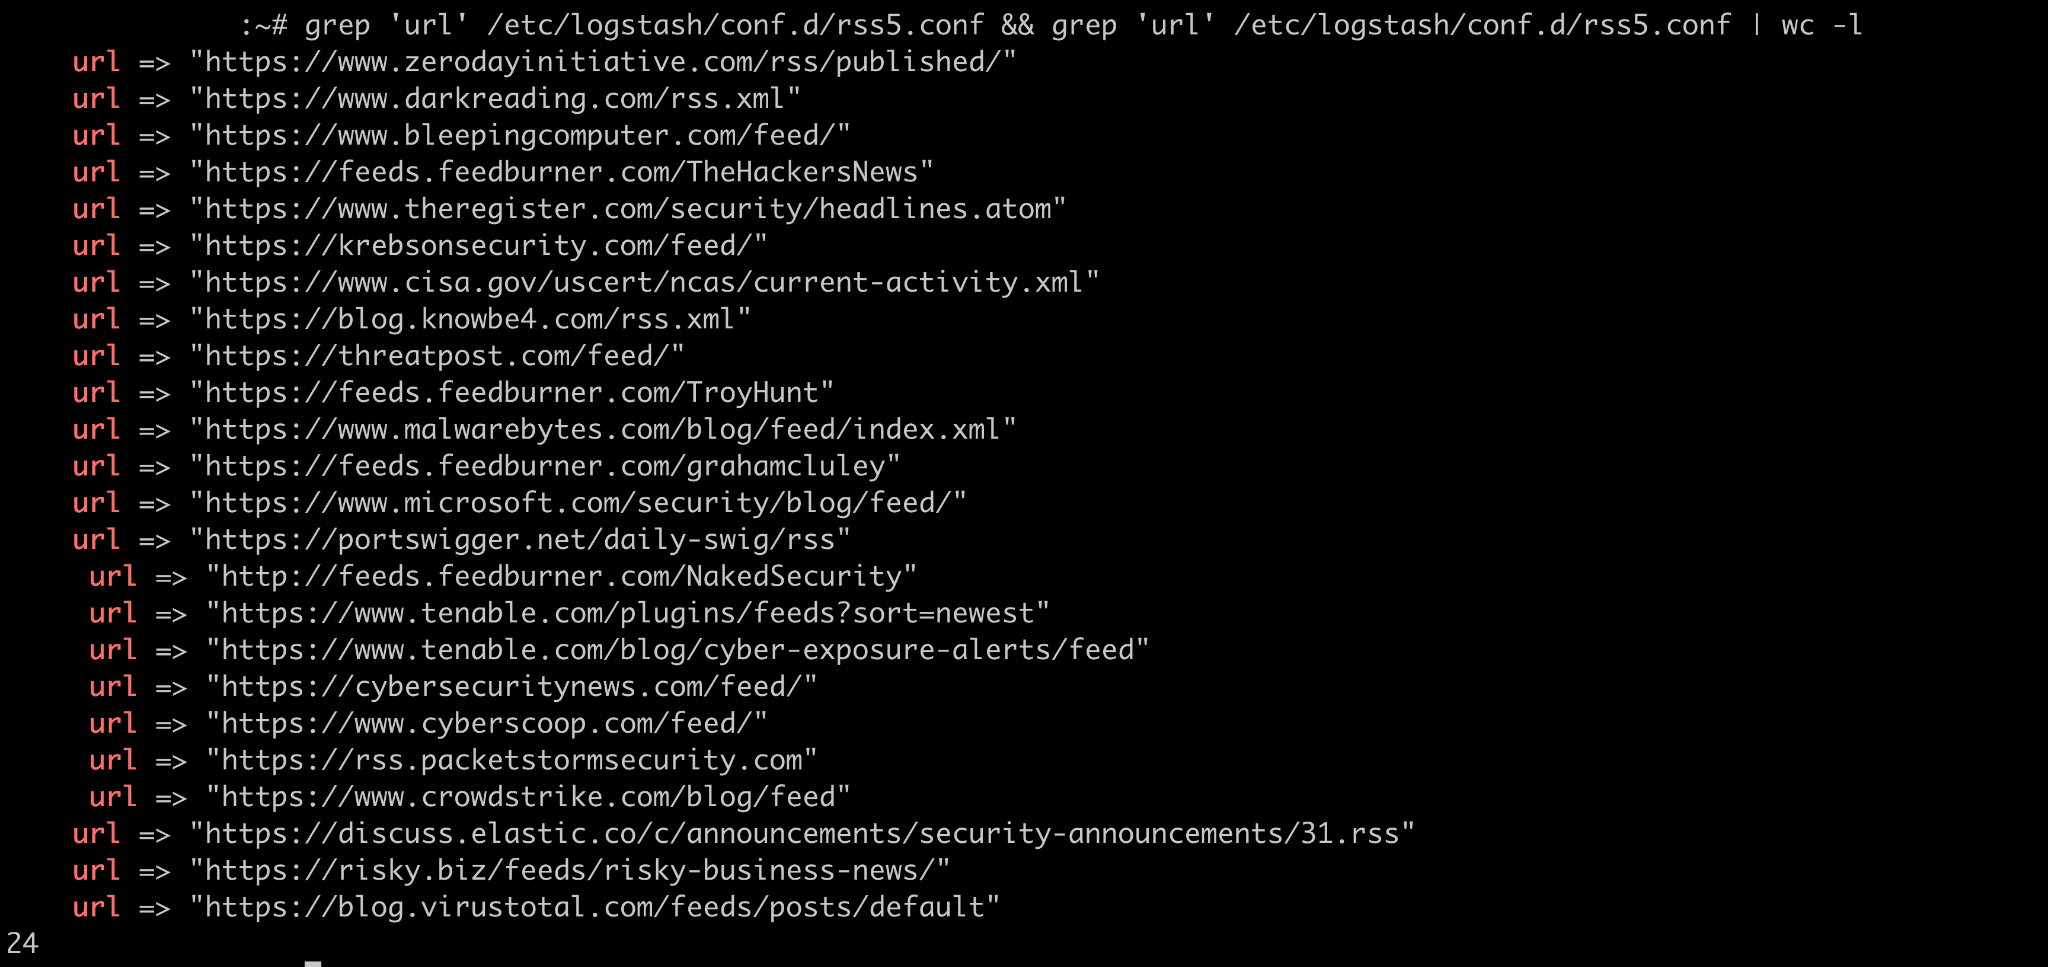
Recently, I noticed the number of feeds decreasing. I have 24 feeds in the Logstash pipeline, but over the last 90 days, I have observed 19 in Kibana. As my homie, who shall remain nameless, would say, “Something be broke…”
I didn’t have a monitoring solution. I’m just casually running my stack. I mean…YOLO.
Although there have been minimal issues with my Elasticsearch deployment, I wasn’t willing to commit to installing any sort of logging agents–until now. These missing RSS feeds changed my perspective regarding improved observability (i.e., server health monitoring, troubleshooting, etc.). Full transparency, I could easily use the CLI to comb through Logstash logs–sprinkle a little grep and regex on the command line and get cooking. But I don’t want to do that; I want a UI! Life is too short.
After some guided meditation and a few episodes of the podcast, Cribl: The Stream Life, I decided to use Cribl Edge and Cribl Search to build a monitoring solution.
Why Cribl Edge?
Cribl Edge is a manageable and auto-configurable agent designed to collect telemetry data at scale. It gives flexibility and control to manage and monitor in a consolidated easy-to-use console. Edge gathers and auto-discovers observability data at its egress point, allowing you to automatically discover, monitor, and collect metrics and logs from running applications.
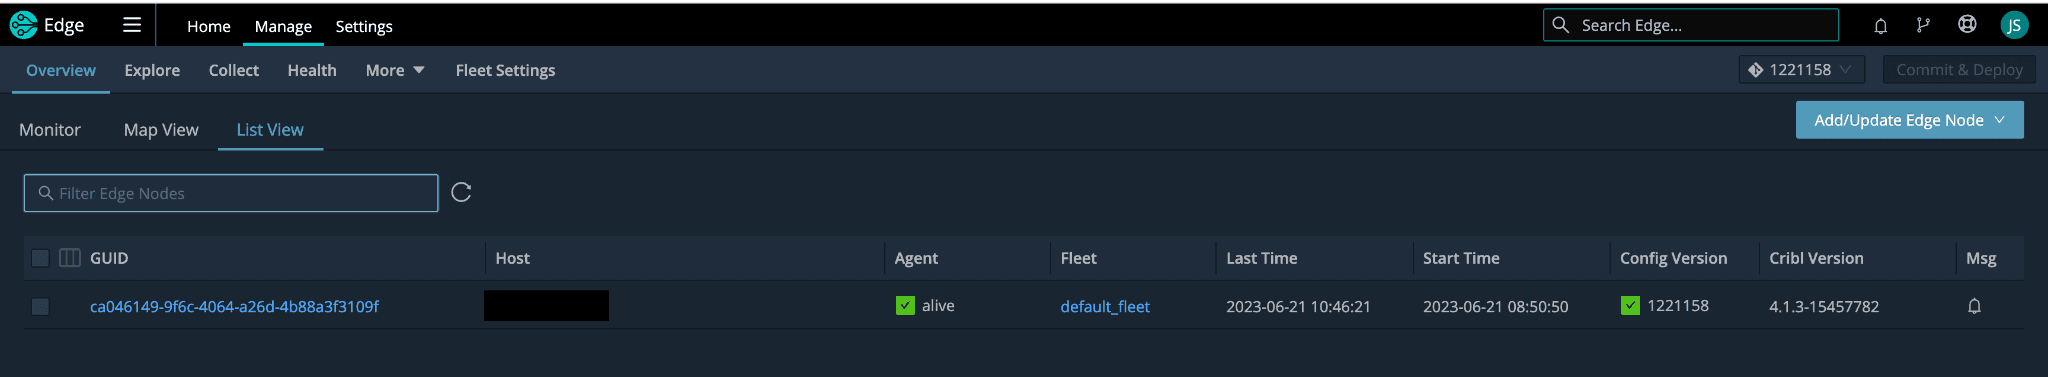
I am currently leveraging the free tier of Cribl Cloud. Installing Cribl Edge was quick and easy. I copied the curl command from the UI, pasted and executed it on my Logstash instance (aka the soon-to-be Edge Node), and it was done. With a few clicks on the keyboard, Edge was installed, and the Node was checked in. No looking for the correct configuration files or expert-level scripting. It was a magical experience!
Traditional log shipping agents require a text editor, patience, and more time. They can be highly time-consuming and would require modifying configuration files. I have seen several scenarios where my peers leveraged multiple agents, and the room for error was boundless. Development, production, home lab, etc. – the struggle is the same, especially when a point of centralized management is nonexistent. One syntax error can lead to hours of scatterbrained troubleshooting.
After gaining insights into the logs, adding the ability to visualize would require sending data to Elasticsearch for analysis in Kibana. I am running my Elasticsearch cluster on cloud instances; as a result, I am operating on the bare minimum because those costs are coming out of my frugal pockets. The news feed data I am collecting is a relatively small dataset, and I can retain it for 90 days. Error, info, and warn logs are orders of magnitude more voluminous. However, these logs are critical to my observability strategy; I want to see the service logs but can’t afford to resize my cluster. I am on a budget. Relatable or nah? I don’t need retention for these logs outside of near-real-time troubleshooting and service status monitoring. Edge was precisely what I needed! Edge allowed me to perform data exploration closer to the source, providing flexibility to analyze the data before collecting and processing it. Furthermore, it allows for the federation of log storage, eliminating the need for a centralized high-capacity data lake.
With Edge’s auto-discovery capability, I could manually discover and explore the /var/log/logstash directory and search through the logs.
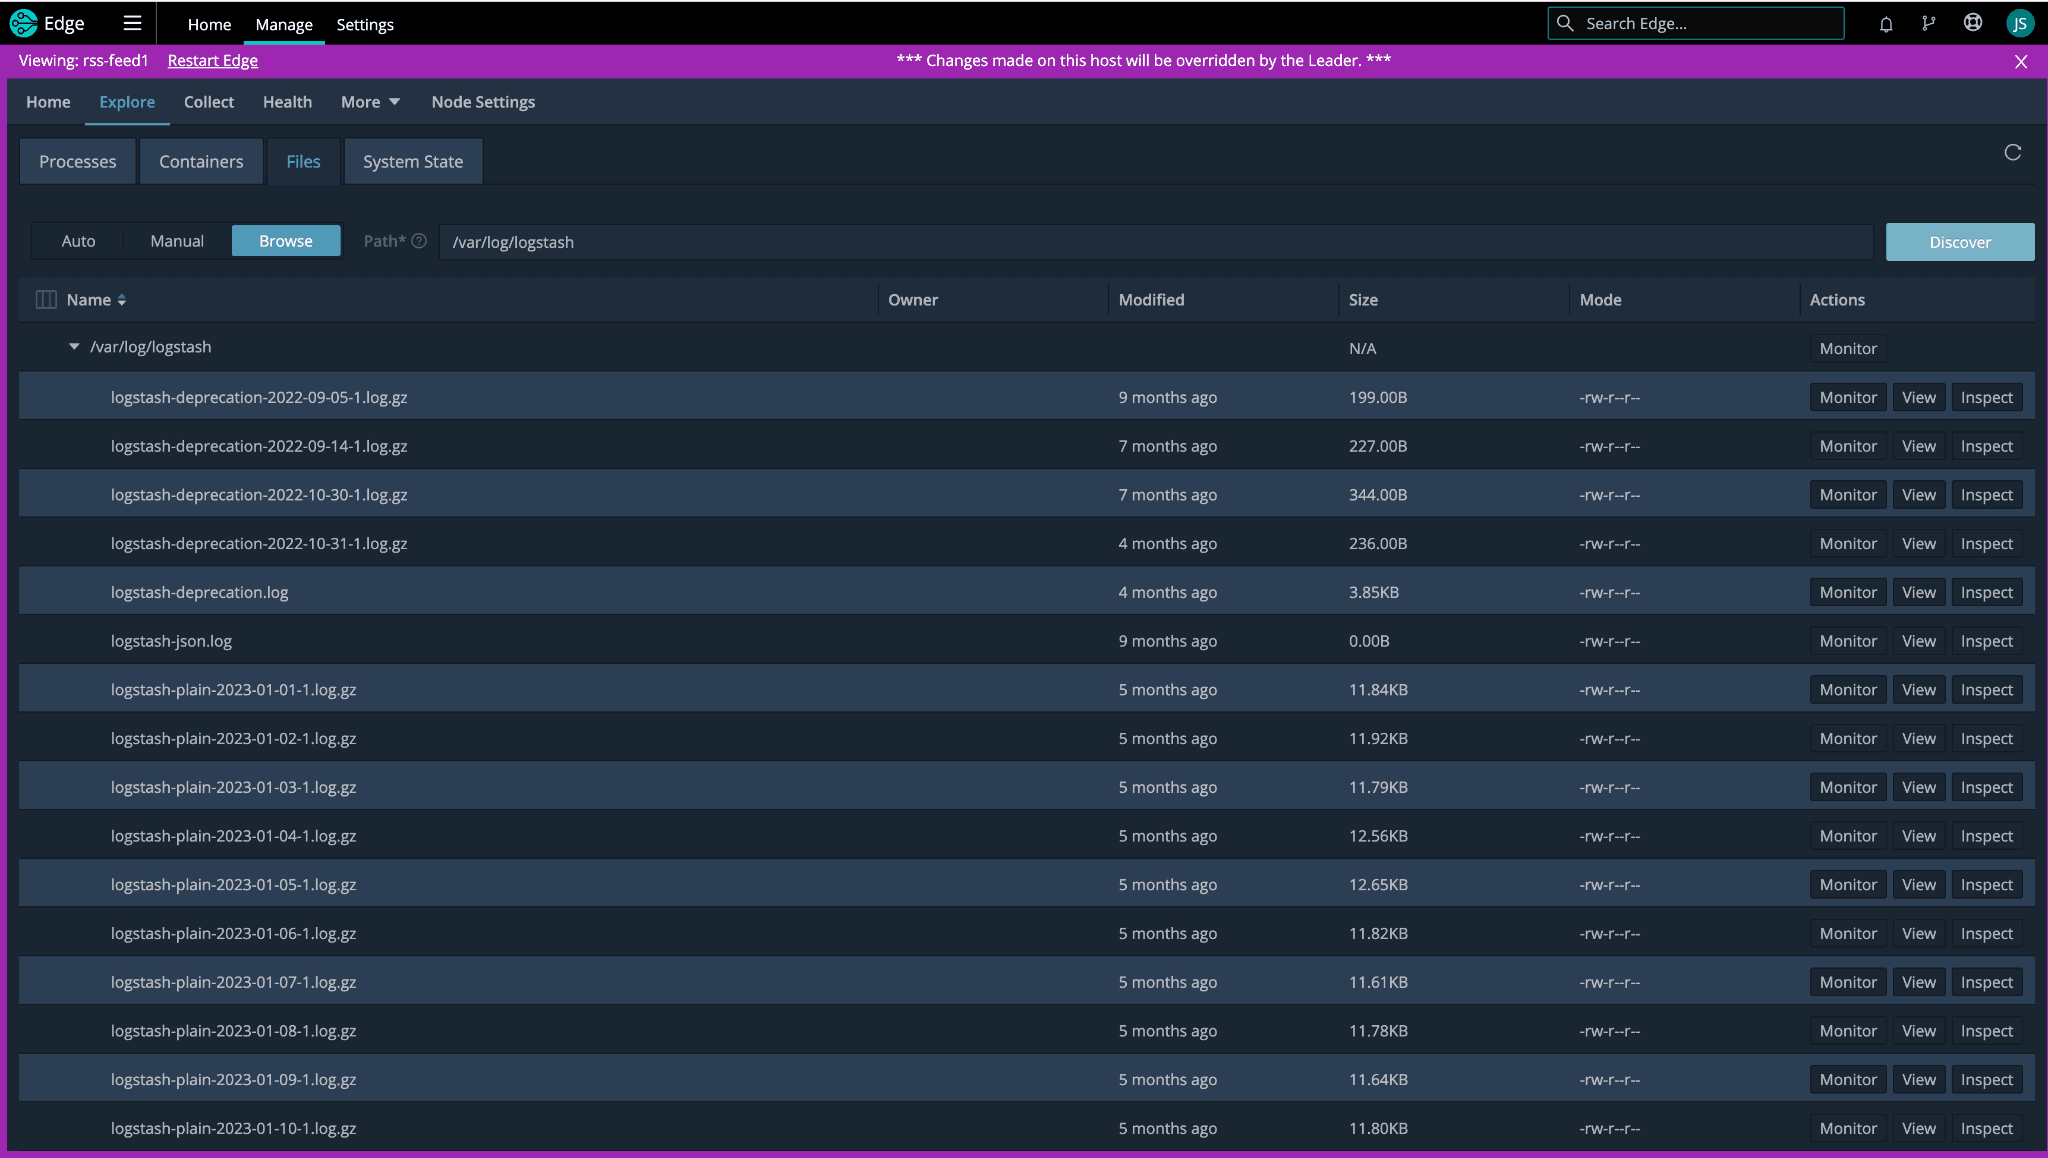
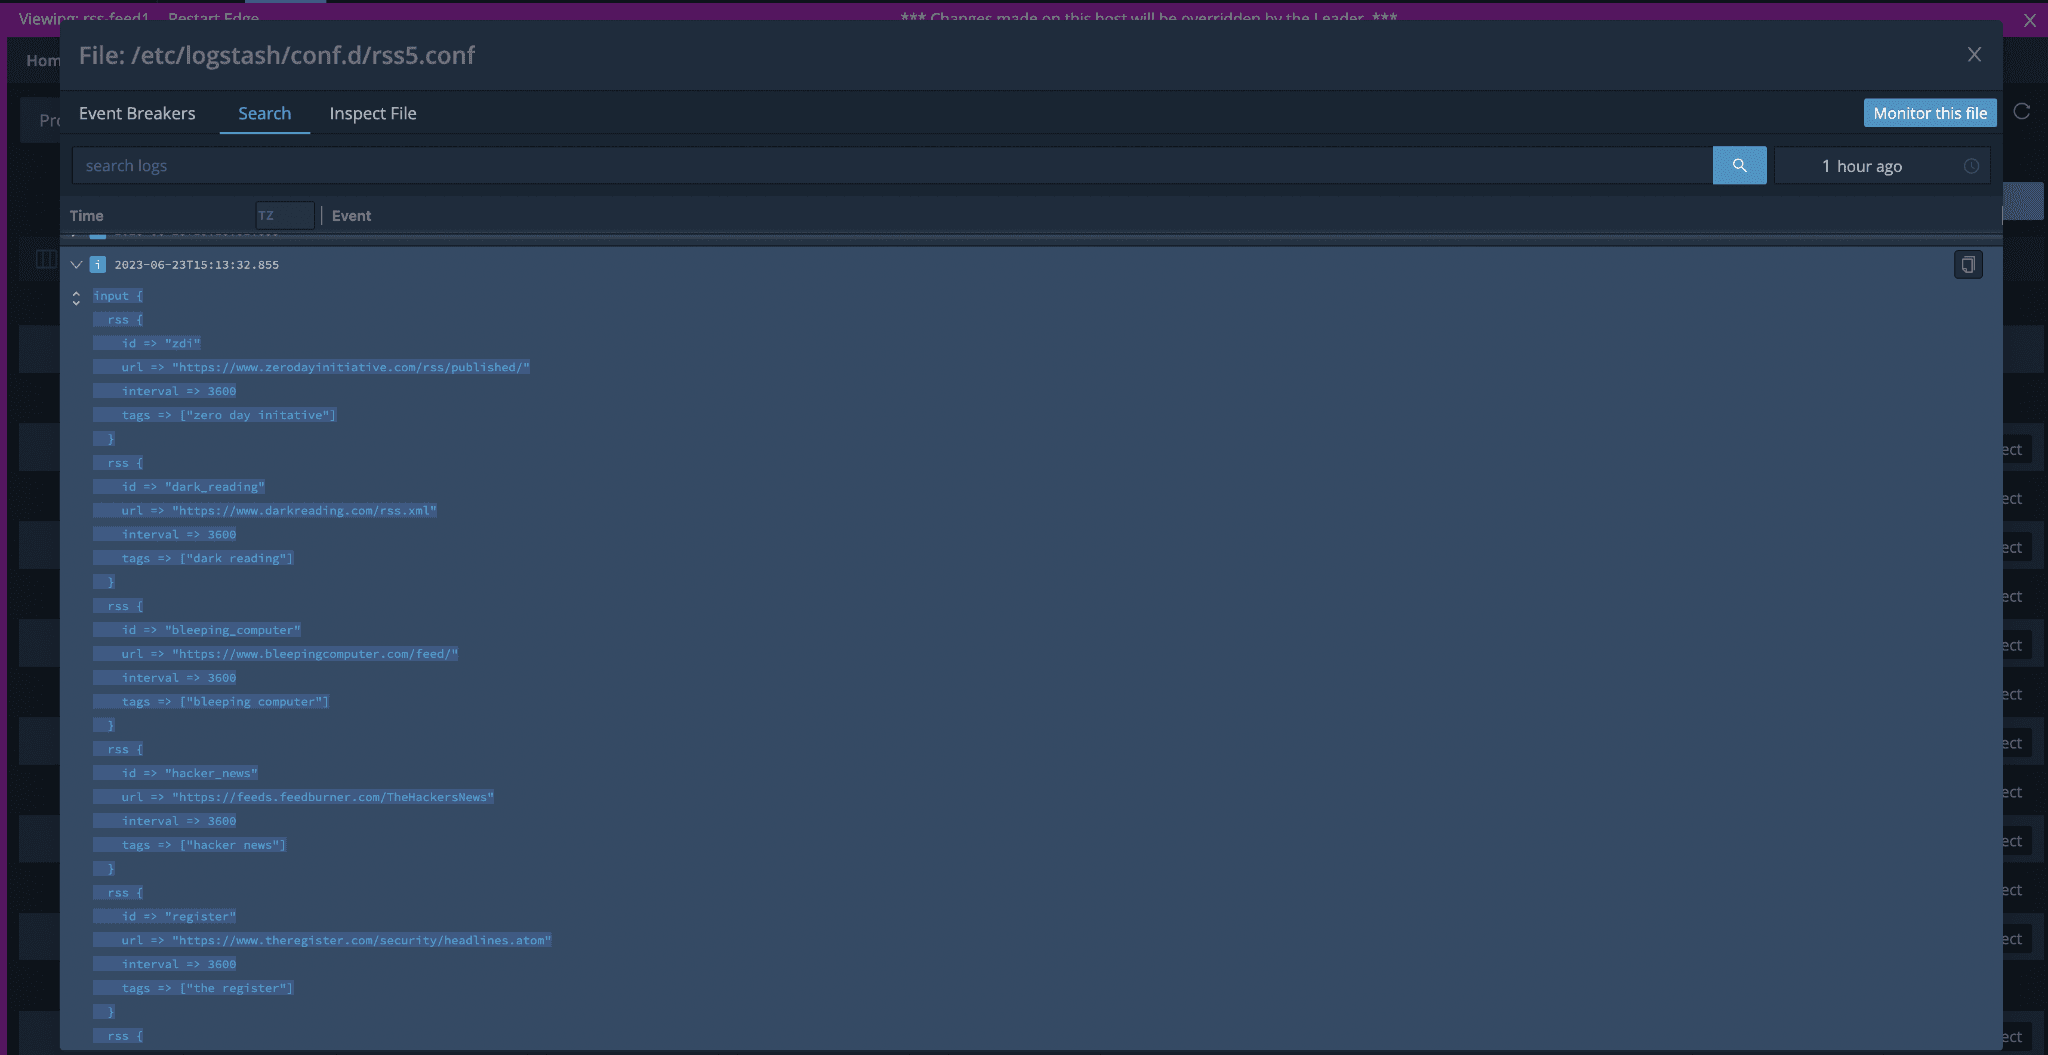
With the “View” action, I even reviewed the pipeline.yml and .conf files to ensure the Logstash configurations were correct. Another command line exercise was bypassed entirely!
Why Cribl Search?
Cribl Search, the newest addition to the Cribl suite of products, revolutionizes log analysis and data exploration. Paired with Cribl Edge, it empowers users to efficiently search, delve into, and analyze logs, instrumentation data, application data, and metrics without moving data to a host or object store. With its advanced capabilities, Cribl Search enables organizations to unlock valuable insights, identify patterns, troubleshoot issues, and optimize performance in real-time, making it an indispensable tool for data-driven decision-making. Cribl Search brings agility, scalability, and enhanced efficiency to log analysis and data exploration workflows.
Did I need to use Cribl Search? I could have accomplished my observability goals with Edge. I had the “W” in hand. I could have started sipping on a bottle of kombucha and celebrating my victory. The Cribl Search addition for this use case is like an “after credit scene.” It’s the icing on the cake!
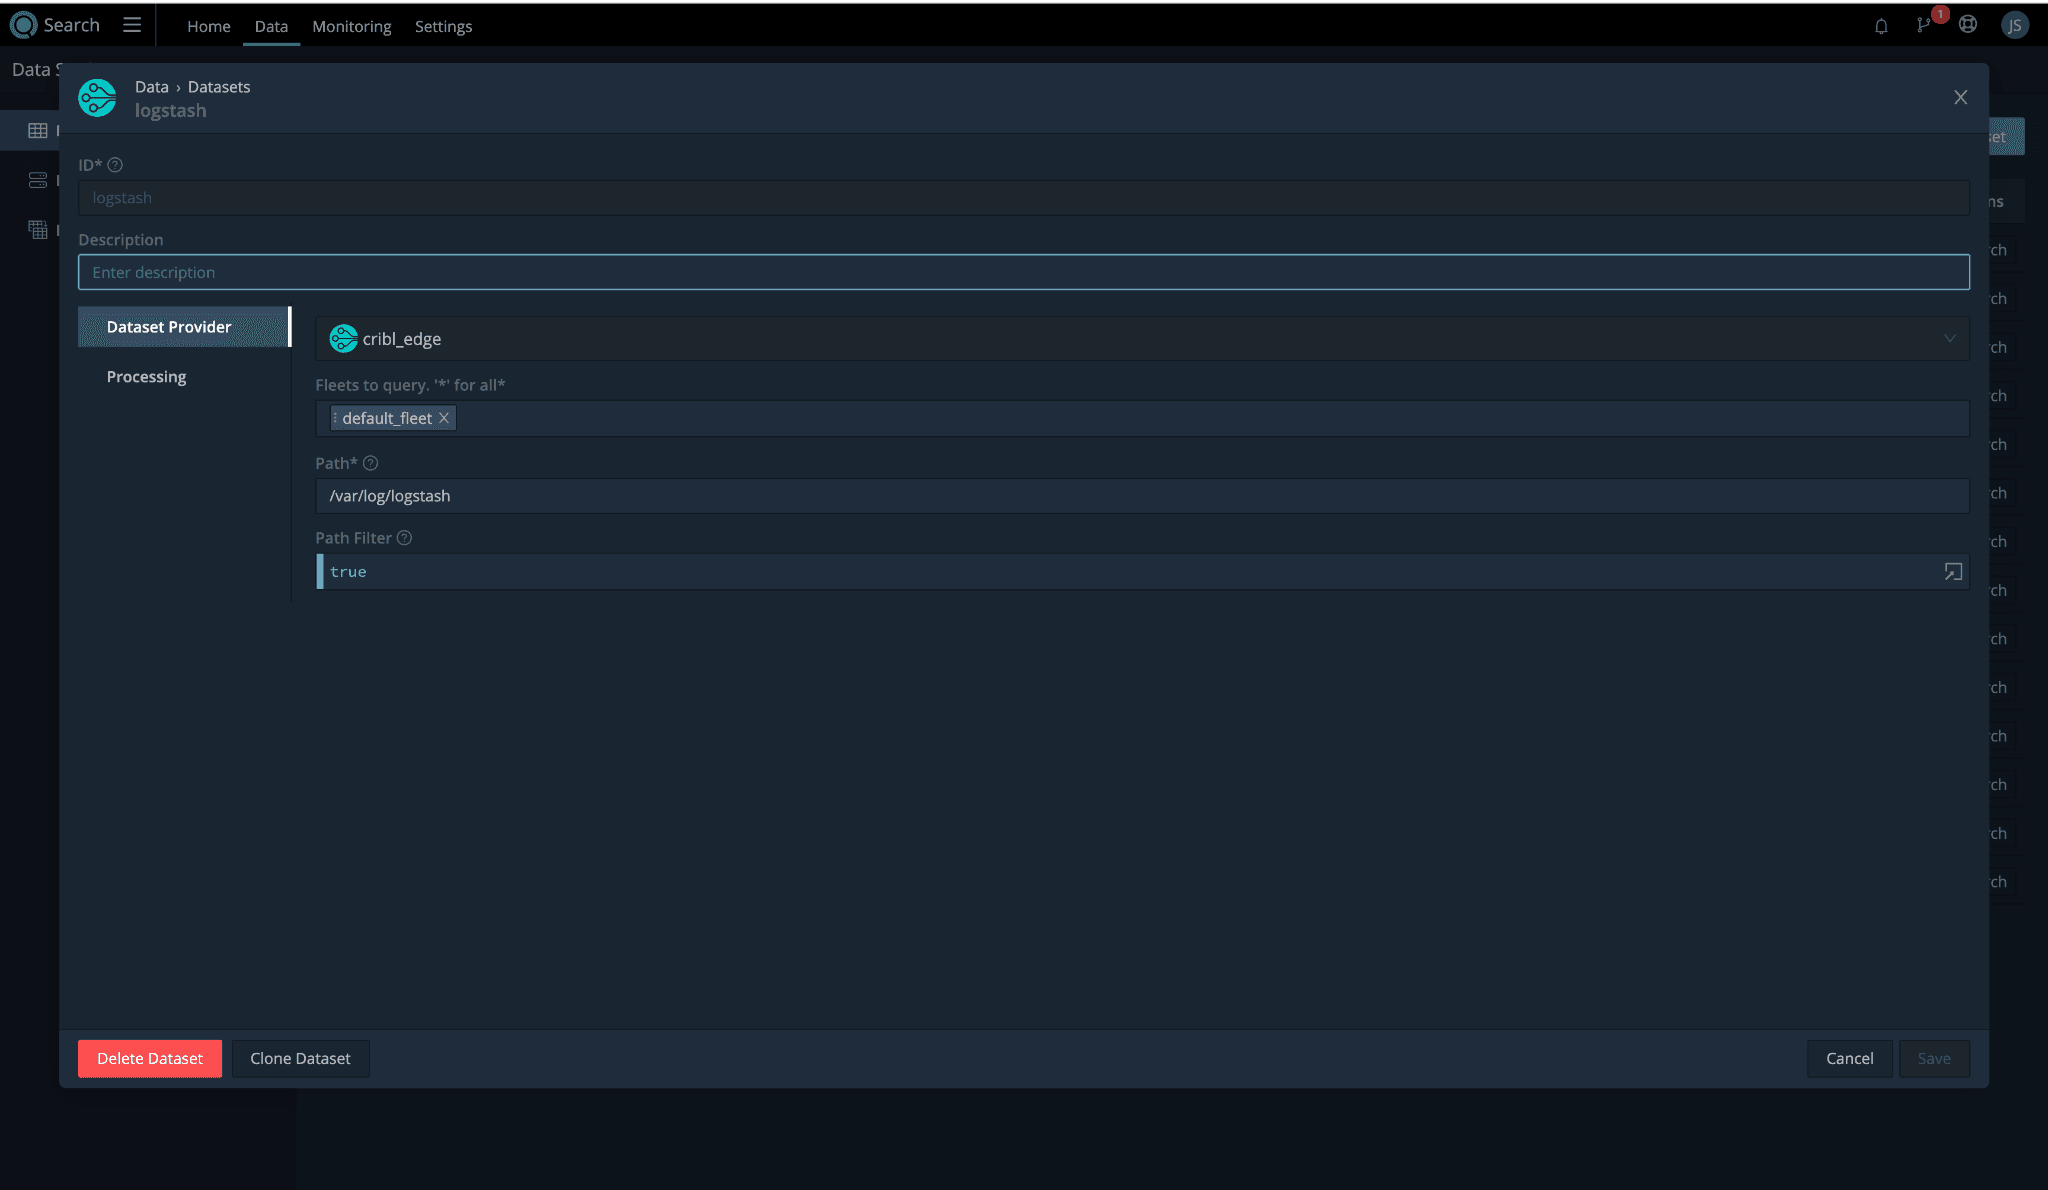
I added a new dataset using the cribl_edge data provider. I set the path to /var/log/logstash, and it was ready for a test drive.
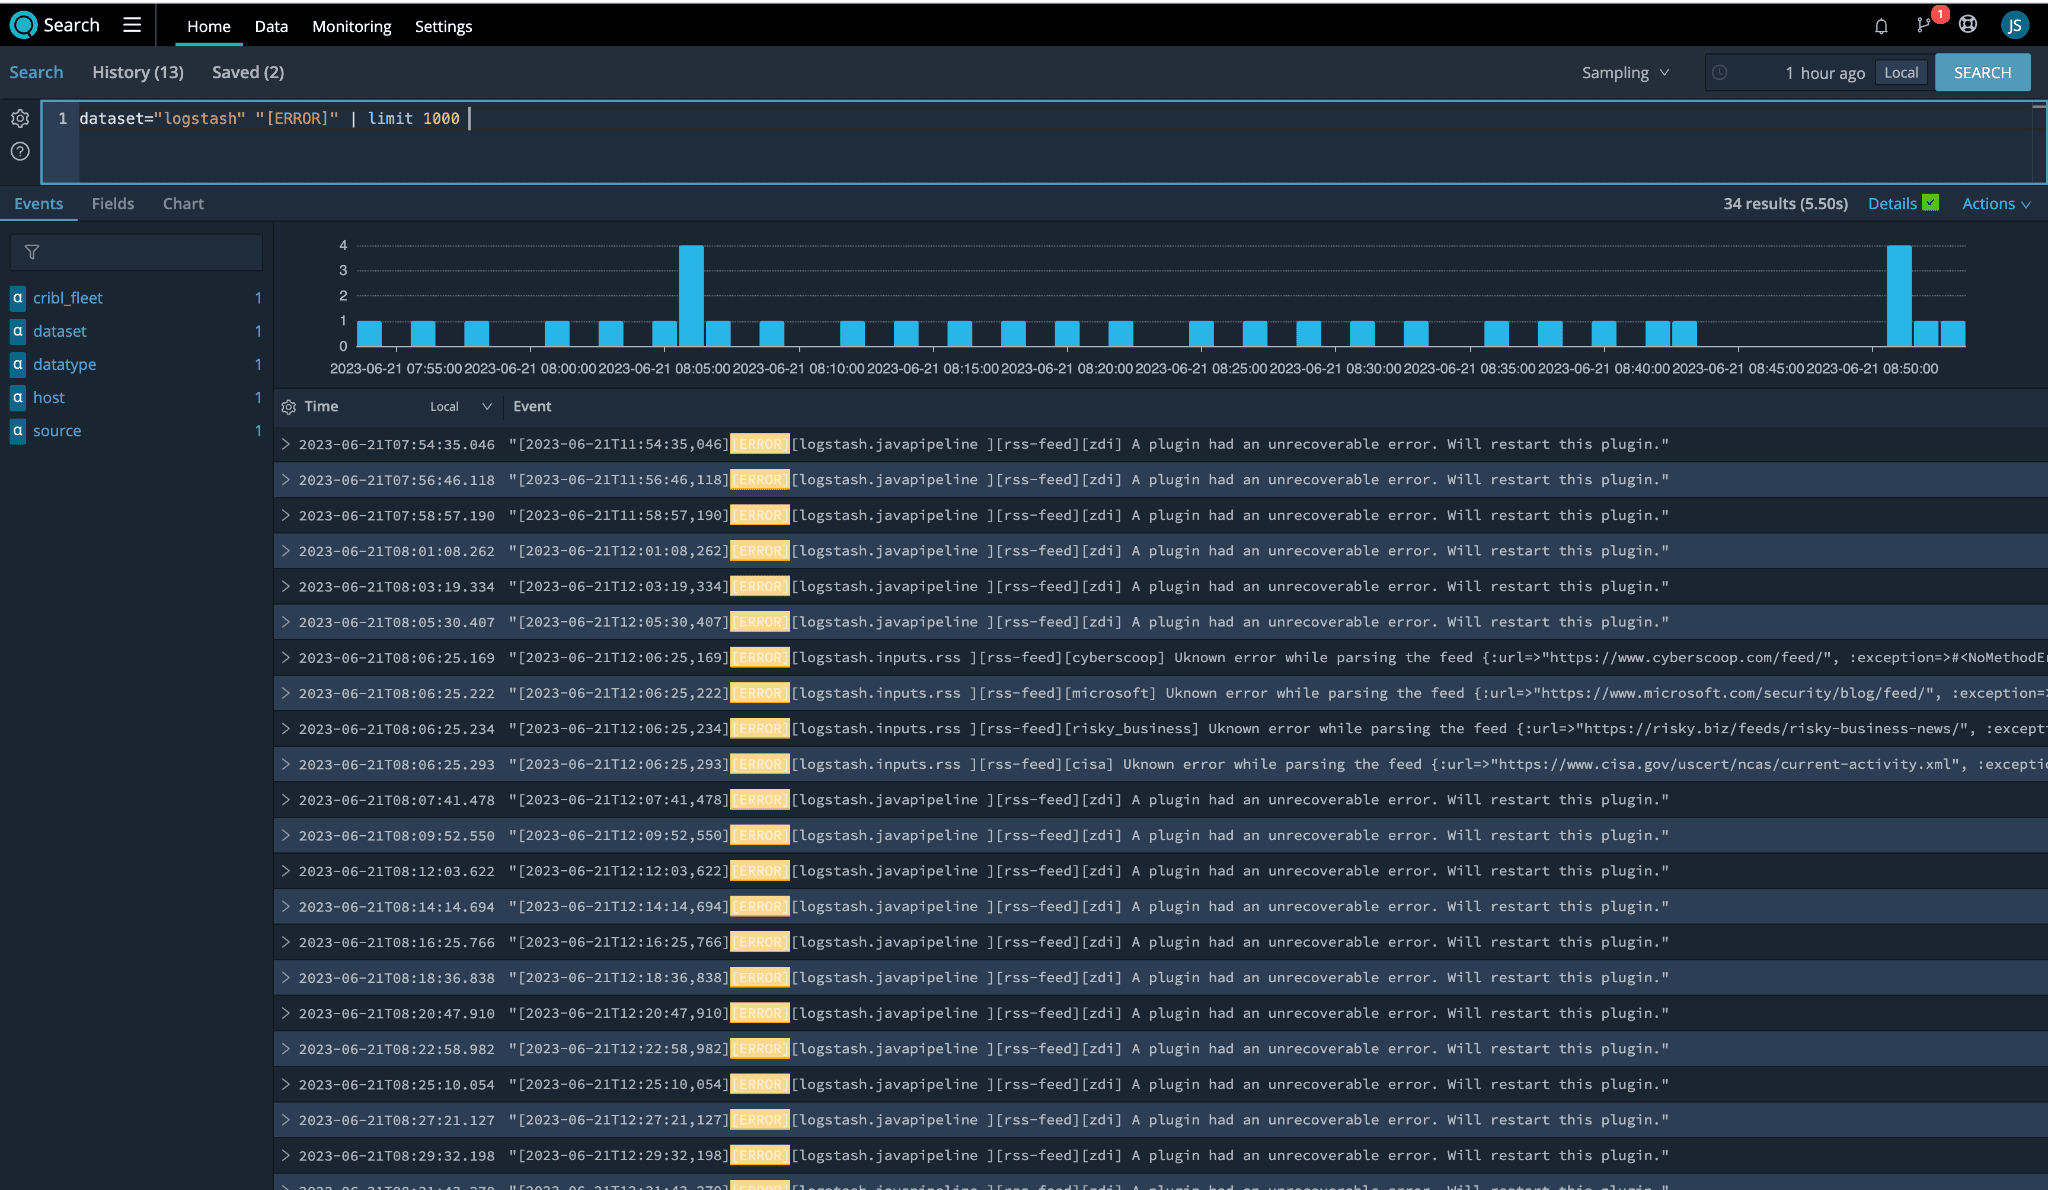
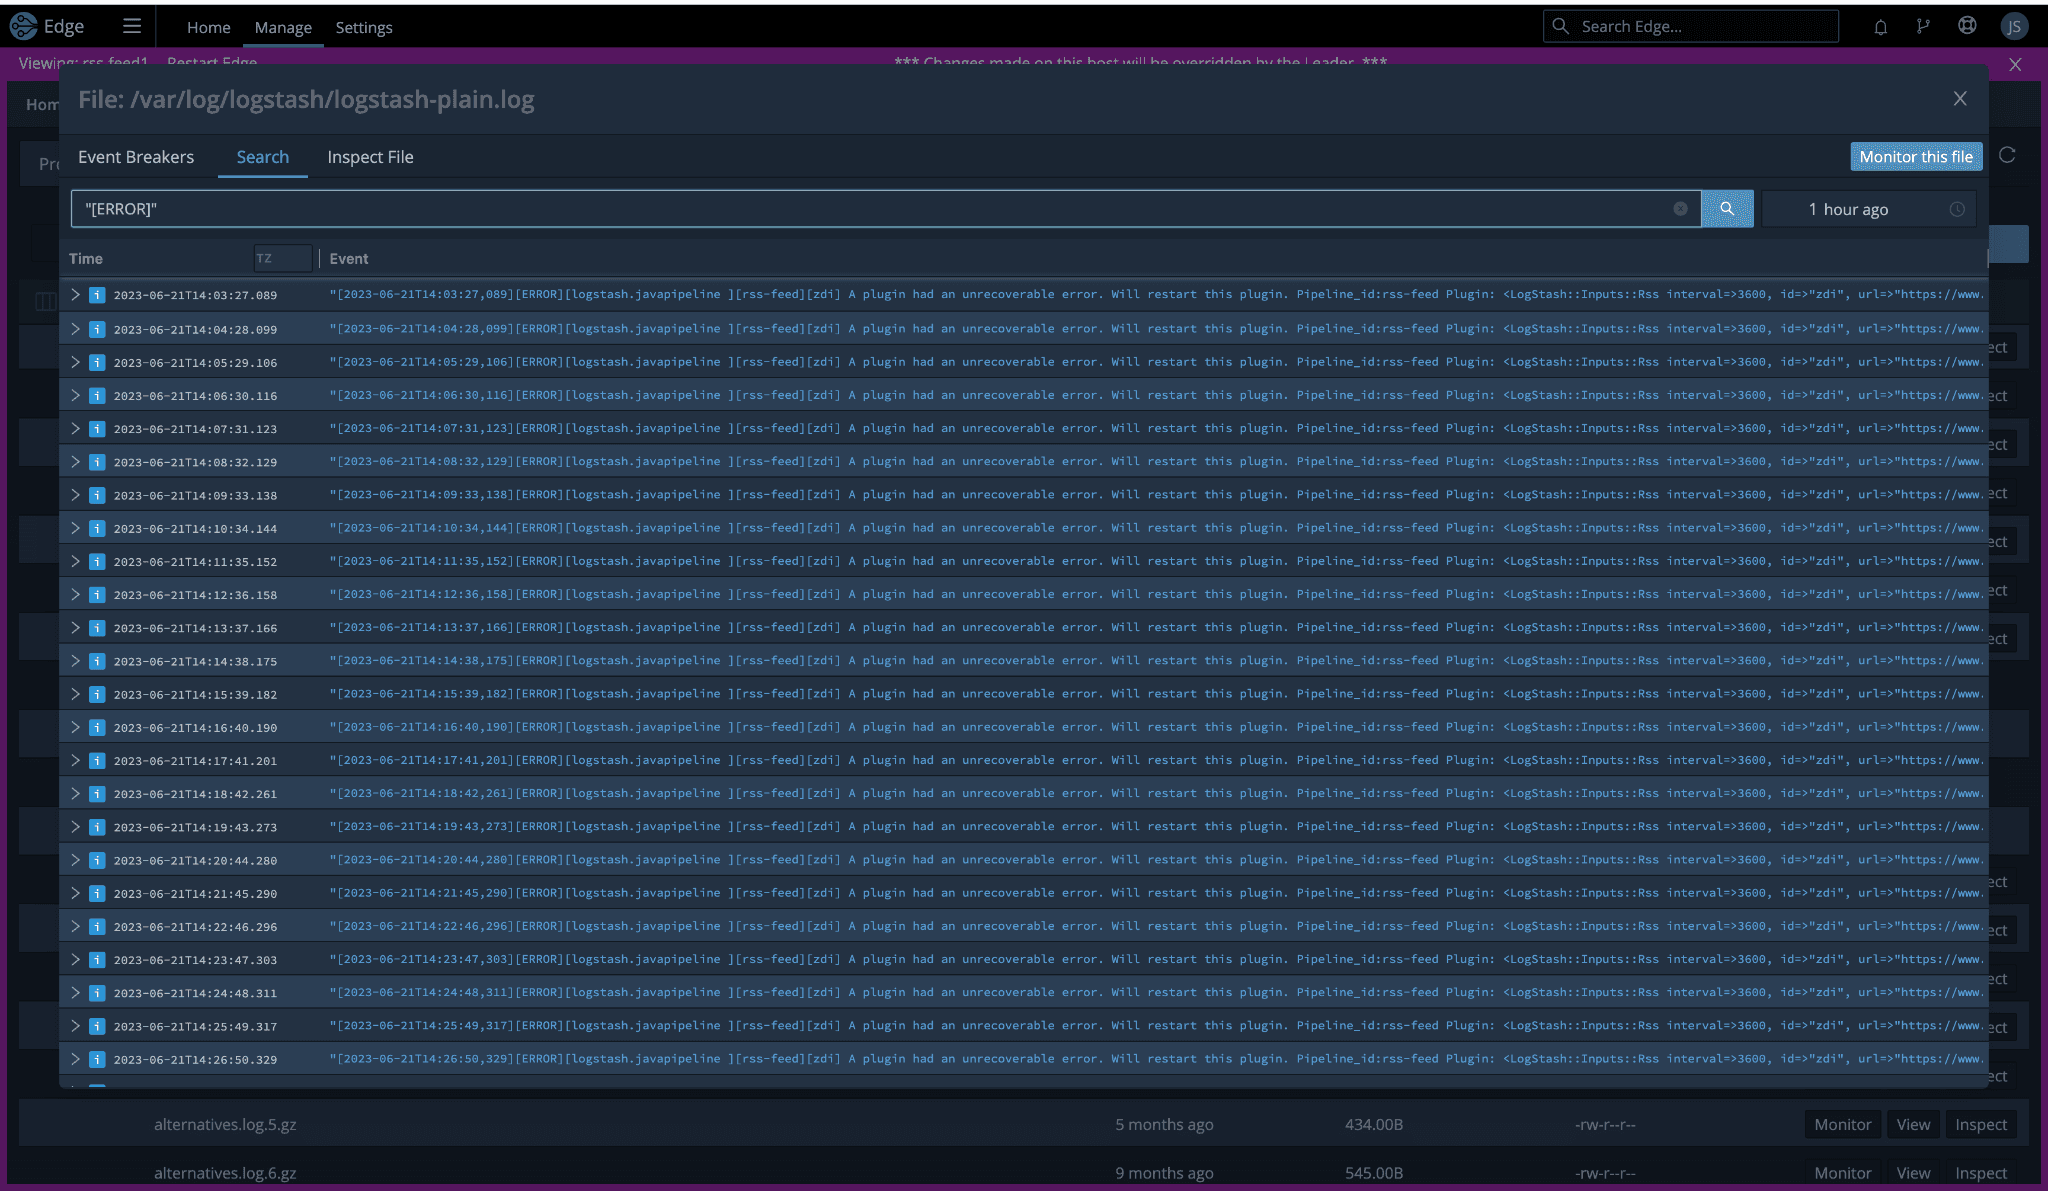
Cribl Search made it incredibly easy for me to identify the RSS feeds throwing errors by using the following query:
dataset=”logstash” “[ERROR]” | limit 1000. The results led me to the list of “problem children”:ZDI
Cyberscoop
Microsoft
Risky Biz
CISA
Surprisingly – and I was genuinely surprised – five feeds were associated with error logs. Quick reminder, we started with 24 RSS feeds and only see 19. The math is mathing, and I am here for it.
Now we can do the kombucha thing.
Wrap-Up
Edge and Search are game changers for ITOps, SecOps engineers, data observability enthusiasts, and the homies who like playing with the Cribl software suite. By leveraging Cribl Edge and Cribl Search, I can quickly troubleshoot and monitor my Logstash instance’s health. Some feeds still fall under the “…be broke” umbrella, but the improved visibility has streamlined my observability efforts. By choosing Edge and Search, I am not tied to maintaining any additional configuration files. My use case describes a small environment managed by one person, but imagine the efficiency and insight to be gained in an enterprise environment with a real-life team of more than one.