

Our previous post was all about dipping your toes into the wonderful world of API interaction. By leveraging Cribl’s API you can automate many parts of your event pipeline management and tasks. So we got that goin’ for us. Which is nice.
One of the common use cases for the API I hear about is kicking off data collection automatically. Use cases include:
Part of a SOAR playbook could be an API call to Cribl to grab related events from a data lake. Automatically. In seconds.
Via a self-service portal, ad hoc ingest events that weren’t originally ingested into your analysis tier.
Dramatically shortening the retention in your analysis tier. Instead rely on inexpensive object storage, and Replay the data when needed.
Cribl gives you the tools to collect data when you want, from where you want, and to where you want. And with this post as a starting point, you can automate it all.
Real-world example
A client I worked with generated a total of 1500 TB/day logs. They could only afford 0.500 TB a day going into their log analysis tool. They didn’t want to plunk down the mountain of cash required to ingest all that data since almost none of it was needed. Most data was sitting idle in an object store. But there were times when it was needed. Searching through, and recovering, that data was a pain for their engineers. Response times and effectiveness suffered.
With Cribl, they could use a simple internal web page, calling the Cribl API, to collect up required events based on patterns, timeframes, etc, and ingest them on-demand. Only when needed. They got 99% of the benefits of their analysis tool without the requisite GDP of a small nation. Noice.
Goal
In this post we’ll dig into the API endpoint behind Replay interactions. We’ll do this by cheating: Use the web interface to clue us into the API calls required. When we’re done you should have a good idea of how to automate event Replays.
This Is Part II – As In: Start With Part I
Please review the Part I blog before continuing. Things like authentication and exploring the API calls in your web browser will come in handy, and will mostly not be repeated here.
Create Your Collector(s)
In Cribl Stream we have broken up sources into a few different categories: Collectors, Push, Pull, and Internal. The Collector section is what we’re covering here because we intend to collect data on demand, not in a continual fashion. Specifically for this case, we are focusing on an object store as the source of the data. Fortunately, our outstanding docs team has compiled a primer on setting up an object store for this exact purpose.
Note: Many of the settings are available at run time. For example, you can decide which pipeline and destination to send the logs to explicitly in the API call.
For this demo, in your collector config, define a field called __replay with a value of ‘testapi’. Also, under Result Routing, uncheck Send to Routes, and instead select the passthru Pipeline and devnull Destination. This is only so we minimize the impact to your environment especially while testing. Save your new collector.

Test Run Your Collector
Let’s validate your settings by clicking the run button for your collector definition:
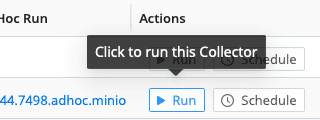
In the resulting dialog, leave it in Preview mode and click the Run button. You should get sample data showing in a capture window. If not, go back and check your authentication, endpoints, etc. We need this to be functioning before you continue. The in-app logs are often a good place to start troubleshooting, and you can increase the logging verbosity to glean more info.
Snoop Time
Alrighty then! We have a working collector. Go back into the Run dialog, as above. This time, click the Full Run option. For the Earliest time use -5m and now for the Latest. For the filter, use something bogus. We don’t really care about the results, we’re just grabbing the payload the API requires. Before clicking Run activate your browser’s dev mode. Once that’s up and ready, click Run. You should see a POST to the jobs endpoint, and in that POST you can find the payload.
If I grab that payload and pass it through jq, I can see the data more easily. It includes all the configs for the collector, as well as the run-time options. If you change any of the configs, it only impacts the one run. It does not change the config of the Collector.
In order to kick off the collection run we don’t actually need to post all the configs. However, it does allow you to make run-time changes to the configs if required.
Of particular interest are the special configs we added: The __replay field and the routing options under the input branch:
...
"name": "__replay",

"value": "testapi"
...

"sendToRoutes": false,

...
"output": "devnull",

"pipeline": "passthru"

...
We can update these values as needed when we run the API call. For example, if you’d like to send somewhere besides Davie Null, under the inputs section you can update output to be the output ID of where you really want the data to go. Maybe you want to write to an NFS share because your engineers just want the raw data. Next level: You can present the destination option to the end user. “Where do you want this? NFS share? Object store? Slack channel?” Dealer’s choice!
Curl It Up Nice & Tight
I’m going to use the following trimmed-down payload. The id field is the name (ID) of the collector I’m activating. The expression field is vital! This, along with the time qualifiers, will explicitly determine what data you are retrieving. The below sample captures the last hour of time, looking for events that contain mydata in the source field and _raw includes garbage. Any JS expression works in the expression filter. This filter would likely be part of the automation parameters.
The run branch of this object is required, as are type, ttl, and id. The input section is only there to override the pre-configured bits of the source.
{

"type": "collection",

"ttl": "5m",

"id": "minio",

"run": {

"rescheduleDroppedTasks": true,

"maxTaskReschedule": 1,

"jobTimeout": "300",

"mode": "run",

"timeRangeType": "relative",

"expression": "source.includes('mydata') && _raw.includes('garbage')",

"minTaskSize": "1MB",

"maxTaskSize": "10MB",

"earliest": "-1h",

"latest": "now"

},

"input": {

"type": "collection",

"sendToRoutes": false,

"metadata": [

{

"name": "__replay",

"value": "testapi"

}

],

"output": "devnull",

"pipeline": "passthru"

}

}
I stored this JSON object in a text file so I could refer to it with a curl call. Before you run it, start a capture session with __replay == ‘testapi’ as the filter. Give it a healthy capture time so it doesn’t time out before we have a chance to run. We just want to see that it produces events:

With the capture running in the background, run the curl command like so:
curl -X POST \

'https://main-yourinstanceid.cribl.cloud/api/v1/m/groupid/jobs' \

-H 'accept: application/json' \

-H "Content-type: application/json" \

-H "Authorization: Bearer $BT" \

-d @payload.json
The decoder key for this call:
Replace the instance ID with yours (or your leader node if on-prem)
Replace the
groupidwith yoursReplace $BT with your bearer token, or store the token in the env variable BT
See previous blog post about getting authenticated and using bearer tokens
Replace the path to the payload.json file as required
When you successfully run this, you’ll get output similar to the following:
{"items":["1698254544.7498.adhoc.minio"],"count":1}Quickly check out the capture running in your browser. You should see data showing up there pretty quickly. Hazzah! You can check under Monitoring → System → Job Inspector to see the job results and internal logs. Note you must select a worker group for that screen to populate.
Pythonification
I’ve taken the above proof of concept and translated it into a working python script. The details of the script are beyond the scope, but it’s not too tough to follow if you know python. (Please excuse my lack of pythonic dev skills.)
Next Steps
This blog demonstrates poking around the API and using a simple curl command to make Cribl search through an object store and selectively replay data. With this as a reference, you should be able to bake a similar call/process into SOAR scripts, self-service portals, and other automated events. Any part of the collector run could be parameterized, so the end user could choose the filter, where to send it, which pipeline to filter with, etc. Or not. Turns out, flexibility is a goat’s greatest asset!
What are your plans? If you have a novel use case, share it in the Cribl Community.
See ya next time, and stay curious!