If I had a penny for each time someone asked for a single pane of glass view across my 20 years in the application monitoring space, and I would be retired instead of writing this blog. But, on the other hand, I’d be in big trouble if I paid out each time we failed we finished that ask.
Don’t get me wrong, APM tools captured huge amounts of metrics and data, but only from the places they can exist – within the application, and even then, only the supported ones. A list that is growing smaller with each new iteration of the tech stack. The reality is that data from outside the application runtime is required to get a real “single pane of glass.” Every APM vendor has tried or is constantly trying to answer this question. And just when they think they have the landscape covered, the landscape changes.
Vendors like Dynatrace, AppDynamics, and New Relic started by adding host monitoring. So now we can see our CPU utilization beside our transaction response time on our pane of glass. What if the problem database is related, though? Not a poorly written query – we would see that from the APM side, but maybe an under-provisioned database instance or a delay caused by a locked table. So now we have added a database monitoring extension, so those metrics are on our dashboard.
And it did not stop there. Depending on the vendor, we are now seeing network add-ons, cloud add-ons (whatever that means), Kubernetes add-ons, and more half-baked integrations than you can count. Alongside all of this development work, the better APM vendors made the key decision to open the walled garden and accept metrics (and logs, in some cases) from anywhere, provided they are formatted correctly and don’t overload the platform.
The Silver Bullet Solution
That solution seemed like the silver bullet. Now, it was easy to saunter over to the app teams and tell them to get data from anywhere. Single pane of glass problem solved. Now all the dashboards will have all the data. The alerts will be multi-dimensional and perfectly correlated. The AI and ML built into the tools will provide the best predictive analysis.
Opening up the platforms now presented another issue. Getting the metrics, events, logs, and traces into the tool. While the APIs exist, they are usually heavily throttled not to overload the primary APM functionality and are highly sensitive to formatting and tagging.
I personally watched loads of app teams start projects to pull data from their source of choice – whether that was Splunk, Elastic, Netflow, or AWS – or eventually give up. Each source needed its own development, maintenance, firewall rule, and test cycles. That kind of overhead is not ever budgeted into the workflow of an application monitoring or SRE team.
Enter Cribl Stream
This problem is where Cribl Stream excels as it creates a single hub to ingest, translate, and reduce each stream down to only the required parts.
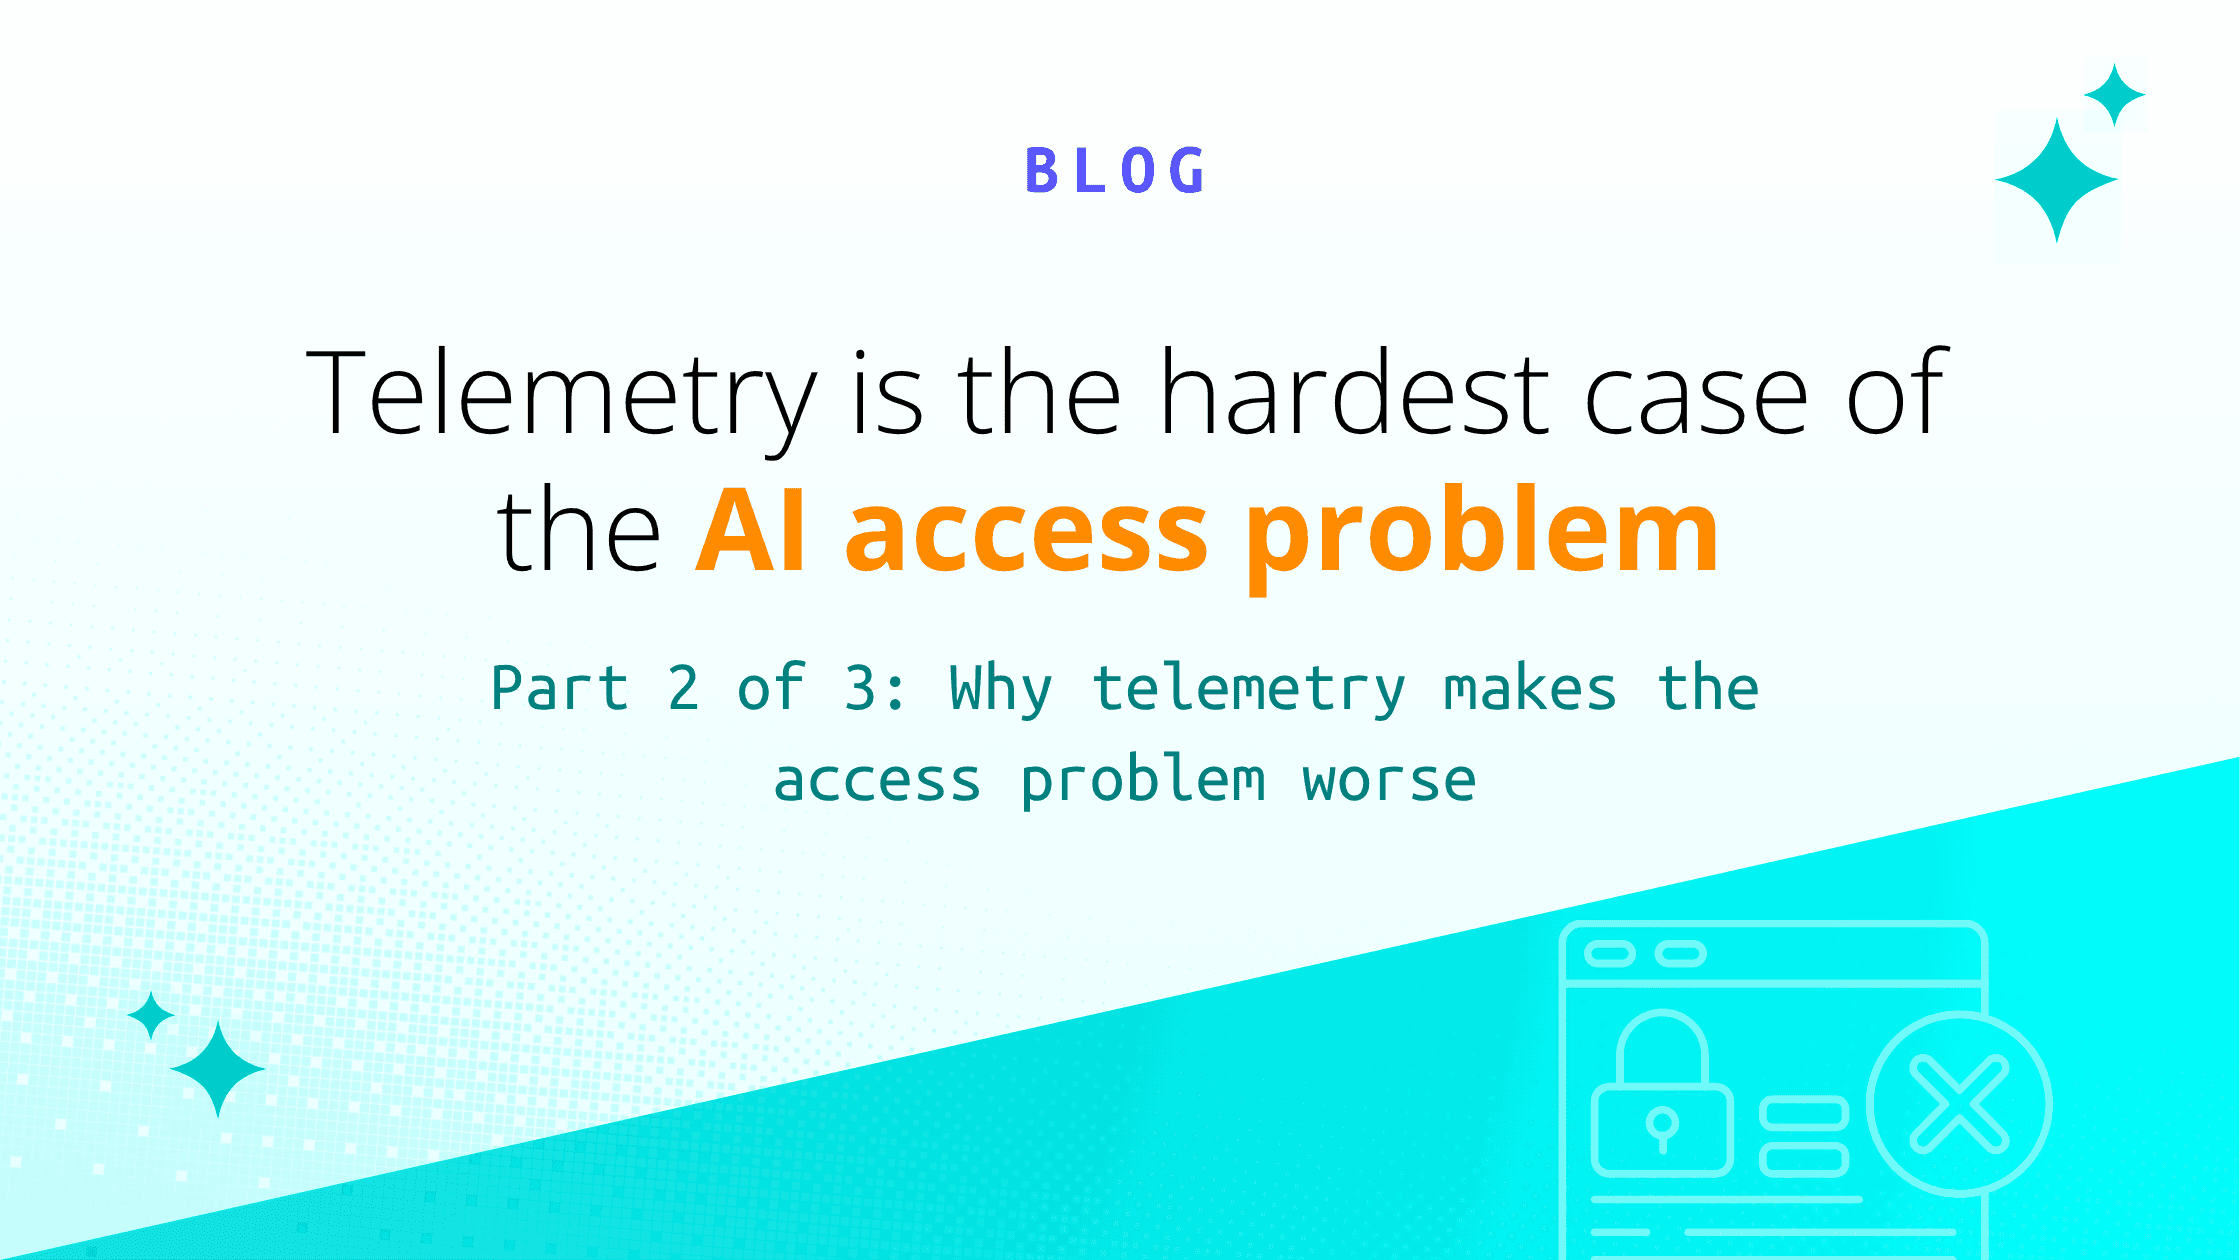
Let’s say the application team needs to compare traffic coming into their VPC to the traffic on the web servers to confirm user requests are being lost. The count, status, and size of the request would be sufficient for the dashboard and alerts in question.
No APM tool I am aware of can receive the full payload of VPC flow logs and translate them into the required format. In fact, most of their APIs would have to throttle the input under production load, surely resulting in data gaps.
With a few simple steps in Stream, we can reduce an entire log down to just a few bytes containing the required metric aggregations. Not just the metrics, but the dimensions as well. Let’s give you the logs, NetFlow, firewall, and SaaS statistics you need to finally add them to your dashboard and alerts.
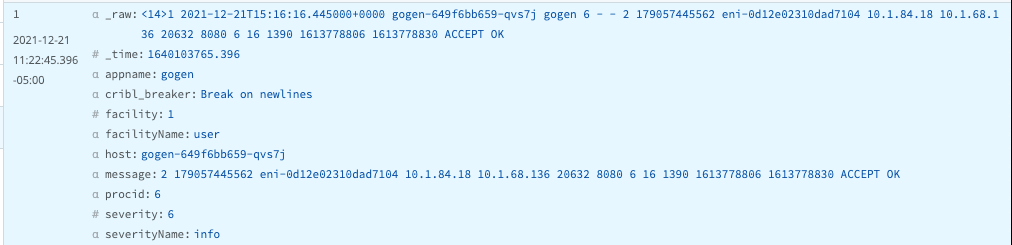
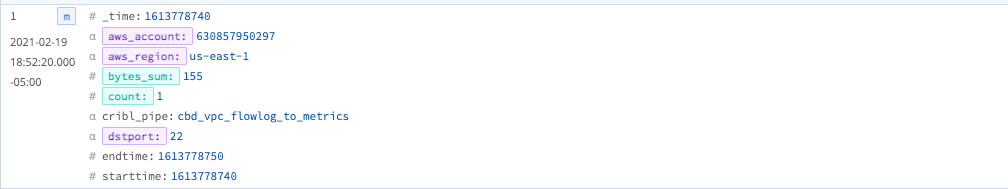
So there is the extraction of metrics (count and bytes_sum) sliced by three dimensions (aws_account, aws_region, and dstport). Below is the amount of reduction for each event, which will ensure the APM tool of choice does not throttle us back.
Did I mention Stream will do all of this above in an easy-to-use UI without interrupting the production flow of data? I would be happy to walk you through it. Send me a connection request over LinkedIn or join the Cribl Community so we can give you control and choice with your data.
The fastest way to get started with Cribl Stream is to sign-up at Cribl.Cloud. You can process up to 1 TB of throughput per day at no cost. Sign-up and start using Stream within a few minutes.