
Coming from an IT Operations background, I relied heavily on logs and metrics generated by the various platforms I supported to gain insights into the global deployments. The data points were often transformed into dashboards and alerts, allowing the team to monitor the environments effectively and remediate any issues that occurred in a timely manner.
Cribl Stream’s integration with New Relic One facilitates this solution. By sending Cribl Stream Metrics and Worker Node Logs through the platform and having them land in New Relic One, an Organization’s Operations team can monitor the Cribl Stream environment outside the direct infrastructure. In addition, the partnership between Cribl and New Relic has led to the development of an Instant Observability Stream Metrics dashboard that can be installed in an existing New Relic One environment via a Quickstart link. This dashboard extends the capabilities of the Monitoring console available in Cribl Stream today.
In this blog, we’ll not only configure Cribl Stream to send metrics to New Relic, but also launch the Quickstart dashboard and review the available metrics within the New Relic One platform.
Send Cribl Stream Metrics to New Relic One
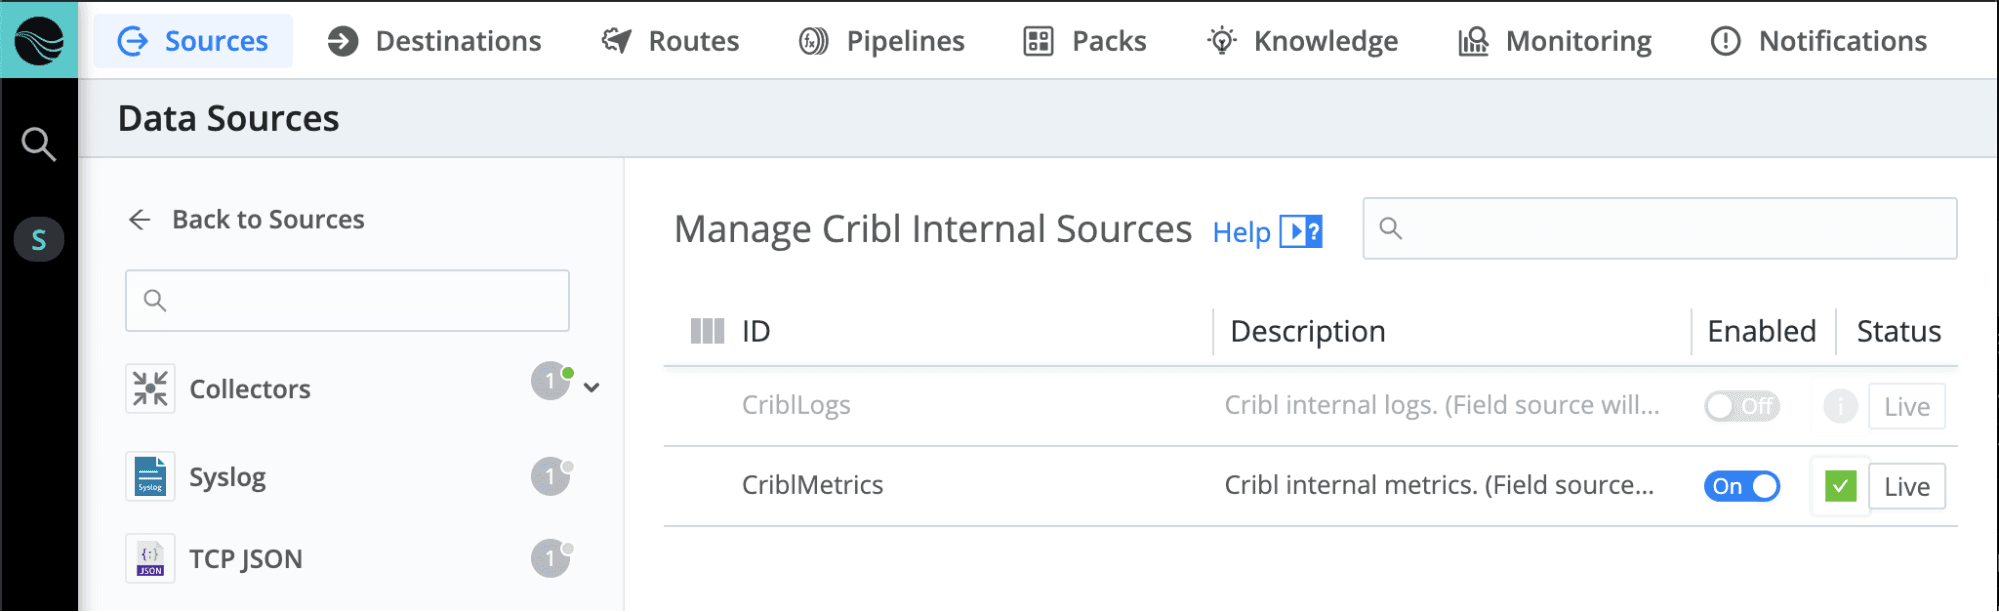
To begin generating the Cribl Stream Metrics, navigate to Sources → Cribl Internal and toggle the Enabled switch to On for the CriblMetrics input.
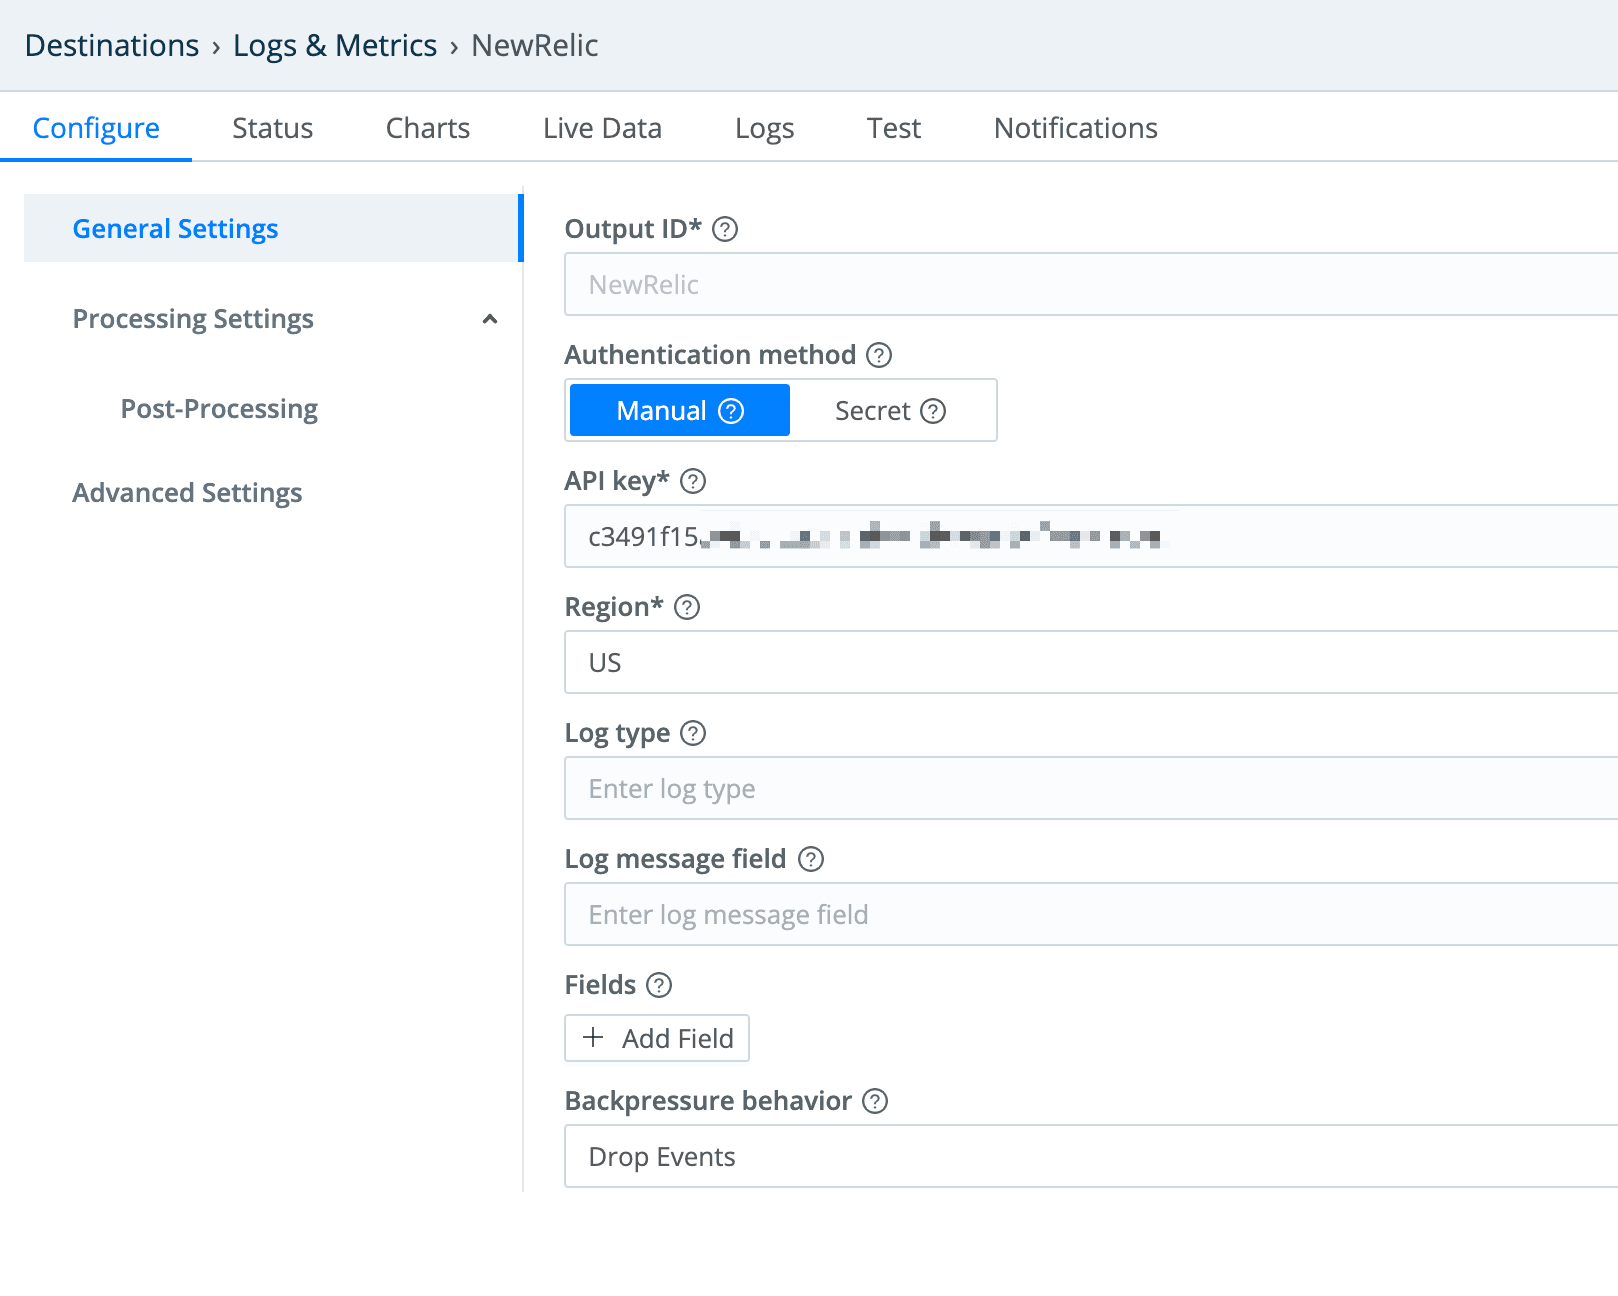
Next, we’ll configure the New Relic One Destination by navigating to Destinations → New Relic Ingest: Logs & Metrics. Select + Add New and configure the inputs specific to your New Relic One environment.
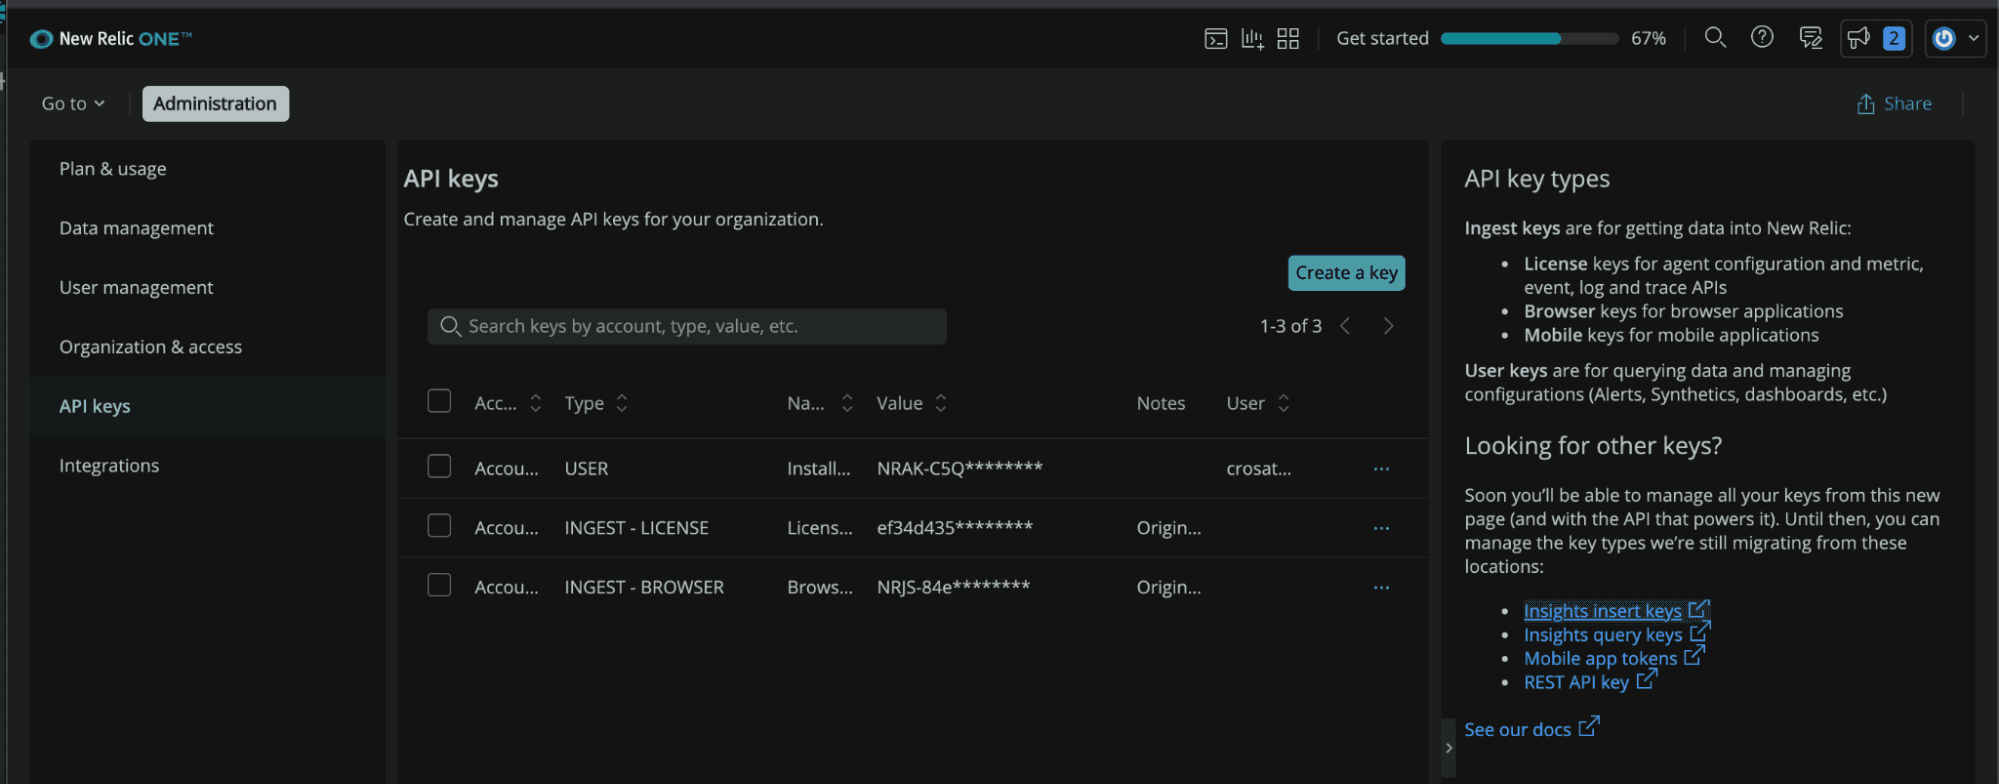
You must use an INGEST API Key from New Relic and can either copy an existing or generate a new key within the New Relic interface by navigating to Settings → API Keys → Create a Key
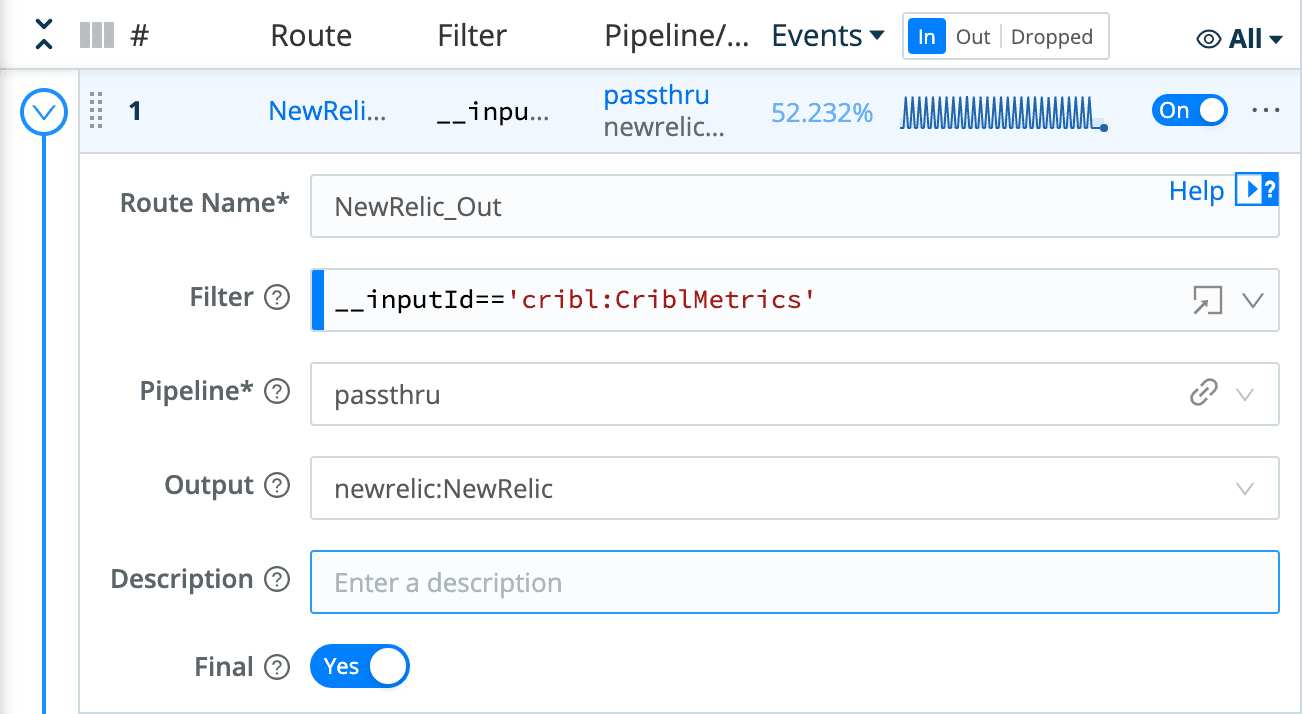
After both the source and destination are defined, create the Route to send the Cribl Stream Metrics to the New Relic One environment and Commit & Deploy the configurations.
Review Cribl Stream Metrics within New Relic One
Once you’ve confirmed that data is flowing through your Cribl Stream environment and into New Relic One, you can explore the metrics within the system.
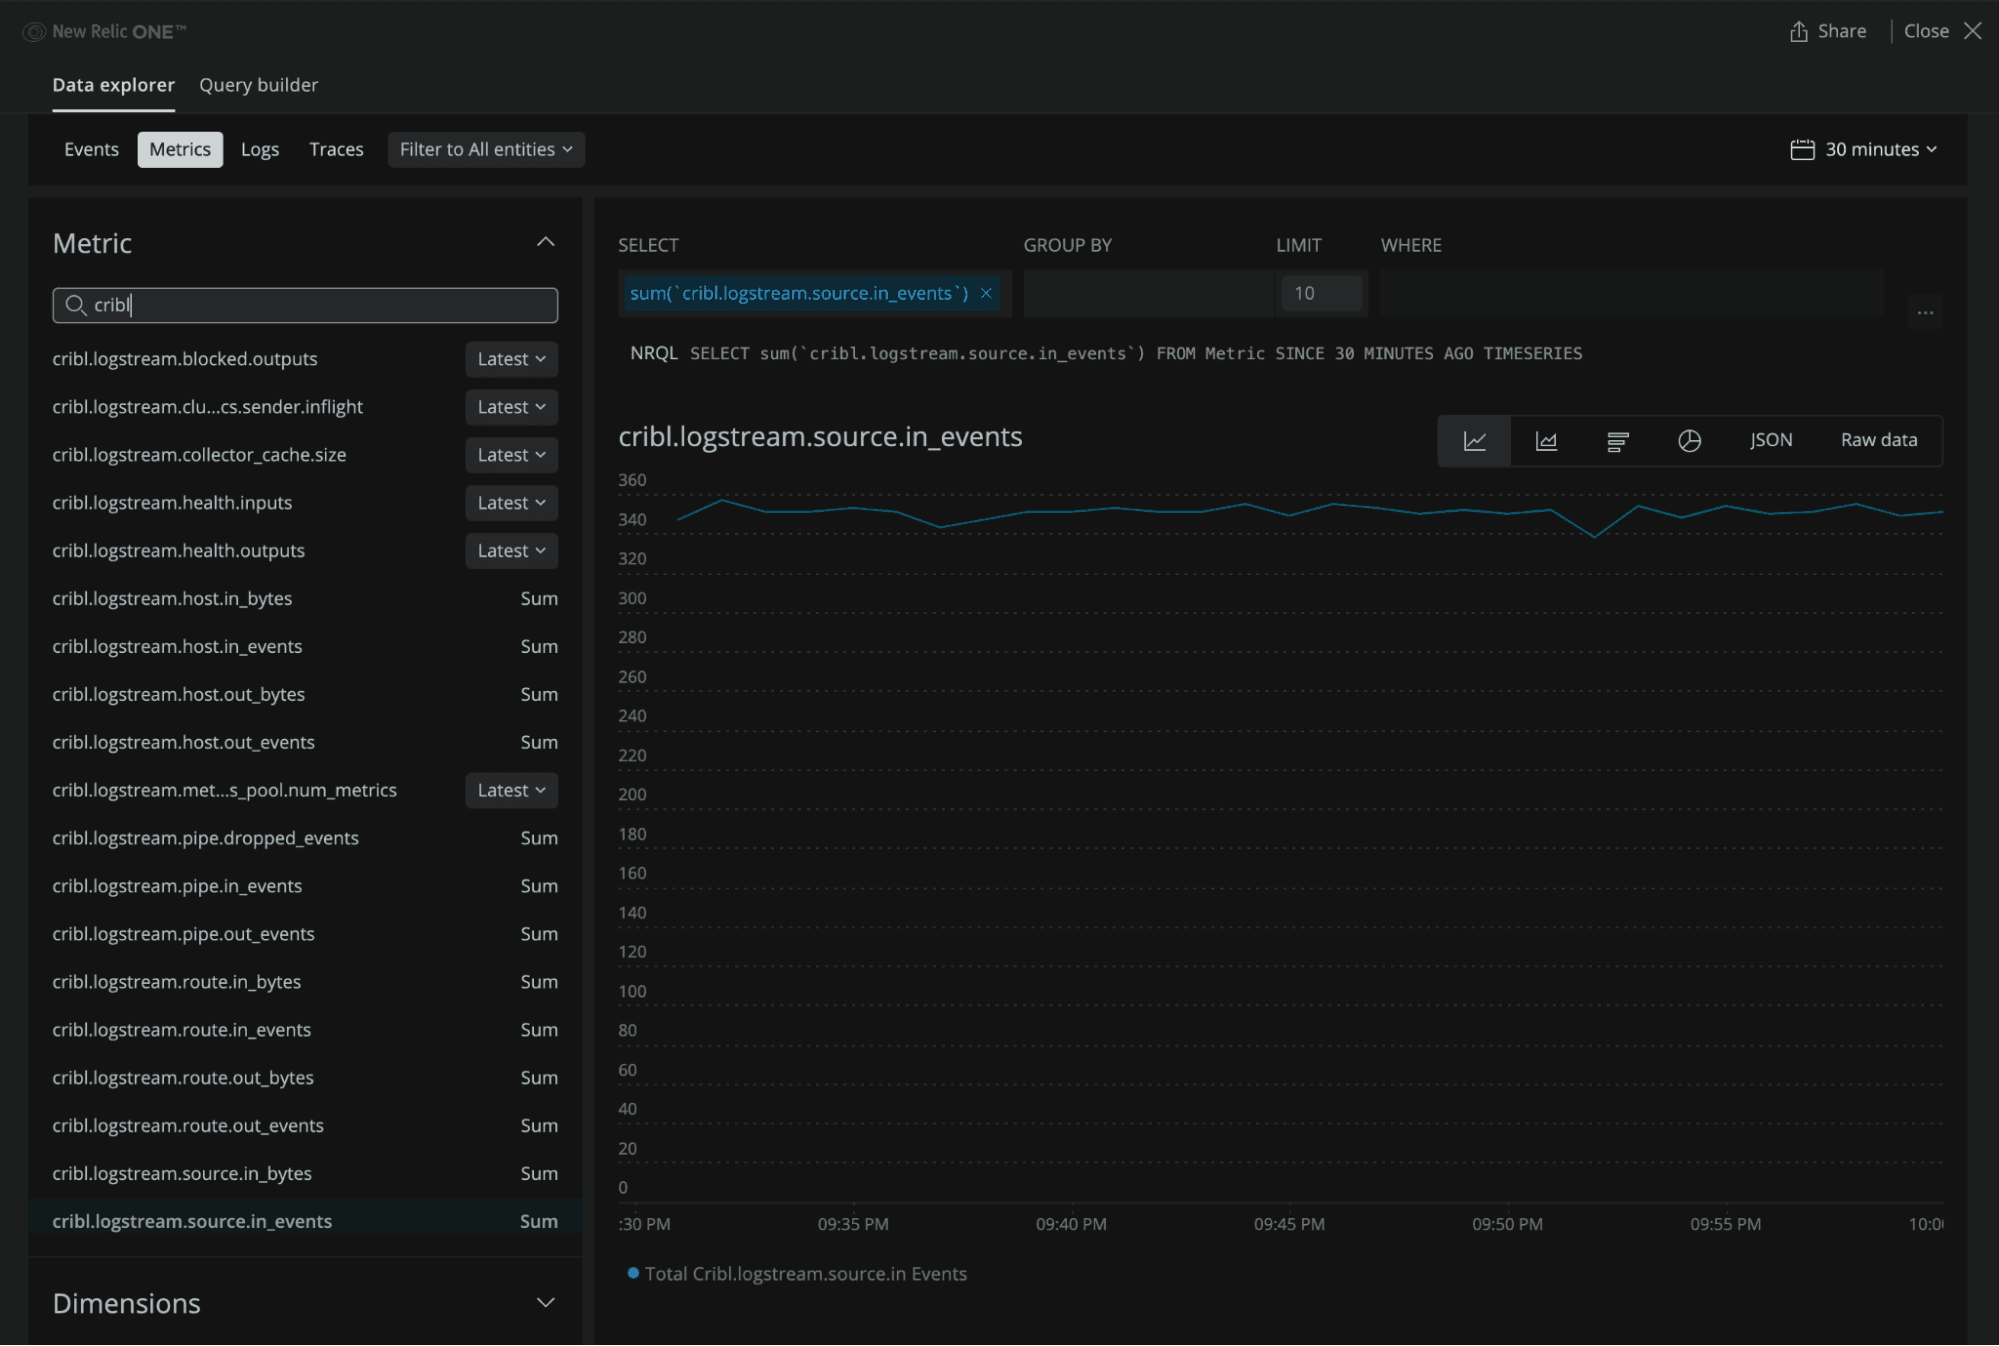
On the New Relic landing page, select Browse Data → Metrics from the horizontal navigation bar. This will generate a page that looks similar to the screenshot below. This view gives end-users the ability to search the various Cribl Stream metrics and review the dimensions the data can be filtered and split by.
Launch the Quickstart Cribl Stream Dashboard
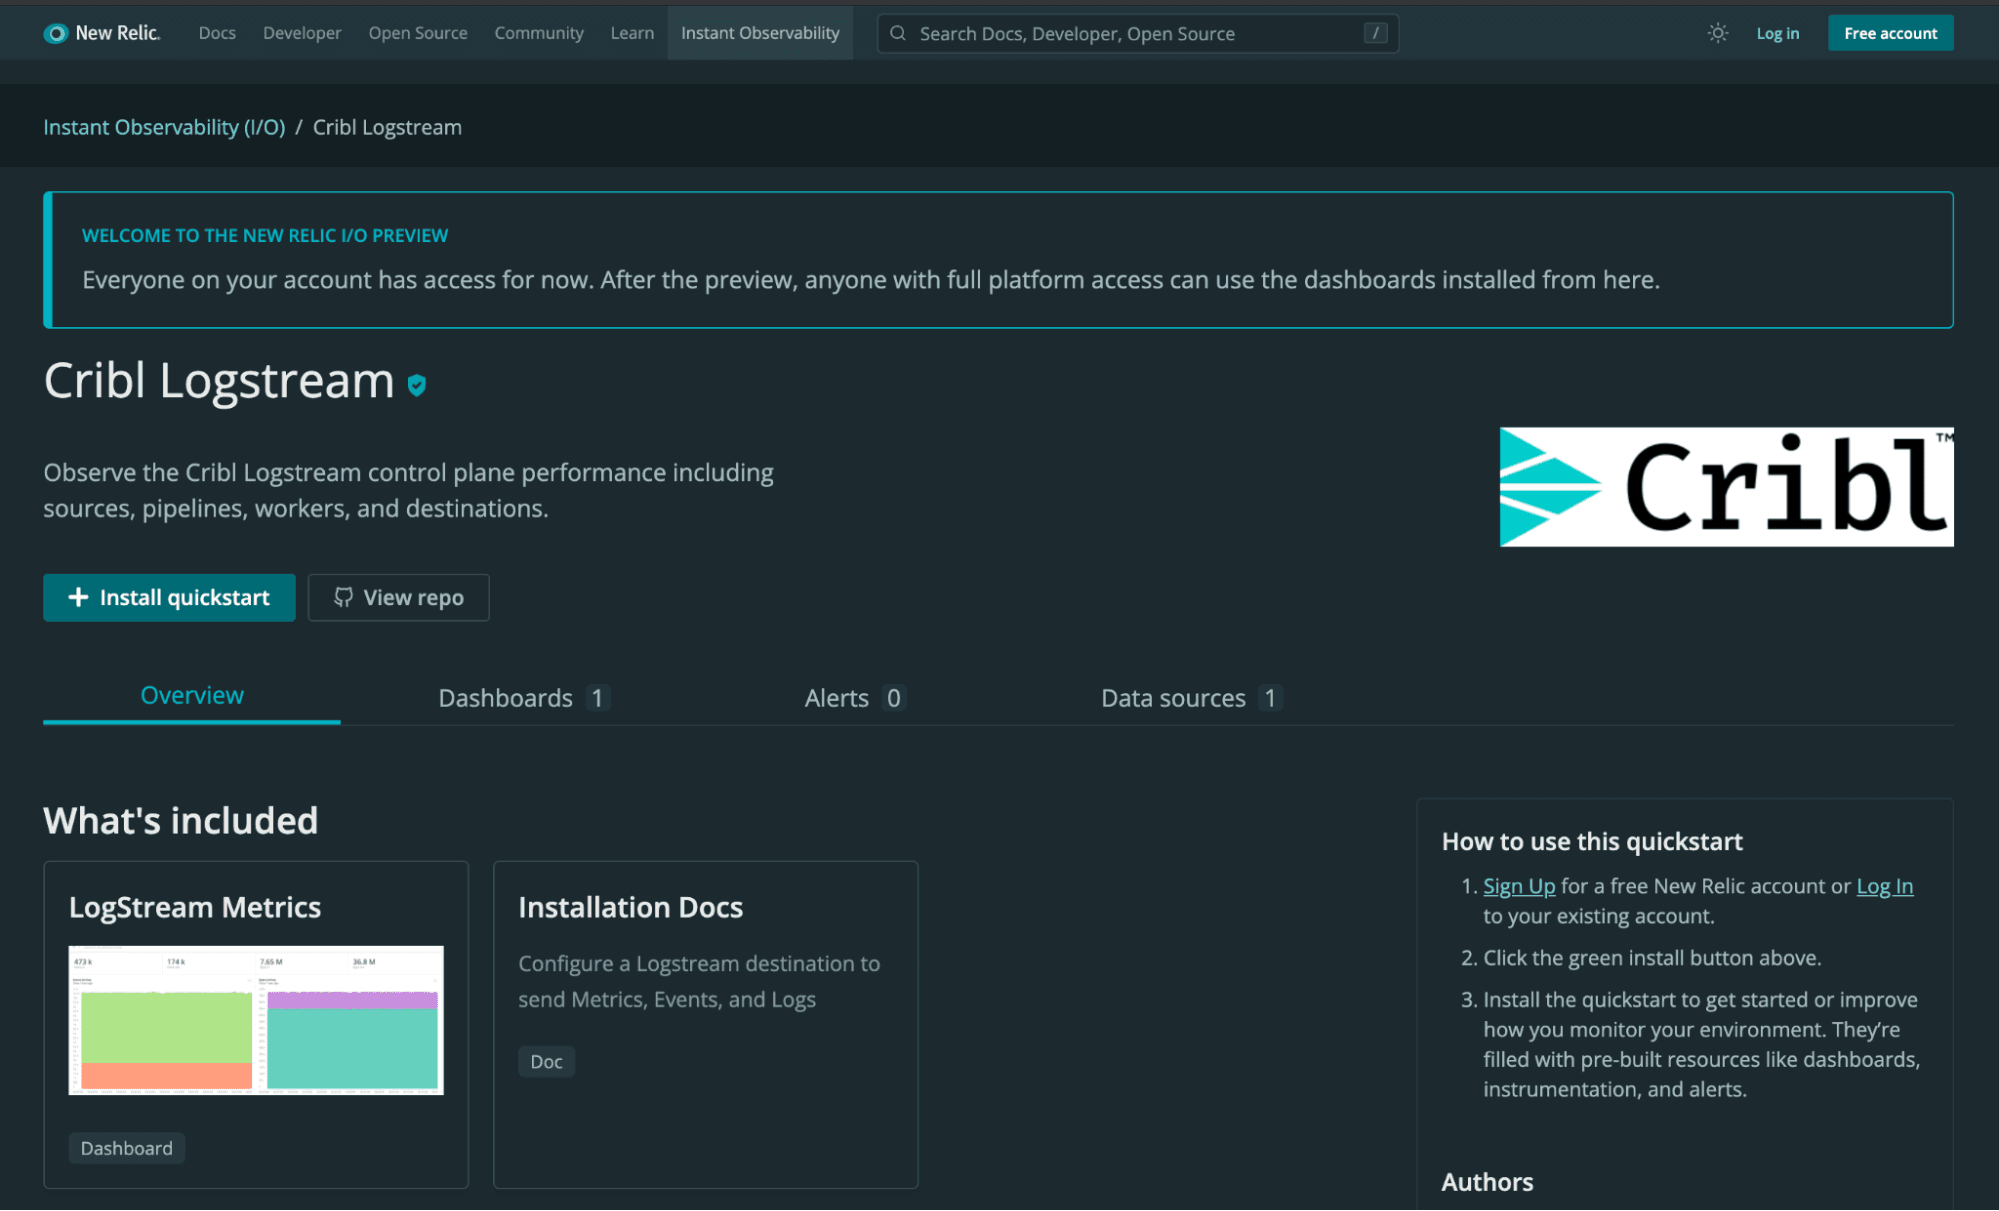
By installing the Cribl Stream quickstart dashboard available in New Relic’s Instant Observability marketplace, teams can quickly begin monitoring their Cribl Stream deployment and create alerts specific to their environment.
Navigate to the Cribl Stream Instant Observability (I/O) landing page and log in. Clicking the green +Install Quickstart button will redirect you to a page within your New Relic One instance to confirm and begin your quickstart installation.
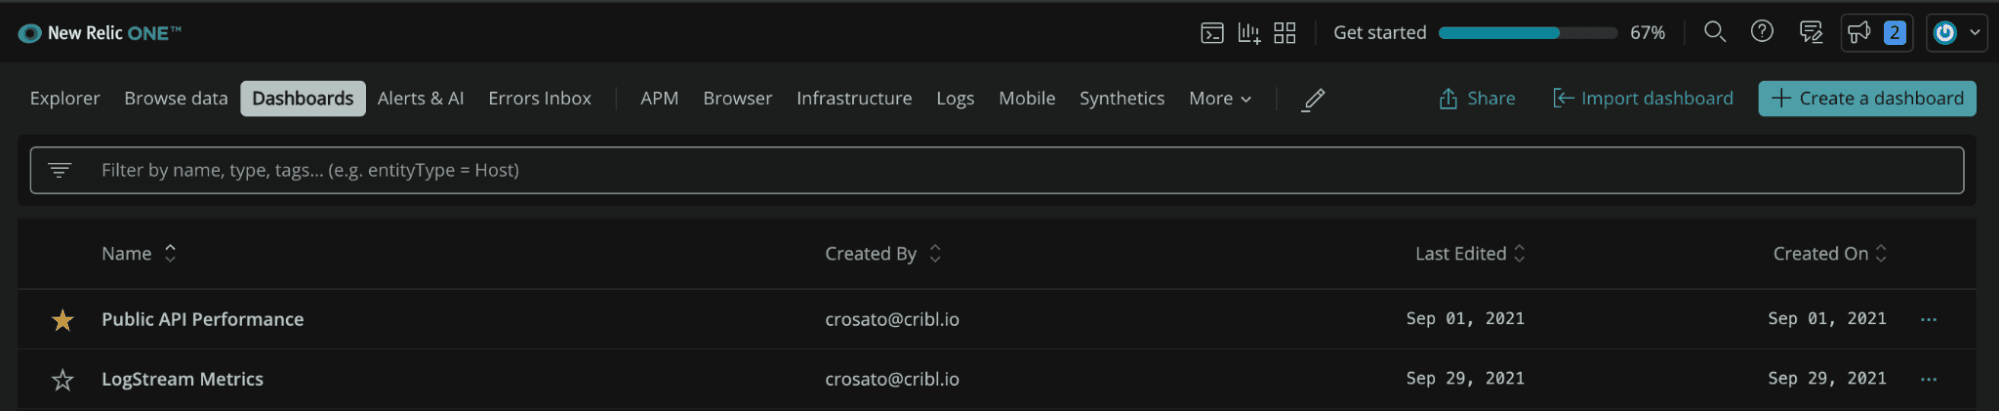
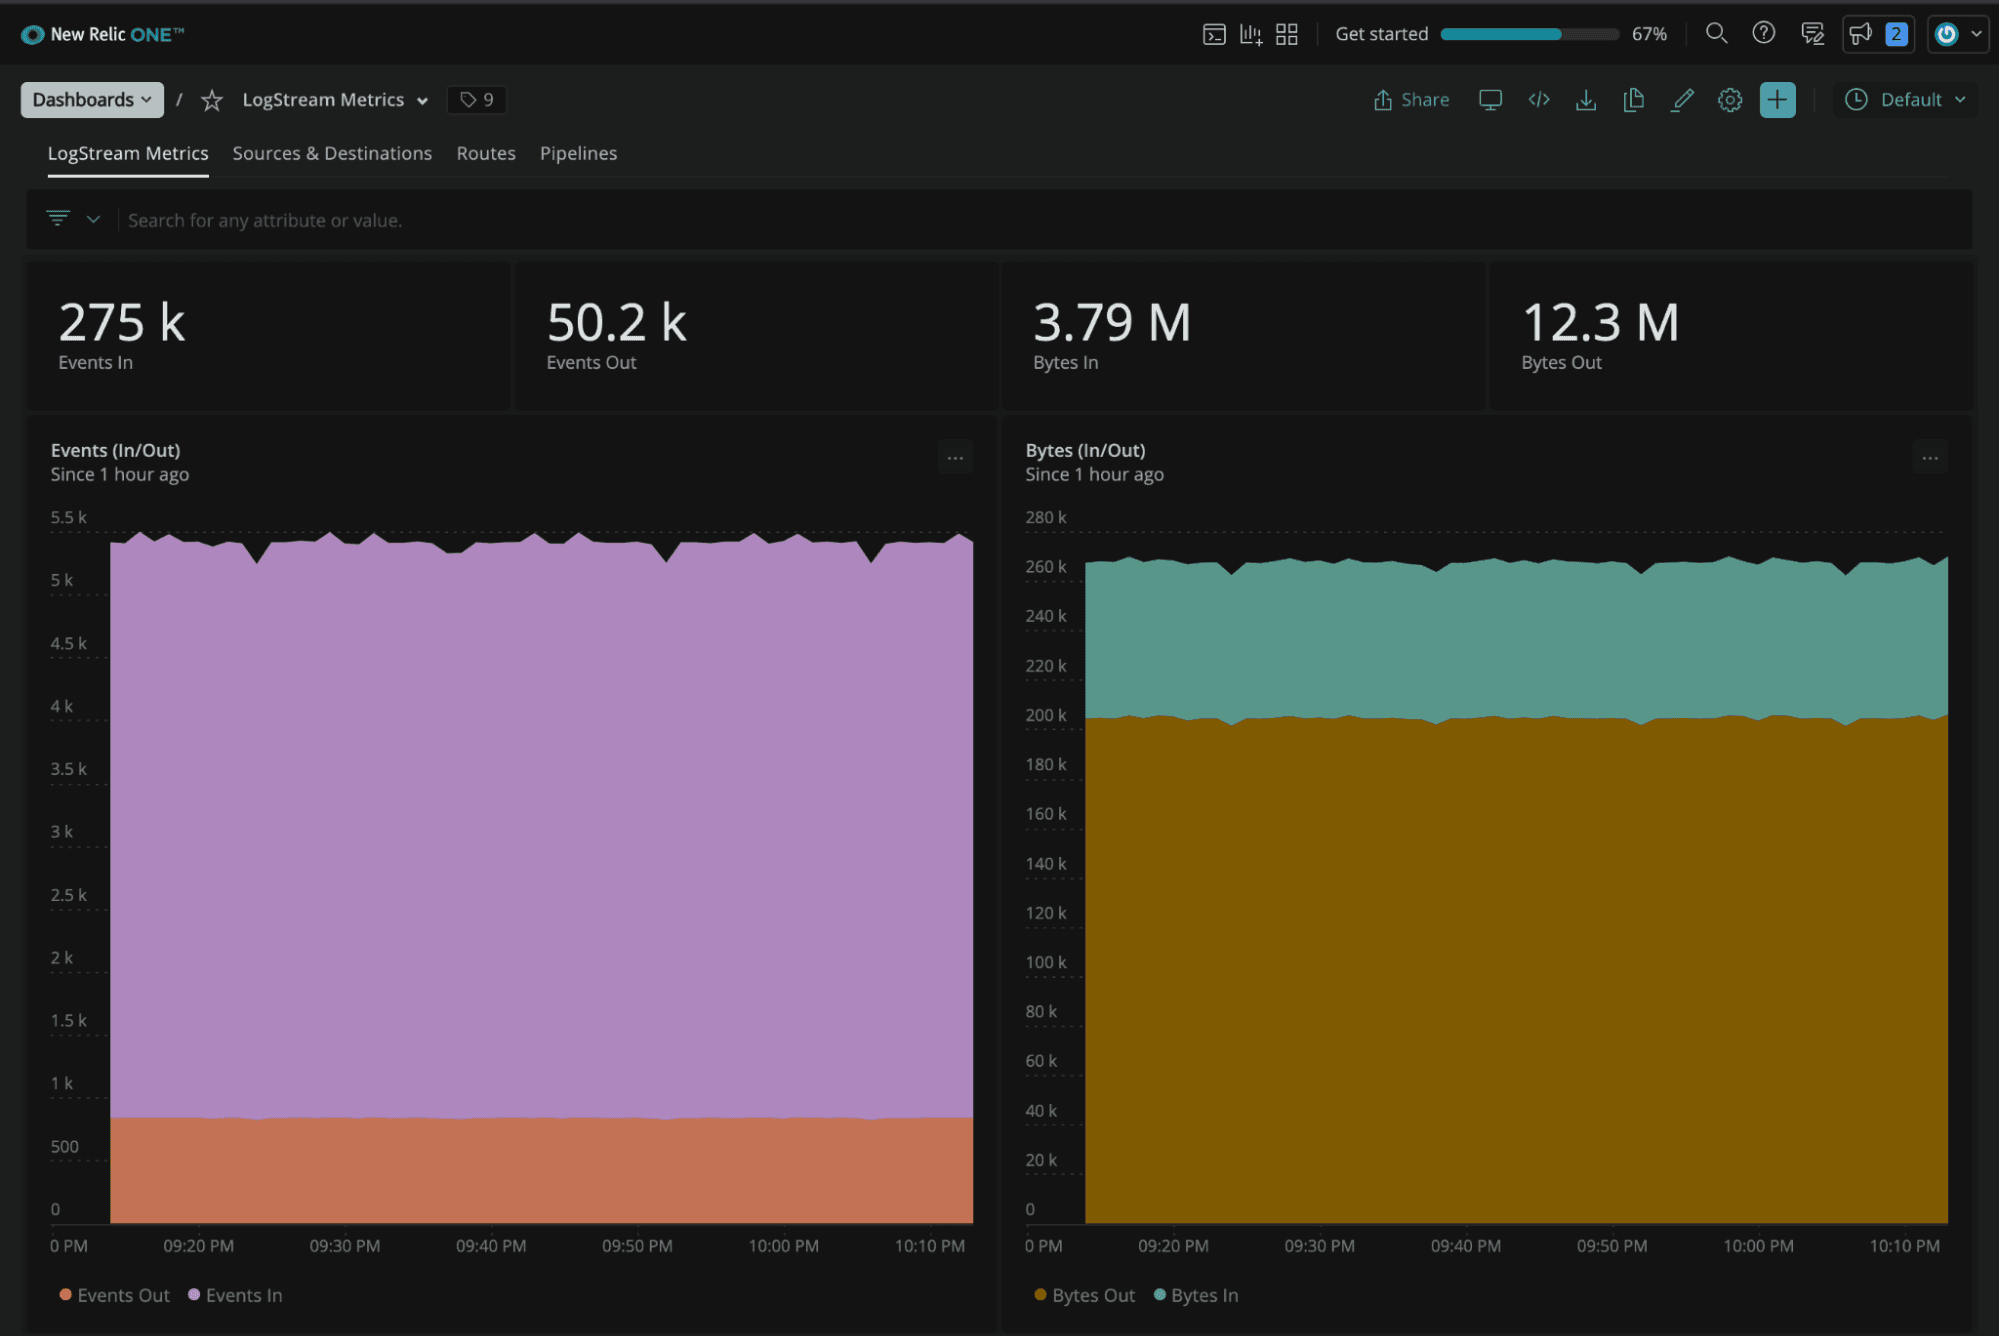
Once installed, you’ll see the LogStream Metrics dashboard available in your list of configured dashboards.
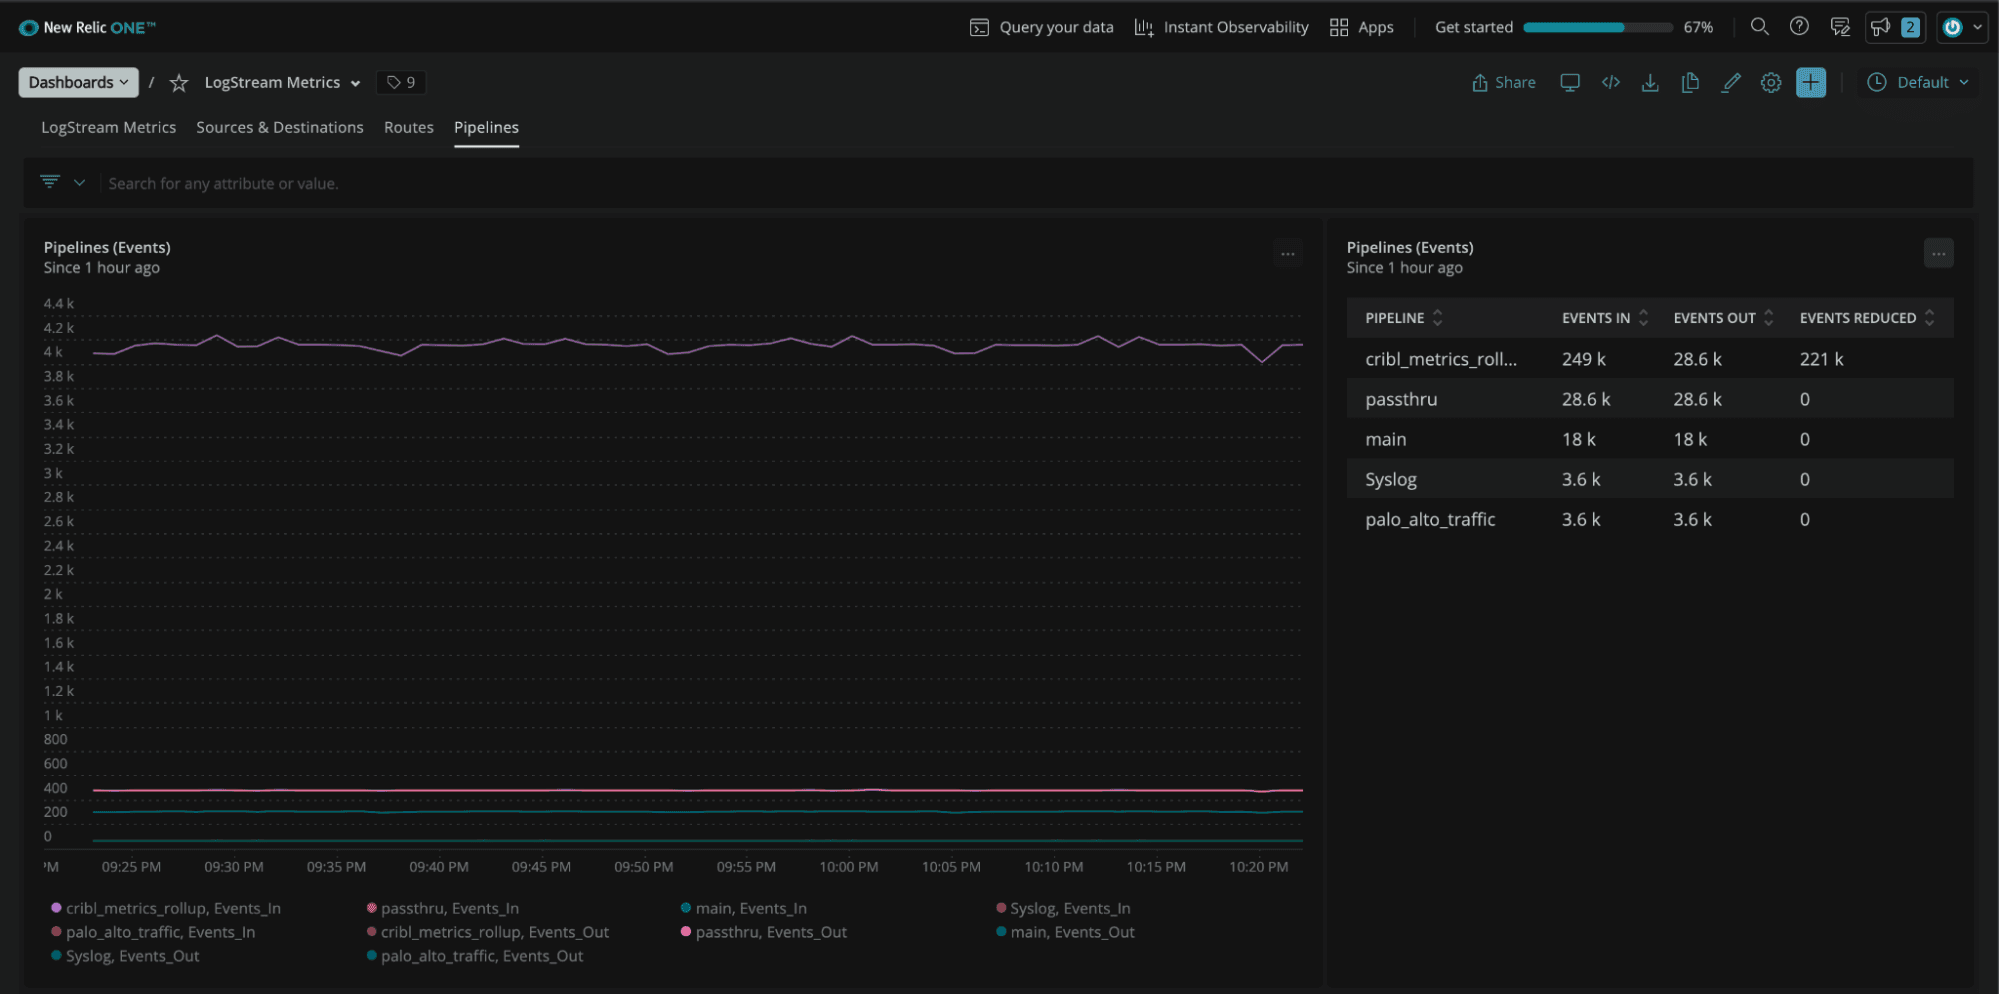
Drilling into the dashboard, you can view graphics and summary metrics similar to what exists on the Monitoring tab in Cribl Stream. In addition to the total Events and Bytes In/Out on the landing page, there are additional tabs outlining the volume of data being sent from the Sources to the Destinations and streaming through the various Routes and Pipelines. End-Users can also review reduction metrics associated with the Pipelines configured in their environment or use the filter feature for troubleshooting, by narrowing the scope (individual worker process, etc) of the presented data.
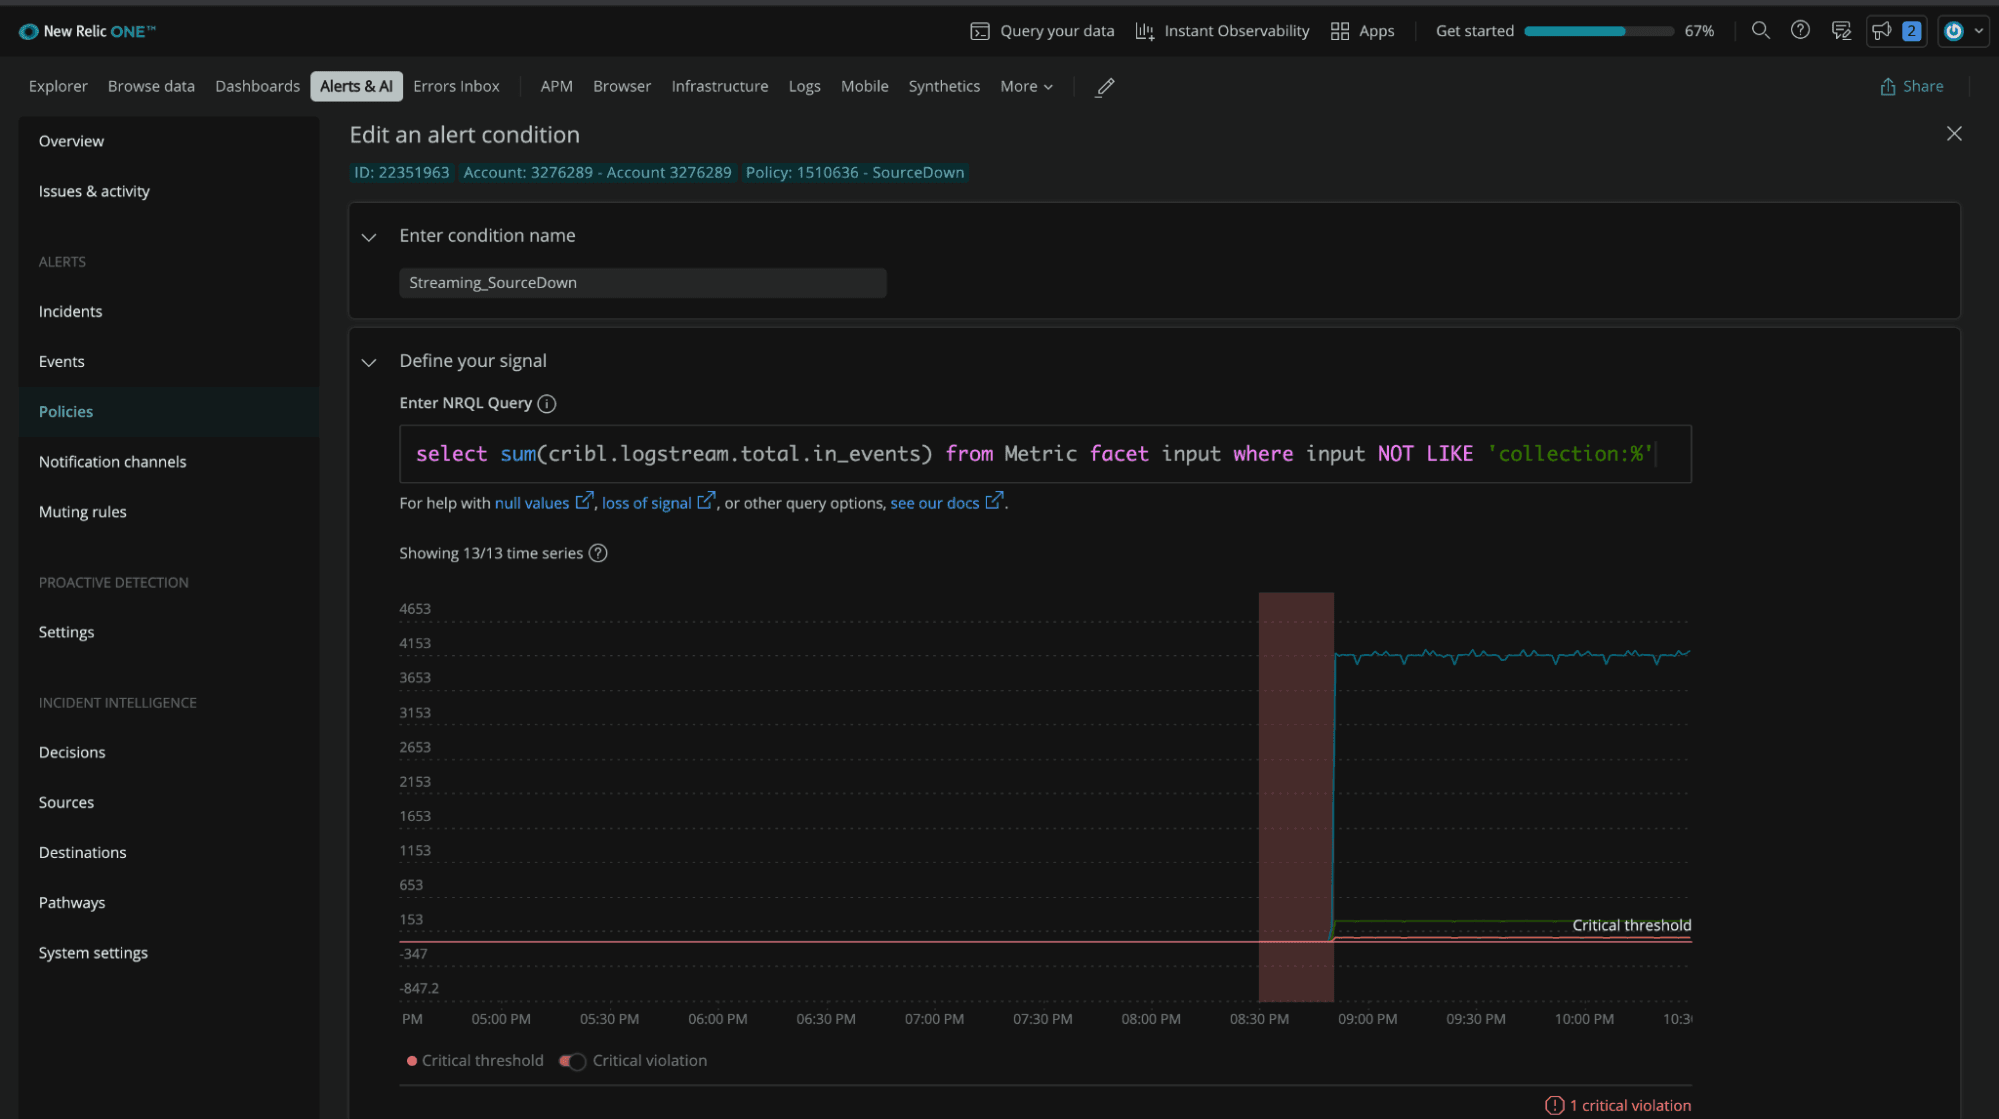
To enhance monitoring capabilities further, end users can configure custom alert conditions within New Relic One to trigger notification channels such as email, PagerDuty, Slack, and VictorOps. These alerts can be created in the Policies section of the Alerts & AI page and may include thresholds for specific Sources and Destinations or throughput restrictions for individual Worker Processes.
Cribl Stream gives you the freedom to choose your platform monitoring solution. And the initial setup is as easy as enabling the default metrics and sending them to your existing system of analysis. Feel free to explore the metrics dashboard we’ve configured for New Relic as inspiration, and know we’re always available to help on our Community Slack!