
An observability pipeline is the “first mile” that collects, transforms, and routes telemetry—logs, metrics, and traces—before it hits analytics or storage. For enterprises, the pipeline normalizes formats, enriches context, and reduces volume to control cost while preserving fidelity and compliance. The best platforms balance vendor neutrality, multi‑destination routing, cost governance, and deployment flexibility with strong breadth and governance in integration. Shortlist a dedicated pipeline layer (e.g., Cribl), a central control plane for multi‑tool routing and cost governance across all your observability and security platforms; consider integrated suites (e.g., Splunk, Datadog, Dynatrace) when you want end‑to‑end analytics and AI features within a single vendor’s stack.
Evaluation Rubric and TL;DR Picks
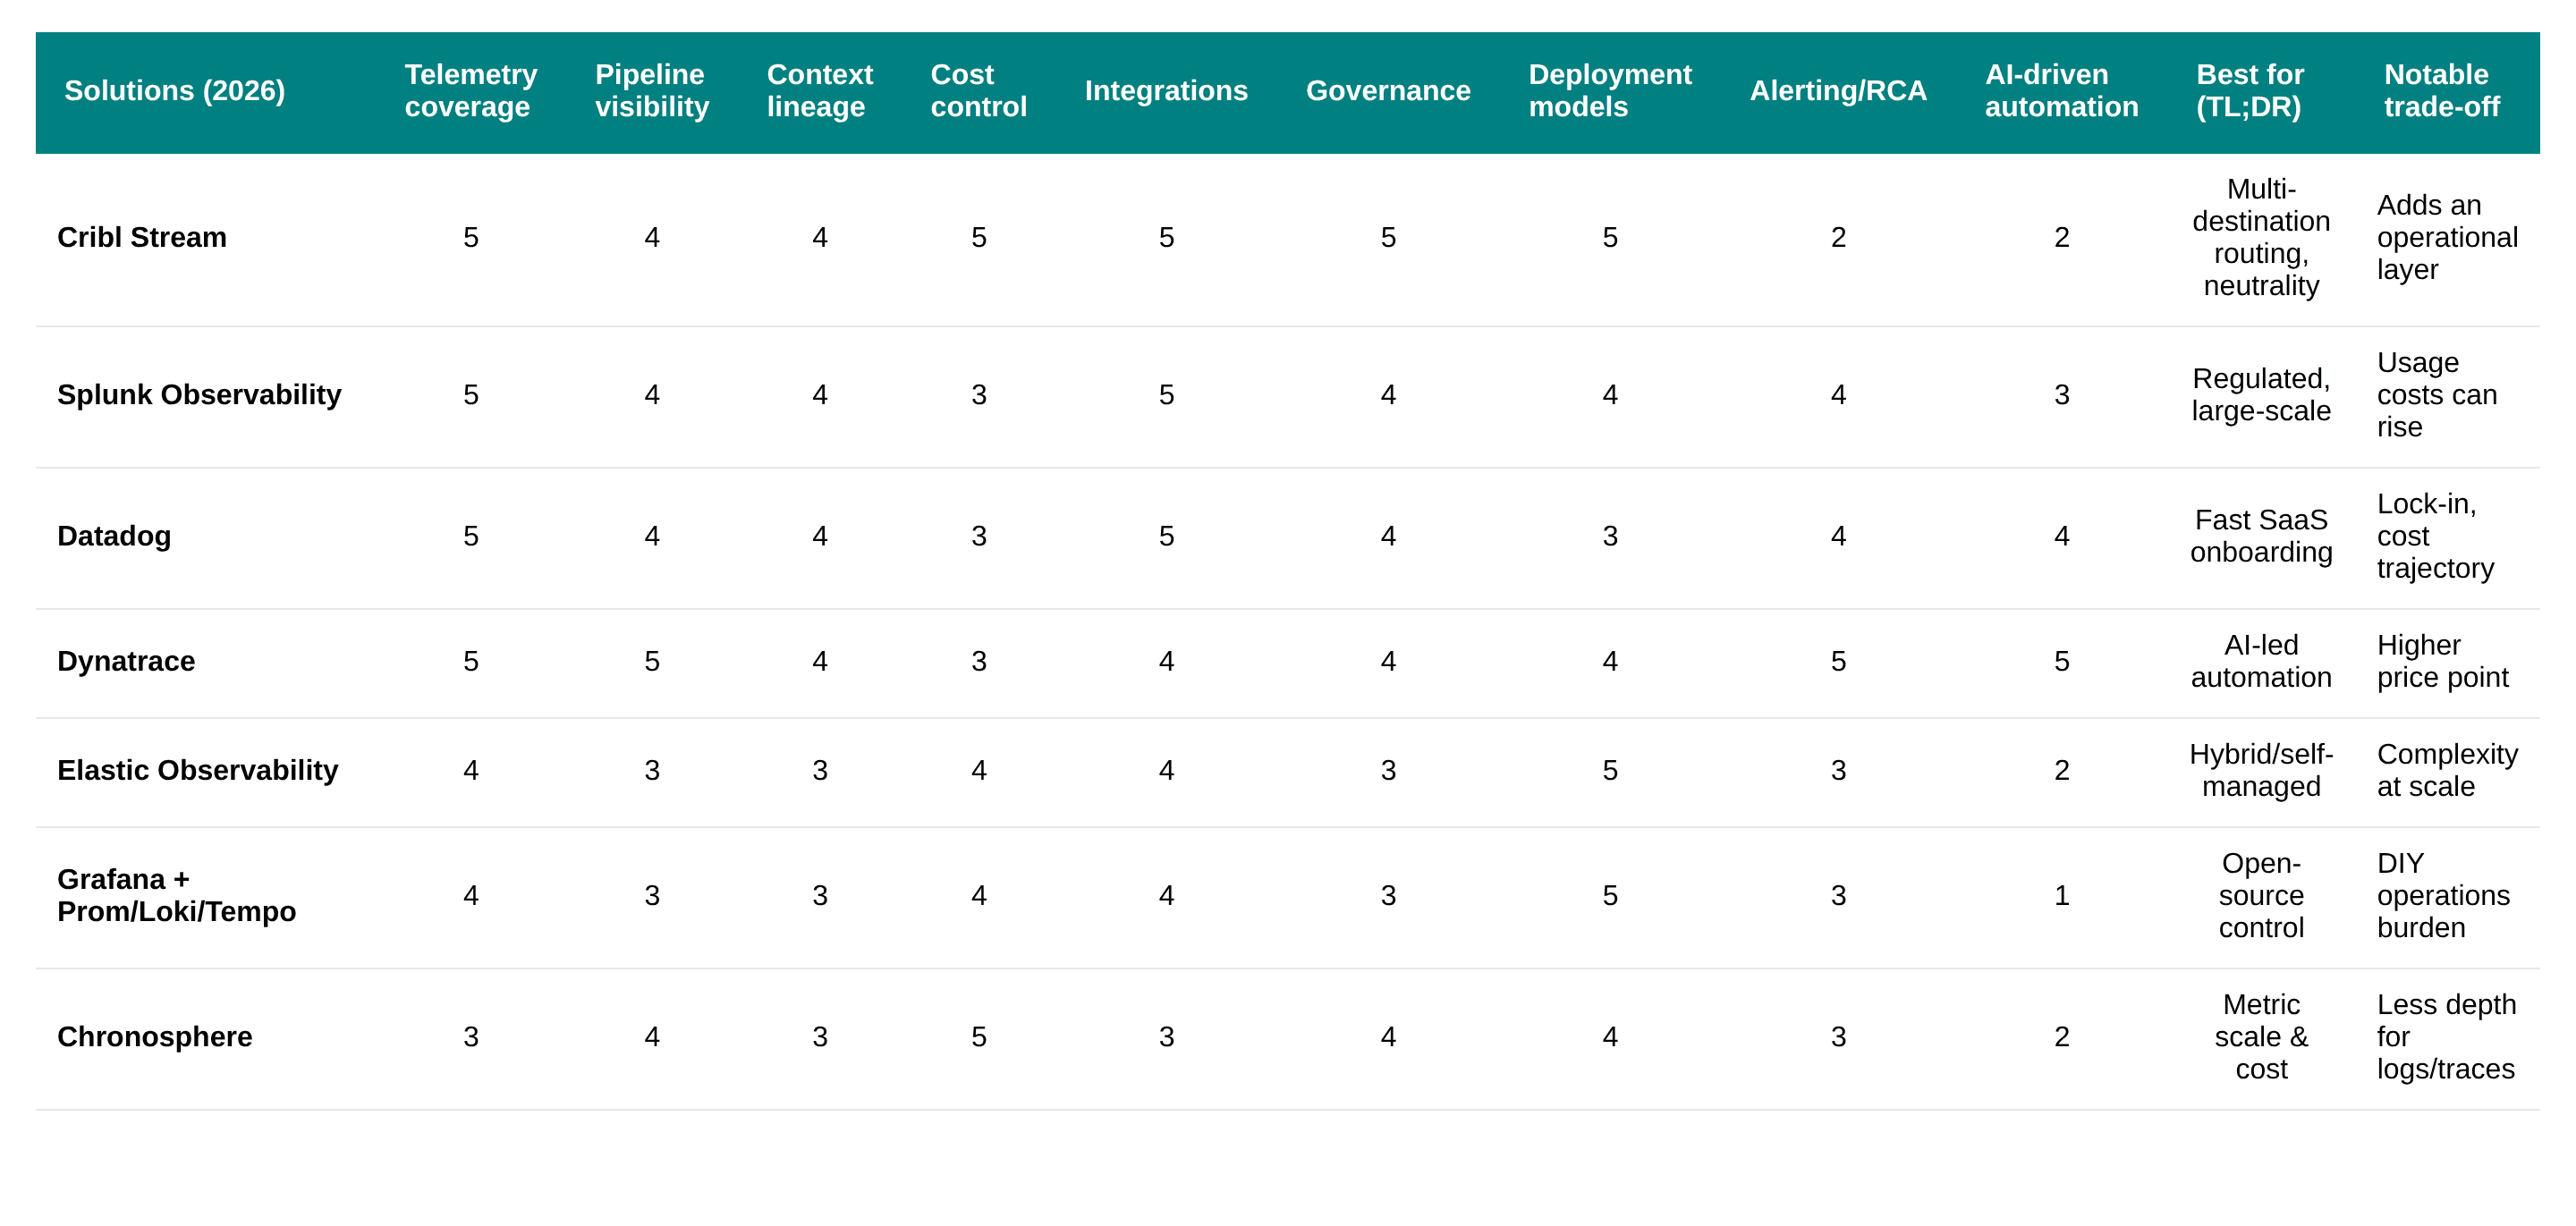
Use this rubric to compare solutions on enterprise‑grade pipeline needs. Scores are 1–5 (5 = strong). Criteria reflect telemetry coverage, pipeline visibility, context/lineage, cost control, integrations, governance, deployment models, and alerting/RCA. For 2026 decisions, factor in rising telemetry volume, multi‑cloud sprawl, and compliance. TL;DR: choose a dedicated pipeline (Cribl) for multi‑destination routing and cost control; choose integrated suites for end‑to‑end analytics and AI‑driven operations; choose open‑source stacks for flexibility and budget. Rankings reflect current reviews and buyer patterns from recent rundowns and practice guides cited above.
Best Observability Pipeline Solutions picks
Best for multi‑tool routing and vendor neutrality: Cribl Stream
Best for integrated analytics and compliance depth: Splunk Observability
Best for rapid SaaS onboarding and UX unity: Datadog
Best for AI‑driven automation at scale: Dynatrace
Best for hybrid/self‑managed flexibility: Elastic
Best for open‑source control and cost: Grafana Stack
Best for metric cost and scale governance: Chronosphere
1. Cribl Stream
Cribl Stream is a vendor‑agnostic telemetry or observability pipeline layer that can filter, enrich, route, and reduce telemetry before long‑term storage or analytics. It centralizes collection, shaping, and multi‑destination routing to keep egress predictable and preserve tool choice. Reviews consistently cite cost reduction and control over data flows as key reasons to deploy a dedicated pipeline layer, such as the Cribl observability platforms list.
Role: Central pipeline to collect, enrich, route, and reduce data before tools
Best for: Neutrality, regulated environments, complex multi‑cloud data flows, and routing high‑volume security and SIEM telemetry without lock‑in
Strengths: Advanced routing, shaping, multi‑destination, governance, 80+ integrations
Cost control: Reduces downstream storage and license costs via filtering/aggregation
Governance: Policy‑driven controls, masking, retention, and audit capabilities
Trade‑offs: Adds an operational layer to manage, secure, and scale
See: observability pipeline overview, governance brief, and strategic importance.
Key takeaway: Cribl Stream provides the most flexible, vendor‑neutral pipeline for enterprises that need fine‑grained cost control and multi‑destination routing.
2. Splunk Observability Cloud
Splunk Observability delivers a mature, enterprise‑grade suite spanning logs, metrics, and traces, with deep search and broad ecosystem support. It suits large, regulated organizations that want end‑to‑end analytics, long telemetry history, and compliance rigor. Buyers praise depth and ecosystem while noting usage‑based costs as data grows, and a comparison overview.
Best for: Large enterprises needing analytics depth and compliance features
Strengths: Powerful search, broad telemetry, mature ecosystem integrations
Governance: Solid role‑based access and audit aligned to enterprise needs
Deployment: Cloud‑forward with hybrid data collection and ingest options
Trade‑offs: Costs can rise with high ingestion or retention periods
Key takeaway: Splunk offers comprehensive analytics and compliance capabilities, ideal for regulated enterprises willing to manage higher usage costs.
3. Datadog Observability Platform
Datadog offers an all‑in‑one SaaS with rapid onboarding, unified UI, and broad integrations across logs, metrics, and traces. Teams choose Datadog for speed-to-value and a consistent experience across cloud services and runtimes. Common trade‑offs include cost at scale and tighter vendor dependence, highlighted in platform engineering tool rundowns and platform tools snapshots.
Best for: Agile teams, fast‑moving cloud programs, unified UX
Strengths: Breadth of integrations, strong dashboards, quick setup
Automation: Built‑in alerting, anomaly detection, and workflow options
Trade‑offs: Uncertain Cost structure, structure, and vendor lock‑in are frequently cited by buyers
Key takeaway: Datadog delivers fast, unified observability for agile organizations, though cost and lock‑in must be managed. For customers already standardized on Datadog, the observability capability is a natural progression as budgets allow.
4. Dynatrace Full‑Stack Observability
Dynatrace emphasizes AI‑powered operations, autonomous root cause analysis, and deep topology mapping across complex estates. It excels when low‑touch operations and automated incident workflows are strategic goals. Enterprises value AI‑driven RCA and automation, with trade‑offs around price and focus on large‑scale deployments noted in the community roundups' observability tools guide.
Best for: Automation‑led ops, large‑scale enterprise estates
Strengths: AI‑driven RCA, topology‑aware analysis, smart baselining
Deployment: Cloud‑first with strong agent‑based coverage across stacks
Trade‑offs: Higher price point and complexity for smaller teams
Key takeaway: Dynatrace is the go‑to platform for AI‑driven, large‑scale observability with strong automated RCA.
5. Elastic Observability Platform
Elastic Observability builds on the ELK lineage, combining logs, metrics, and APM with strong search and correlation. It offers hybrid and self‑managed flexibility, which is attractive to teams standardizing on Elasticsearch. Buyers cite deployment choice and powerful search as advantages, alongside complexity and licensing considerations at a larger scale.
Best for: Hybrid/self‑managed deployments and search‑centric workflows
Strengths: Flexible deployment, schema‑on‑write/search capabilities
Cost control: Tiered storage and lifecycle management help manage spend
Trade‑offs: Operational complexity and license management at scale
Key takeaway: Elastic provides a search‑centric, flexible observability stack for organizations comfortable managing their own infrastructure. With this flexibility is inherent complexity, which can require significant human capital investment to maintain.
6. Grafana Stack with Prometheus
The Grafana Stack—Grafana for visualization, Prometheus for metrics, Loki for logs, and Tempo for traces—anchors the open‑source path. It favors portability, cost control, and modular choices aligned to Kubernetes and cloud‑native teams. Teams accept DIY operations in exchange for control and alignment with open standards common in platform engineering programs.
Best for: Kubernetes, hybrid cloud, open‑source‑first strategies
Strengths: Open standards, portability, flexible component choices
Cost control: Leverage sampling, retention, and long‑term object storage
Trade‑offs: DIY scaling, upgrades, and operational toil
Key takeaway: The Grafana stack offers a fully open‑source, modular observability solution with maximum control and minimal licensing cost.
7. Cost-controlled Vendor provided pipelines
Leading providers of EDR capabilities have recently (Q4-2025) acquired pipeline tooling to assist in high cardinality metric ingestion specific to security telemetry data. These tools (Onum, Observe AI, Chronosphere) all come with a direct ingestion line to their respective tools (CrowdStrike, Palo Alto, SentinelOne). Reviews highlight their cost efficiencies as they are typically discounted in favor of the larger platform approach.
Best for: Platform play unified data storage.
Strengths: Cost governance, scalable metrics pipeline, policy controls
Deployment: Cloud‑first with enterprise controls for SLOs and budgets
Trade‑offs: Vendor lock-in, shallow support for non‑native tools, and limited data reduction - vendors are incentivized to get the most data into their own platforms.
How to Choose the Right Telemetry/Observability Pipeline Platform
Choosing the right telemetry/observability pipeline platform is crucial for aligning with your business goals, managing data gravity, and meeting compliance requirements. This decision should be anchored in a comprehensive evaluation of various platforms, assessing them against key criteria that reflect your organization’s specific needs.
Define Your Outcomes
Start by clearly defining the outcomes you aim to achieve with your observability pipeline. Consider factors such as cost targets, mean time to recovery (MTTR) goals, compliance scope, and your overall tool and data strategy, including how you build data pipelines for reliability across telemetry and analytics. Establishing these benchmarks will guide your evaluation process and help you identify the platform that best aligns with your objectives.
Inventory Your Telemetry
Next, conduct a thorough inventory of your telemetry. Identify the sources of data you currently collect, the formats in which they exist, their growth rates, and your retention requirements. Understanding your telemetry landscape is essential for determining which platform can effectively manage and process your data.
Map Your Integrations
Evaluate your current tools and map out the integrations you require. This includes identifying destinations for your telemetry data, ensuring compatibility with OpenTelemetry, and various Security Information and Event Management (SIEM) and Application Performance Management (APM) solutions. A platform that offers broad integration capabilities will be more beneficial in the long run.
Pilot and Measure
Once you have narrowed down your options, conduct pilot tests to measure the effectiveness of each platform. Focus on routing tests, sampling, data reduction, and establishing cost baselines. This hands-on approach will provide you with valuable insights into how well each platform meets your needs in real-world scenarios.
Decide on Deployment
Finally, consider the deployment model that best fits your organization. Evaluate the pros and cons of Software as a Service (SaaS), self-managed, and hybrid solutions. Additionally, assess how each option aligns with your governance requirements and compliance needs.
Key Criteria for Evaluation
When evaluating potential observability pipeline platforms, focus on the following key criteria:
Telemetry Type Coverage: Ensure the platform supports the types of telemetry you need, including logs, metrics, traces, and custom events.
End-to-End Pipeline Visibility: Look for platforms that provide comprehensive visibility across all components of the pipeline, including collectors, routes, queues, transforms, and back-pressure management.
Context/Lineage: Choose a platform that offers source-to-destination tracking for auditability, ensuring you can trace data throughout its lifecycle.
Cost Control: Evaluate features that allow for sampling, filtering, shaping, tiering, and predictable egress costs to maintain budget control.
Integrations: Assess the breadth of sources and destinations supported, along with the availability of APIs and ecosystem connectors.
Governance: Ensure the platform includes robust governance features such as policies, role-based access control (RBAC), data masking, retention capabilities, and compliance reporting.
Deployment Flexibility: Consider whether the platform offers SaaS, self-managed, hybrid, or air-gapped deployment options to suit your operational needs.
Alerting and Root Cause Analysis (RCA): Look for built-in detection, correlation, and root-cause capabilities to enhance your observability efforts.
By following these guidelines and focusing on the outlined criteria, you can confidently choose the telemetry/observability pipeline platform that best meets your organization’s needs and empowers your teams to harness the full potential of their telemetry data.
Why Cribl is the right Observability Pipeline Platform for your organization
Vendor Neutrality and Multi‑Destination Routing
Vendor neutrality lets organizations avoid lock‑in and route data to any analytics or storage solution as needs evolve. Multi‑destination routing sends enriched, reduced data to multiple tools at once (e.g., SIEM + APM + data lake) to balance cost and capability over time. Market guides consistently recommend neutrality to hedge cost and feature risks across clouds and tools , cloud guide.
Collect from agents, OTel, and native sources into the pipeline
Enrich with metadata, labels, and security context
Reduce via filtering, sampling, and PII masking
Route per policy to multiple destinations with retries
Observe pipeline health, costs, and SLAs continuously
Cost Control and Data Volume Management
Cost control means filtering, aggregating, and shaping telemetry before expensive analysis or hot storage. The pipeline enforces policies to sample high‑volume streams, route cold data to cheap storage, and send only necessary fields to premium tools. Enterprises report that predictable egress and pre‑ingest reduction materially lower downstream tool costs and help them manage multi‑cloud budgets best practices.
Use routing tiers: hot (alerts), warm (analytics), cold (archive)
Apply field‑level shaping and drop noisy sources by policy
Leverage sampling for high‑cardinality metrics and traces
Monitor cost per GB and per event to tune routes weekly
Integration with OpenTelemetry and Telemetry Types
OpenTelemetry standardizes the collection of logs, metrics, and traces across cloud‑native systems . OpenTelemetry overview. A leading pipeline should ingest OTel natively and support legacy agents, cloud services, network taps, and custom sources for complete coverage.
Confirm OTel support: collectors, exporters, and semantic conventions
Validate logs, metrics, traces, plus events and security telemetry
Check bidirectional paths: back‑pressure, retries, and buffering
Ensure schema mapping and transformation libraries
Scalability, Automation, and Operational Considerations
Scalability describes a platform’s ability to ingest, process, and route growing telemetry without performance degradation. Automation reduces manual toil via AI‑driven RCA, policy‑based routing, and auto‑tuning of pipelines. Suites emphasize AI‑driven correlation and RCA, while dedicated pipelines emphasize policy automation and cost SLAs; choose based on operational model and team capacity tools roundup.
Automation pros: Faster RCA, consistent actions, fewer manual errors
Automation cons: Opaque models, tuning overhead, potential false positives
Pipeline ops: Treat the pipeline as critical SRE‑managed infrastructure
Scaling tips: Partition state, shard collectors, and test back‑pressure
Frequently Asked Questions
What is an observability pipeline, and why is it important?
An observability pipeline collects, processes, and routes telemetry like logs, metrics, and traces to the right tools. It reduces volume, enriches context, and enforces governance to cut costs. Enterprises use it to keep egress predictable, avoid vendor lock‑in, and maintain full visibility.
How does an observability pipeline reduce telemetry costs?
Pipelines filter noisy events, sample traces and metrics, and drop unused fields before analysis. They route hot data to premium tools and cold data to cheaper storage tiers. This pre‑ingest reduction lowers storage, license, and egress costs without sacrificing essential insights.
Which telemetry types should an observability pipeline support?
A strong pipeline supports logs, metrics, and traces across cloud, on‑prem, and edge sources. It should ingest OpenTelemetry and legacy agents, normalize formats, and preserve key fields. Broader support increases visibility and simplifies decommissioning redundant collectors.
How do observability pipelines integrate with existing monitoring tools?
Pipelines connect to common SIEM, APM, and data‑lake destinations with native outputs and APIs. They transform and enrich data to match each tool’s schema. This enables side‑by‑side tool usage and phased migrations without disrupting current workflows.
What are the best practices for implementing an observability pipeline at scale?
Start with governance: define policies for retention, masking, and routing. Pilot with a few high‑value sources and measure cost‑per‑GB and MTTR impact. Automate reductions and alerts, then expand to multi‑cloud and compliance‑critical domains with clear SLAs.
