
Observability Pipeline Terms and Definitions
An event is a tag bag of key-value pairs describing something that occurred at a point in time; events are the smallest unit of observability. Log refers to events serialized to disk, often in a number of different formats; log analysis platforms store logs as time series events. Metrics are lossily compressed events that arrive with a metric name, a metric value, and a low-cardinality set of dimensions, then get aggregated and stored for low-cost, fast retrieval. Traces are a series of events with a parent/child relationship, telling the story of an entire user interaction, usually displayed in a Gantt-chart-like view. Observability is the ability to interrogate your environment without knowing in advance the questions you will need to ask. Monitoring and alerting is the systematic observation of data for known conditions that require human attention.
One more thing worth noting: logs can be converted to metrics, and metrics can be converted to logs, via events. For a deeper dive, see our post on logs, events, metrics, and traces.
Problem 1: Why do teams suffer agent fatigue?
Enterprises and startups alike need a lot of tooling to run applications with high reliability and security. That usually means agents for up/down monitoring, performance metrics, log shipping, file integrity monitoring, APM instrumentation, RASP firewalls, and SIEM or UBA collection. Despite all those destination categories, the sources are far fewer: system performance counters, system and application logs, application instrumentation, and scheduled collection tasks. Yet every vendor ships its own agent.
Vendors are not incentivized to consolidate agents, since the day-one setup experience is critical to their sales success. Ops and SRE teams quickly hit the day-two reality of overlapping agents competing for resources, each with its own configuration and management paradigm. Security teams have an even sharper concern: every agent widens the attack surface. Agents pull their vendor's dependencies into production, and widespread vulnerabilities like Log4Shell showed how a single flawed dependency can affect every agent and application that carries it.
Organizations want to avoid agent fatigue by consolidating agents and sidecars, and by reusing existing agents, even proprietary ones, to feed multiple tools and data lakes.
Problem 2: What causes capacity anxiety?
Administrators of TSDBs, log analytics platforms, and SIEMs live with a constant fear of accidental denial of service. A new deployment bumps the log level and data volumes spike, backing up ingestion and causing backpressure through the whole system. Reports fall behind, summary searches miss data, and users can't get up-to-date answers. Another deployment adds a high-cardinality dimension and suddenly the TSDB is overloaded. Compliance requires flow log data, and it turns out to be triple the planned size, blowing past license and server capacity.
The root cause is that current systems haven't prioritized good controls. Each tool prefers you send it everything, so vendors build for getting data in and stop short of fine-grained control. Few provide easy mechanisms for sampling, suppression (data deduplication), or aggregation that let administrators throttle a noisy source instead of cutting it off entirely.
Organizations want rich controls over their data and new processing capabilities that maximize the value of the data while minimizing the volume. That is how you trade capacity anxiety for capacity confidence.
Problem 3: Why is foresight required?
Observability lets you ask questions you didn't plan in advance, but you can't ask questions of data you never collected. My co-founder Ledion says the value of a debug log is exactly zero, until it's not. That's why most organizations skip fine-grained telemetry. Ask practitioners how much data in their environment goes uncollected and the answers range from "a lot" to "petabytes." Nearly everyone we talk to estimates they collect only a fraction of what their environment produces.
Today's systems force you to plan everything you'll ever collect ahead of time. Changing what's onboarded means deploying new agent configurations, tweaking a Syslog server, or asking a developer for more instrumentation. The lag between knowing you need data and getting it is often measured in weeks. Even when the data exists, pushing configuration updates can take minutes or hours, far too slow to catch an attacker in the act. And just because data ships out of a system doesn't mean it must be stored somewhere expensive.
Organizations want to escape the foresight trap by giving administrators, and the system itself, the ability to respond to conditions like alerts and selectively turn up data granularity exactly when it's needed.
Solution: An Observability Pipeline
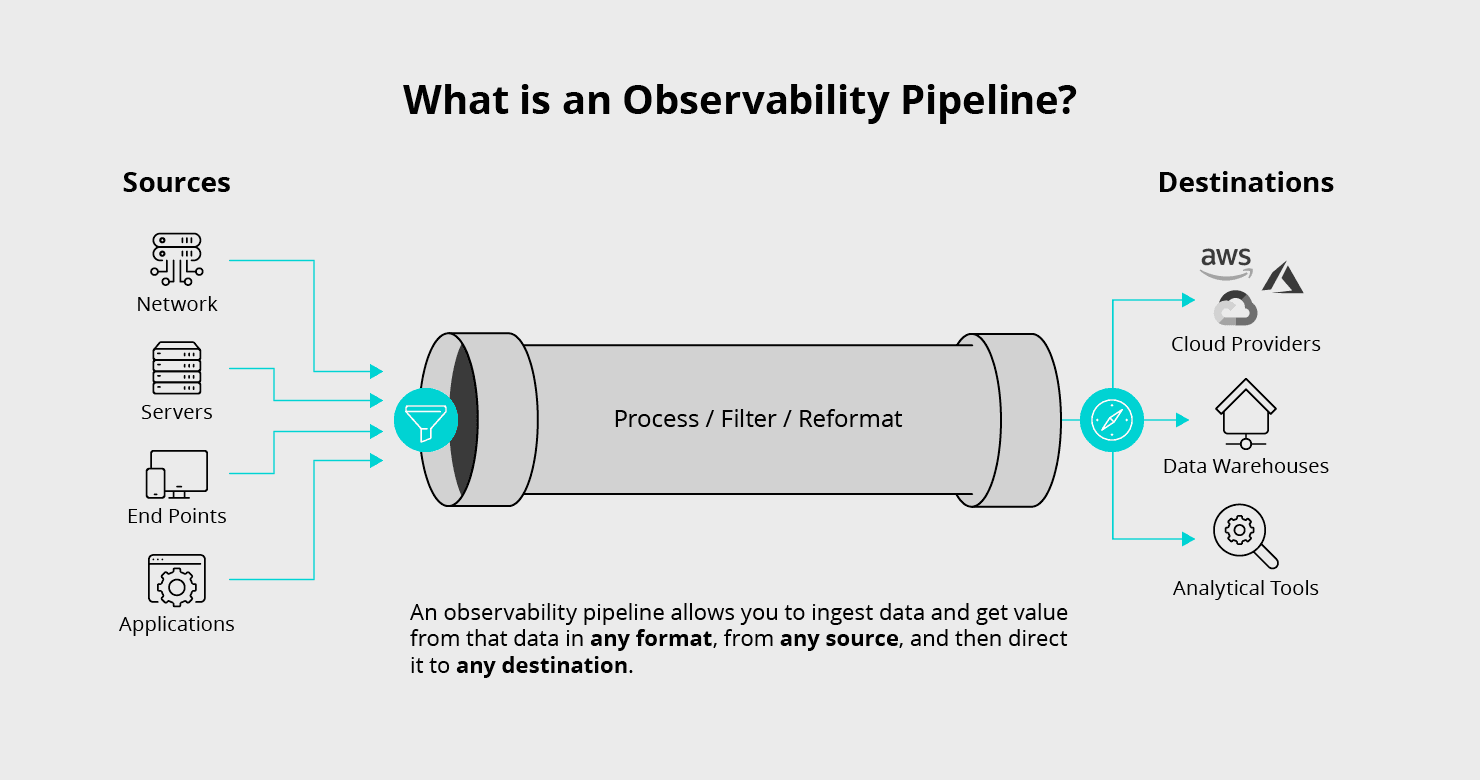
Solving these three problems requires a new strategy for engineering data collection and instrumentation. Your observability pipeline should minimize the number of agents and collectors, share instrumentation across applications, and feed many systems. It should include fine-grained controls to manage data volumes and cardinality, plus a responsive system that can turn up granularity on demand. Tyler Treat of Real Kinetic, who coined the term, puts it this way:
“With an observability pipeline, we decouple the data sources from the destinations and provide a buffer. This makes the observability data easily consumable. We no longer have to figure out what data to send from containers, VMs, and infrastructure, where to send it, and how to send it. Rather, all the data is sent to the pipeline, which handles filtering it and getting it to the right places. This also gives us greater flexibility in terms of adding or removing data sinks, and it provides a buffer between data producers and consumers.”
I agree! Here I’d like to propose my view of an observability pipeline, which in addition to the pure plumbing aspects, also has a number of attributes identified by working with dozens of customers and prospects over the last year which I believe are required to effectively solve the problem in a vendor agnostic way.
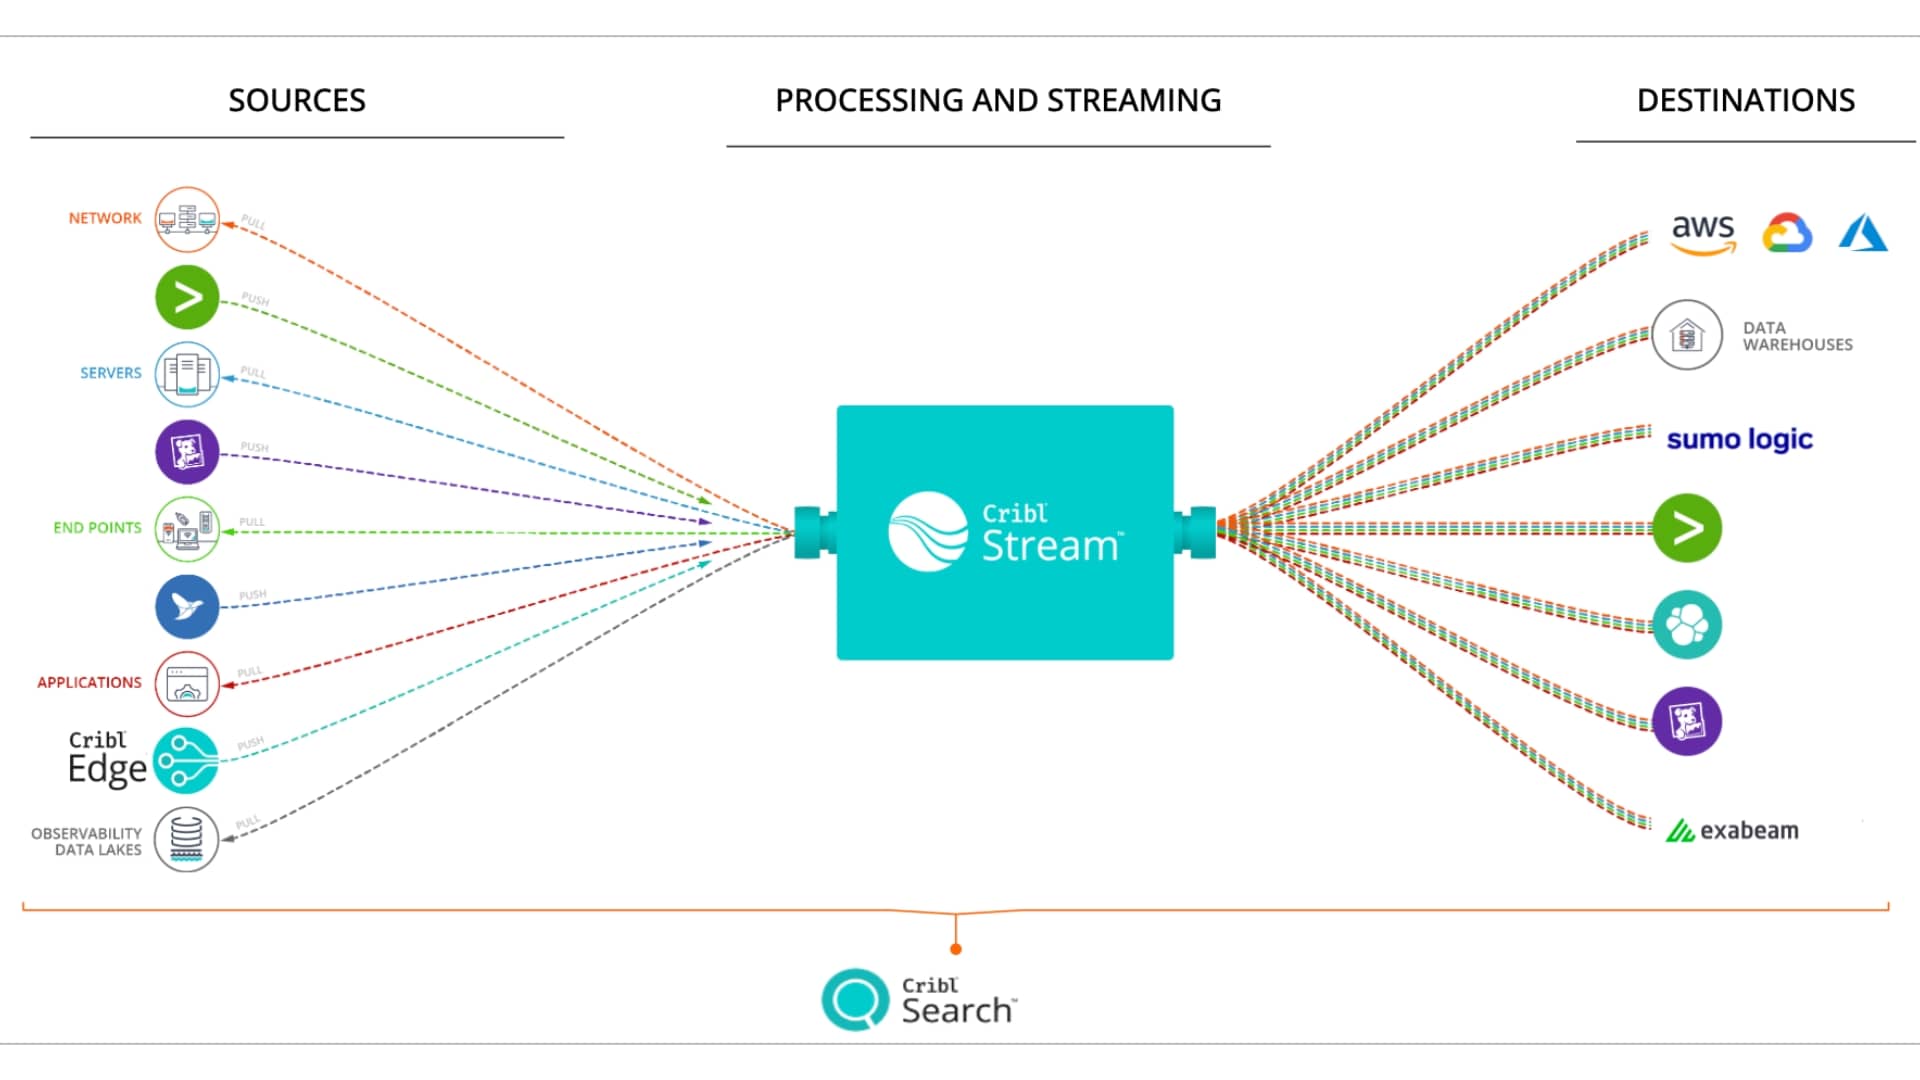
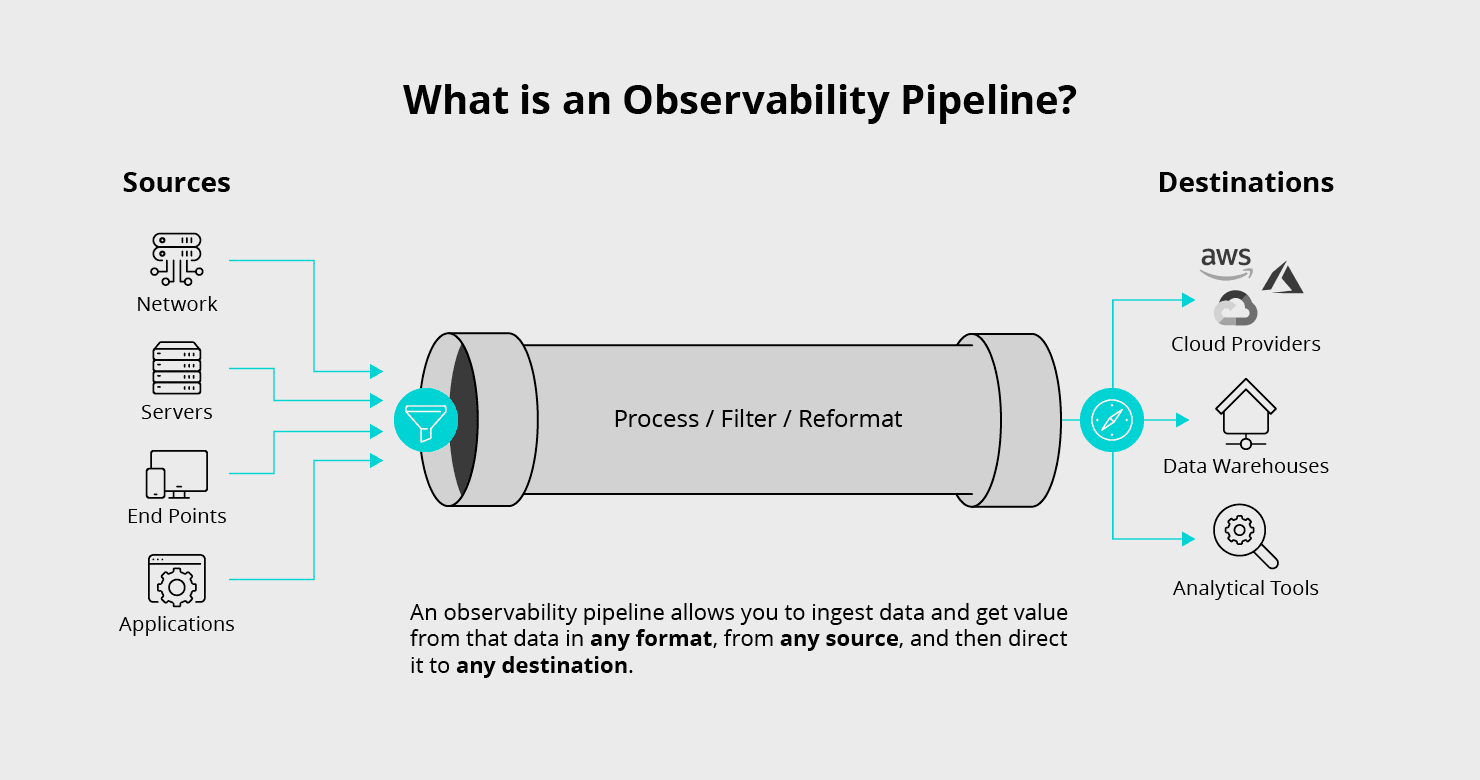
As mentioned above, an observability pipeline is a stream processing engine that can unify data processing across all types of observability data, collect the required data, enrich it, eliminate noise and waste, and deliver that data to any tool in the organization designed to work with observability data. For a side-by-side comparison of leading enterprise observability pipeline platforms, see our best observability pipeline solutions for enterprise guide. Based on work with hundreds of enterprises, here are the attributes an observability pipeline needs to solve the problem in a vendor-agnostic way:
Schema-agnostic processing: enrich, aggregate, sample, suppress, or drop fields from any shape, including nested structures and raw logs
Universal adapter: normalize, denormalize, and adapt schema for routing data to multiple destinations
Protocol support: work with existing data collectors, shippers, agents, etc, and simple protocols for new collectors
Easily verifiable: easy to test and validate new configurations, and easy to identify and reproduce how data was processed
Responsive configurability: fast reconfiguration to selectively allow more verbosity with pushdown to collectors
Reliable delivery: at least once delivery semantics to ensure data integrity with optional disk spooling
Put these capabilities into your environment and you drop the pipeline in place, process data universally no matter where it originated, and handle gritty serialization formats like CEF and Logfmt. You can pare down datasets with aggregation, deduplication, dynamic sampling, and field dropping across nested JSON, CSV, or key-value logs. Verify configurations before production, trace how data was processed when something looks off, dial up granularity on demand, and rely on data landing between every source and destination.
If you're building your own, a reference architecture includes schema normalization because data arrives in formats native to its ecosystem (Splunk, Elastic, Influx, OpenTelemetry all have opinionated schemas) and you need a common schema to run shared logic across agents and data types; routing so data intended for different destinations receives different processing and events are sent down different paths based on their contents; streaming processing where the actual work to aggregate, suppress, mask, drop, and reshape happens, followed by reshaping to each destination's expected output schema; and centralized state and management because alerting, lookups, and sessionization require coordination, and at petabyte-a-day scale centralized monitoring and management are critical.
What can you do with all this? Take DogStatsd metrics, enrich them, and split high-cardinality data to one analytics tool and low-cardinality data to another. Take Windows Event Logs, send full fidelity to S3, and send a trimmed subset to Elastic and Exabeam. Use a Splunk forwarder, sample the stream, send raw events to Splunk and structured events to Snowflake. Every use case mixes solving agent fatigue, capacity anxiety, and required foresight.
Observability Pipeline in the Cloud
With the proliferation of security SaaS platforms such as Cloudflare, Proofpoint, and PingOne, enterprises must integrate third-party data shipped over the internet into their analytics and SIEM platforms. That raises a host of security, infrastructure, and data quality questions. A purpose-built cloud observability pipeline lets you lower risk and finish projects faster.
Use your pipeline to handle connections from all your SaaS data sources, transform the data to your preferred format, and ship it to your logging platform. Instead of managing an allow list for potentially thousands of IP addresses or exposing your infrastructure to the internet, manage access from a single pipeline. You also skip deploying substantial logging infrastructure, since you only need enough to consume the pipeline's output. Fast deployment at scale, managed security risk, lower cost.
How Cribl can help with observability pipelines
Cribl is the AI Platform for Telemetry. Cribl Stream gives IT and Security teams a vendor-agnostic engine to collect, transform, route, and enrich telemetry from any source to any destination, with no lock-in, no data loss, and no compromises. You keep your existing agents, feed every tool in your stack from a single pipeline, and control exactly what reaches each destination in the right shape.
Cribl customers report routine reductions in data volumes flowing to expensive analytics platforms by 30% to 50%, freeing license headroom and infrastructure budget while improving visibility. Reusing existing agents to feed data lakes and other systems cuts overhead on endpoints, and decoupling sources from destinations means you can trial new tools, accelerate SIEM migrations, and adapt to changing requirements without redeploying a single agent.
Beyond the pipeline itself, Cribl's suite extends the strategy end to end: Edge for distributed collection at the source, Search for federated queries across data wherever it lives, and Lake for cost-effective, full-fidelity retention in open formats. Together they act as a central hub that reduces data volume and complexity, helps ensure compliance, and keeps your telemetry portable, interoperable, and searchable at scale.
Cribl offers a free Cribl.Cloud account that can process up to 1 TB per day, no license required. Your data should serve your team.
Observability Pipeline FAQs
What is an observability pipeline?
An observability pipeline is a stream processing engine that unifies data processing across metrics, logs, and traces, collects the data you need, enriches it, removes noise and waste, and delivers it to tools in your organization. It decouples data sources from destinations, giving you control over routing.
How does an observability pipeline reduce costs?
By filtering noise, deduplicating events, sampling high-volume streams, and aggregating data before it reaches expensive analytics tools, an observability pipeline reduces the volume your licensed platforms ingest. Cribl customers reduce data volumes by 30% to 50%, cutting license and infrastructure spend without losing visibility.
What is agent fatigue, and how does a pipeline fix it?
Agent fatigue occurs when every monitoring, logging, and security vendor requires its own agent, creating overlapping resource consumption, management overhead, and a wider attack surface. An observability pipeline lets you reuse existing agents, including proprietary ones, to feed multiple tools and data lakes, so you consolidate instead of stacking more software on every endpoint.
Can an observability pipeline work with my existing tools?
Yes. A pipeline supports existing collectors, shippers, and agents such as Fluentd, Collectd, and OpenTelemetry, and it adapts data to each destination's expected schema. That means you can route data to Splunk, Elastic, Snowflake, S3, SIEMs, TSDBs, and data lakes simultaneously, without redeploying instrumentation.
Do I need an observability pipeline in the cloud?
If you ingest data from SaaS platforms such as Cloudflare, Proofpoint, or PingOne, a cloud observability pipeline handles those internet-delivered connections for you. Instead of managing allow lists for thousands of IP addresses or exposing your infrastructure, you manage a single access point, transform data to your preferred format, and ship it to your logging platform.
You can build one from open-source components and custom software, and many organizations have. But you'll need to engineer schema normalization, routing, stream processing, at-least-once delivery, centralized state, and management yourself. A platform like Cribl Stream provides those capabilities out of the box, is vendor-agnostic, and scales.