Today I’m pleased to announce the general availability of LogStream 2.0, featuring a new centralized management console designed to manage petabytes of daily ingest from a single experience. Distributed Management was designed hand in hand with our customers, and brings our single node management experience to scale. Distributed Management is simply a delight to use. It includes integrated monitoring with detailed dashboards allowing you to dive through all the traffic flowing through LogStream. Centralized configuration management integrates the 1.0 management experience with source code control for auditability and integrated deployment for easy rollout.
Combining monitoring with management, I can make easy changes which make the graphs move, dropping or rerouting traffic in real time at massive scale. LogStream 2.0 brings both scale up and scale out to LogStream, with a single node of LogStream now able to consume all the cores of a given machine. In order to put our money where our mouth is, we’ve run up a huge AWS bill to test this across thousands of cores and into the petabytes of daily ingest.

New distributed management helps you follow the leader
In addition to the features we’re launching in 2.0, our new architecture is laying the foundation for massive new things to come. In this post, I’ll outline the design principles we operated under for our 2.0 release, go over the new architecture with some recommendations on scale, and then show off the new features. Lastly, I’ll end the post with some thoughts on the near future with what you can expect to see coming into the 2.0 line of Cribl LogStream.
Design Principles
We knew we needed to scale and we needed a central management console for LogStream 2.0, but there were also more important considerations. Here’s a few:
No regressions: 1.0 management experience is best in class, lose nothing from it
Self-contained: work on-premises or in the cloud, on bare metal, VM, or container
Flexible: support complex customer deployments with many different configurations
Auditable: must be able to easily track and understand change
Drop-in: must be able to drop into the existing workflow of config management and deployment pipelines
Massive scale: single console must manage the largest deployments
We feel we’ve stayed true to all of these principles and more. LogStream 2.0 brings the full 1.0 management experience, can be deployed anywhere, and manage complex configurations with many different distinct worker configurations as demanded by our customers. With our git integration, it’s easy to see who has done what and when in LogStream, and we can integrate into your existing configuration management or deployment pipelines. Lastly, of course, it scales to the needs of our largest customers and prospects.
Architecture
LogStream has always been a shared-nothing distributed system. Add more cores and we’ll scale up. LogStream 2.0 brings management and automation to that concept, where now you don’t have to manage how to scale. In LogStream 1.0, adding more cores meant adding more instances, or managing Docker containers yourself. In LogStream 1.0 scaling out meant building your own configuration management to get config state to each of the workers. This is all solved with LogStream 2.0, and scale up and scale out are managed for you by the system from the management console.
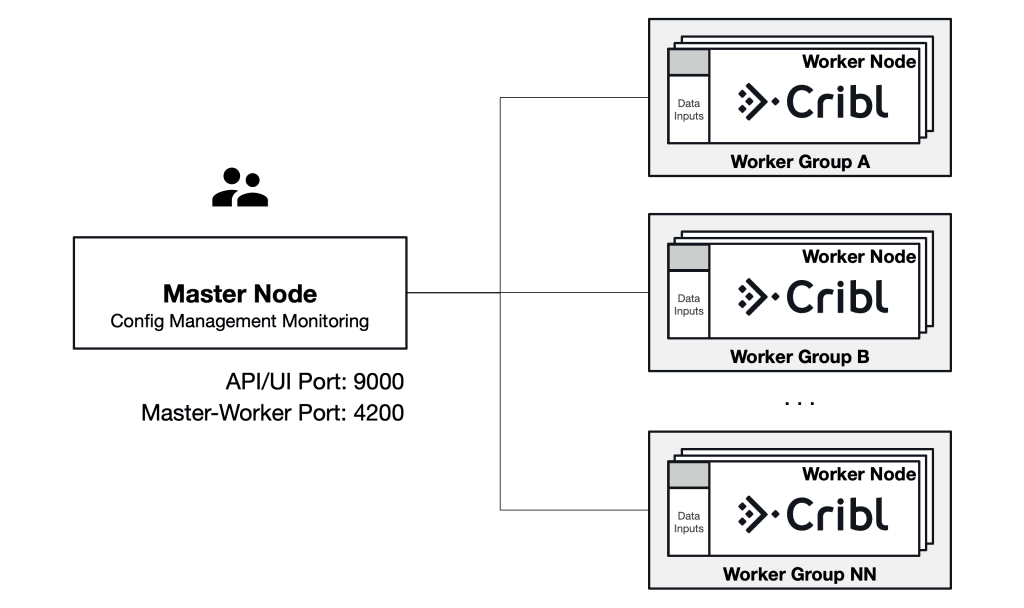
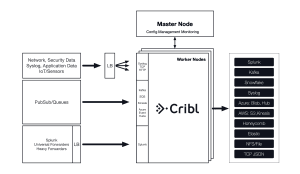
In LogStream 2.0, there is a master node which manages the configurations of the workers and collects performance metrics from the workers. The data plane will continue operating even in the event of a failure of the master, so for that reason we have deferred redundancy at the master tier to a future release. Each worker node has an api server process which manages communication with the master node and configurations of the worker processes. The worker master process by default will spin up a worker process per core of the machine to consume the machine fully.
Conceptually, LogStream remains the same as it was in 1.0. We appear to be the destination to any producers you have, so we can drop in to any existing pipeline as a bump in the wire. Depending on the protocol, you may need to maintain service discovery or a load balancer, which is outside the scope of LogStream’s management today. However, we will be releasing reference architectures for AWS Elastic Container Service and Kubernetes in the coming weeks which make it easy to manage load balancing and service discovery.
Lastly, our architecture would be nothing if it couldn’t scale to meet the needs of our largest customers and prospects. We’ve been testing this at petabyte a day scale. We’re confident LogStream 2.0 will scale.
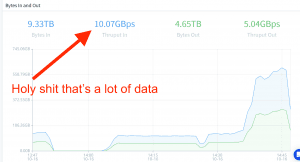
Our recommendations remain the same as before, approximately 300-500 GB/day per core of LogStream.
Product Walkthrough
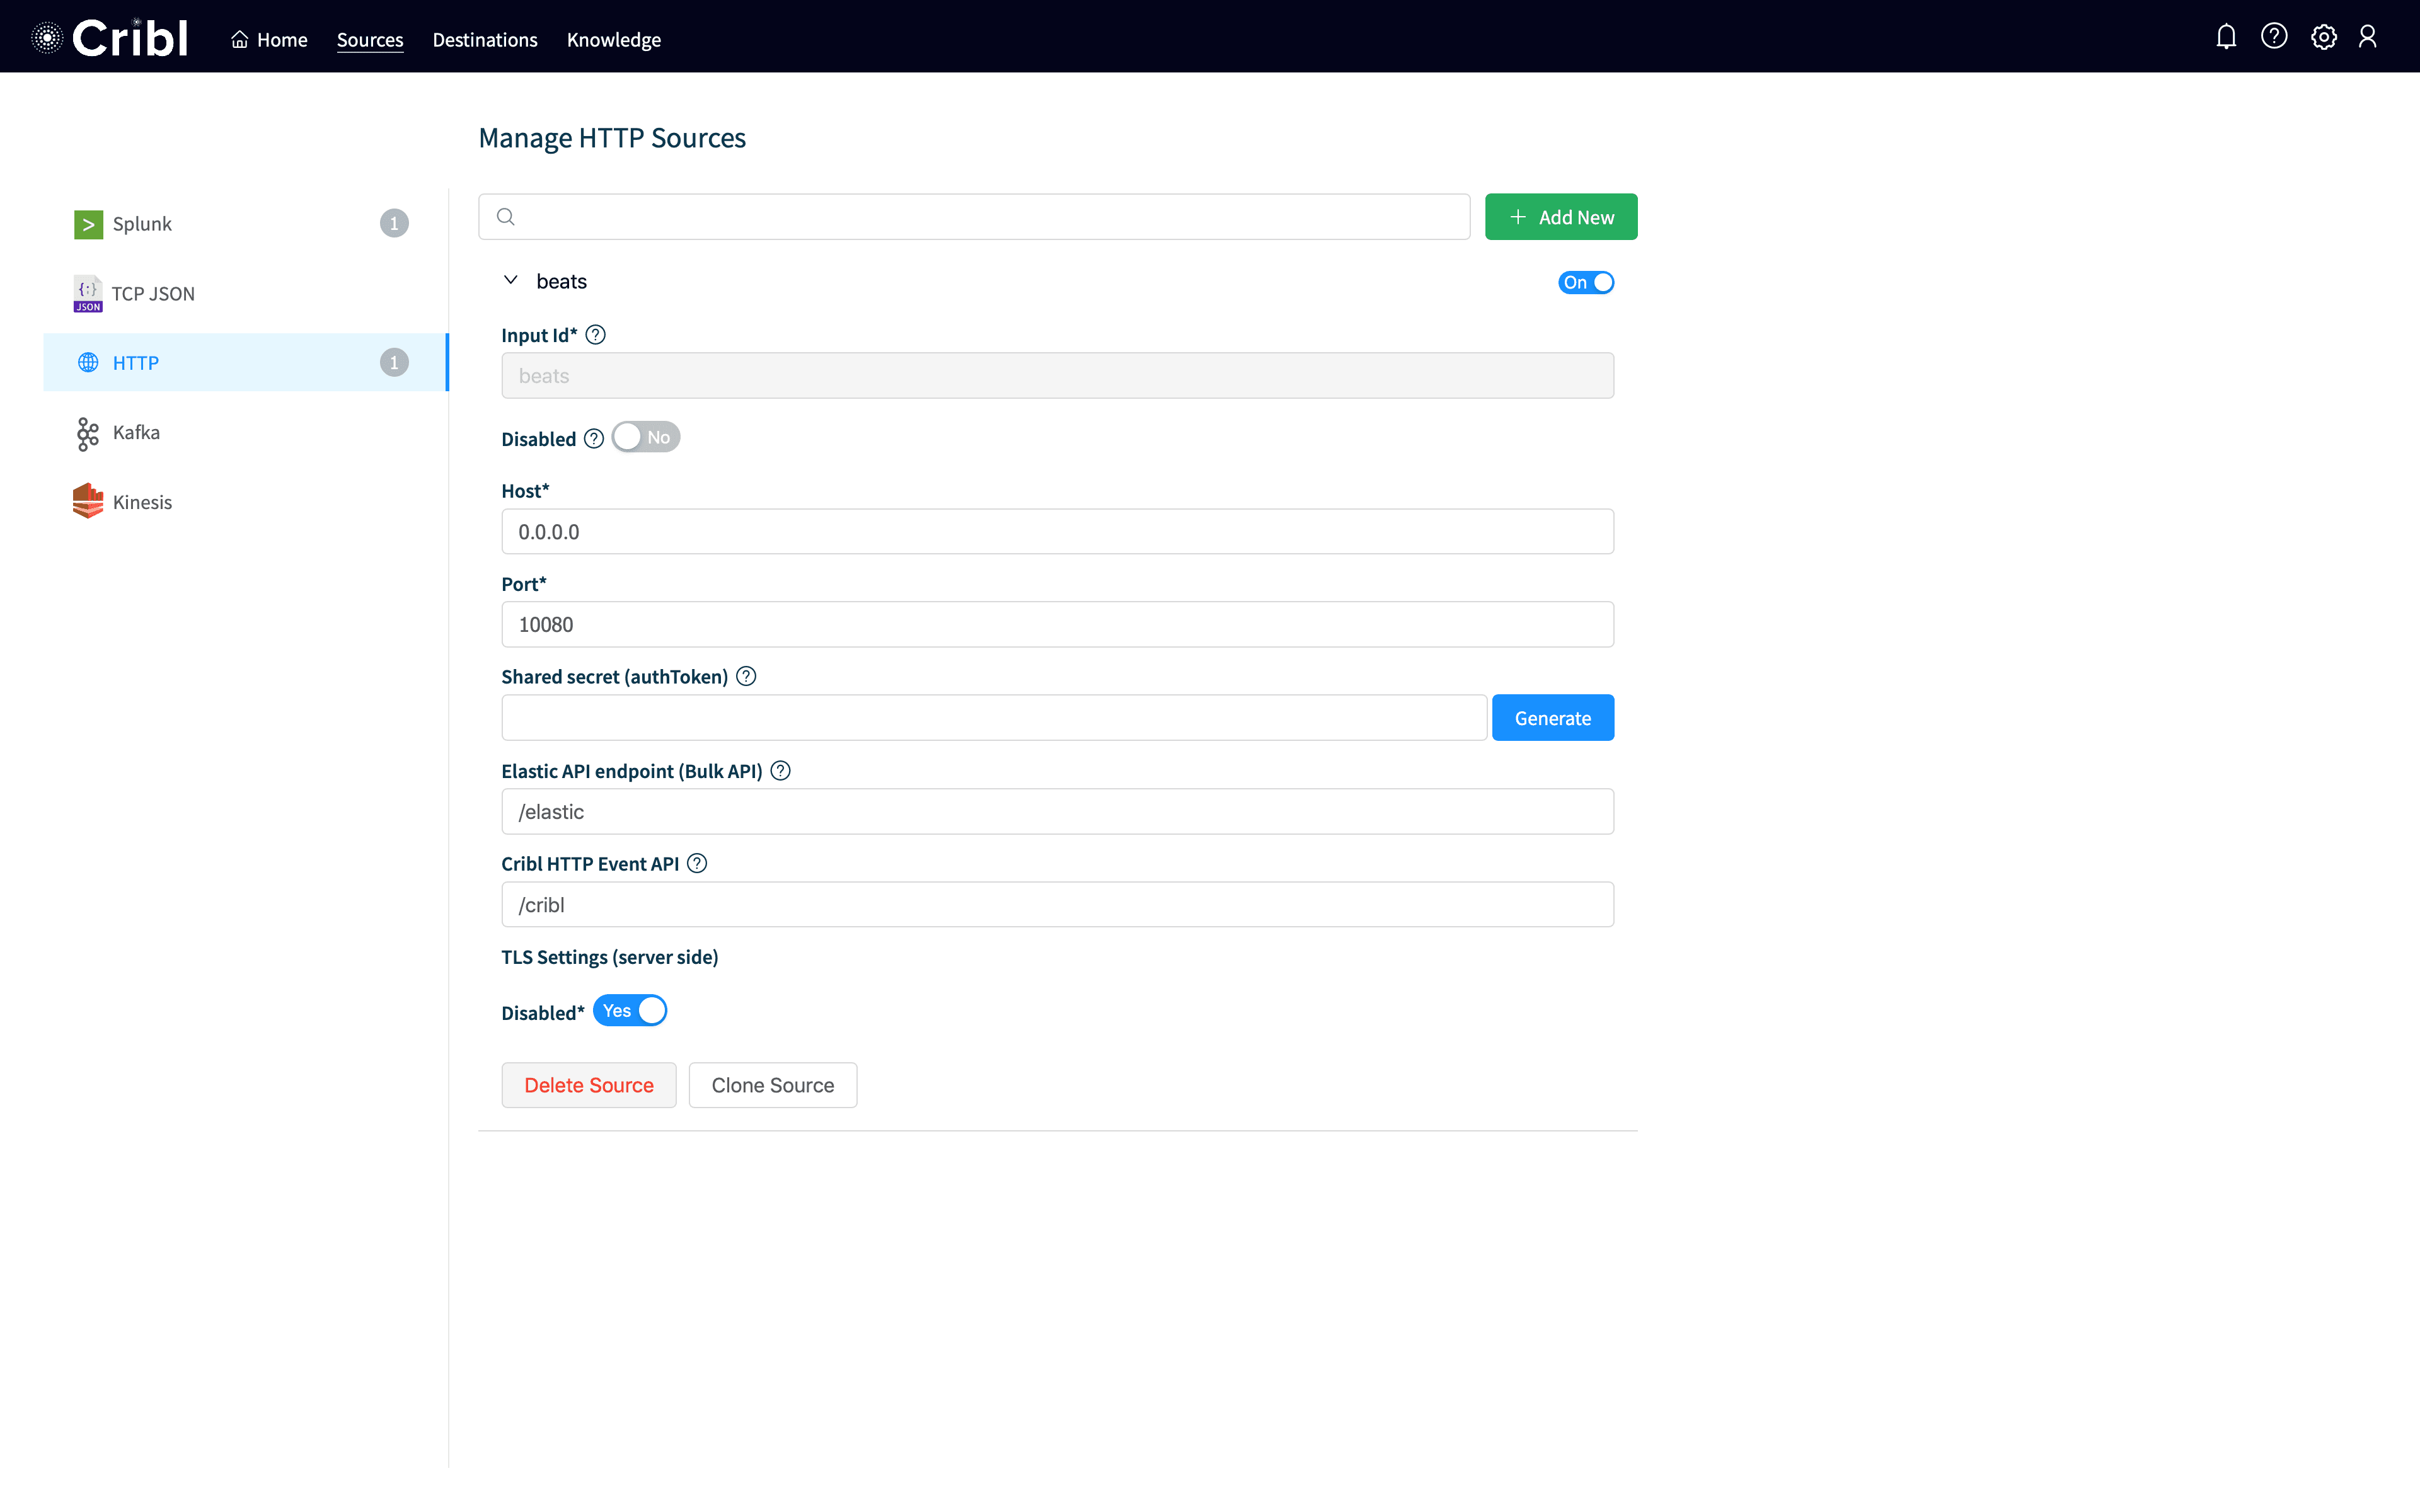
There are so many new features, it’s hard to show them all, but in this 90 second animated GIF, hopefully we can cover quite a few. In this scenario, I’m detecting a spike in new events. I navigate to the monitoring console and see a spike in access_combined events, and create a new route to send those events to devnull. I commit my changes to git, showing the diff of what I’ve changed, and I deploy them to my worker. Lastly, I check the monitoring dashboards to verify we are indeed dropping events.
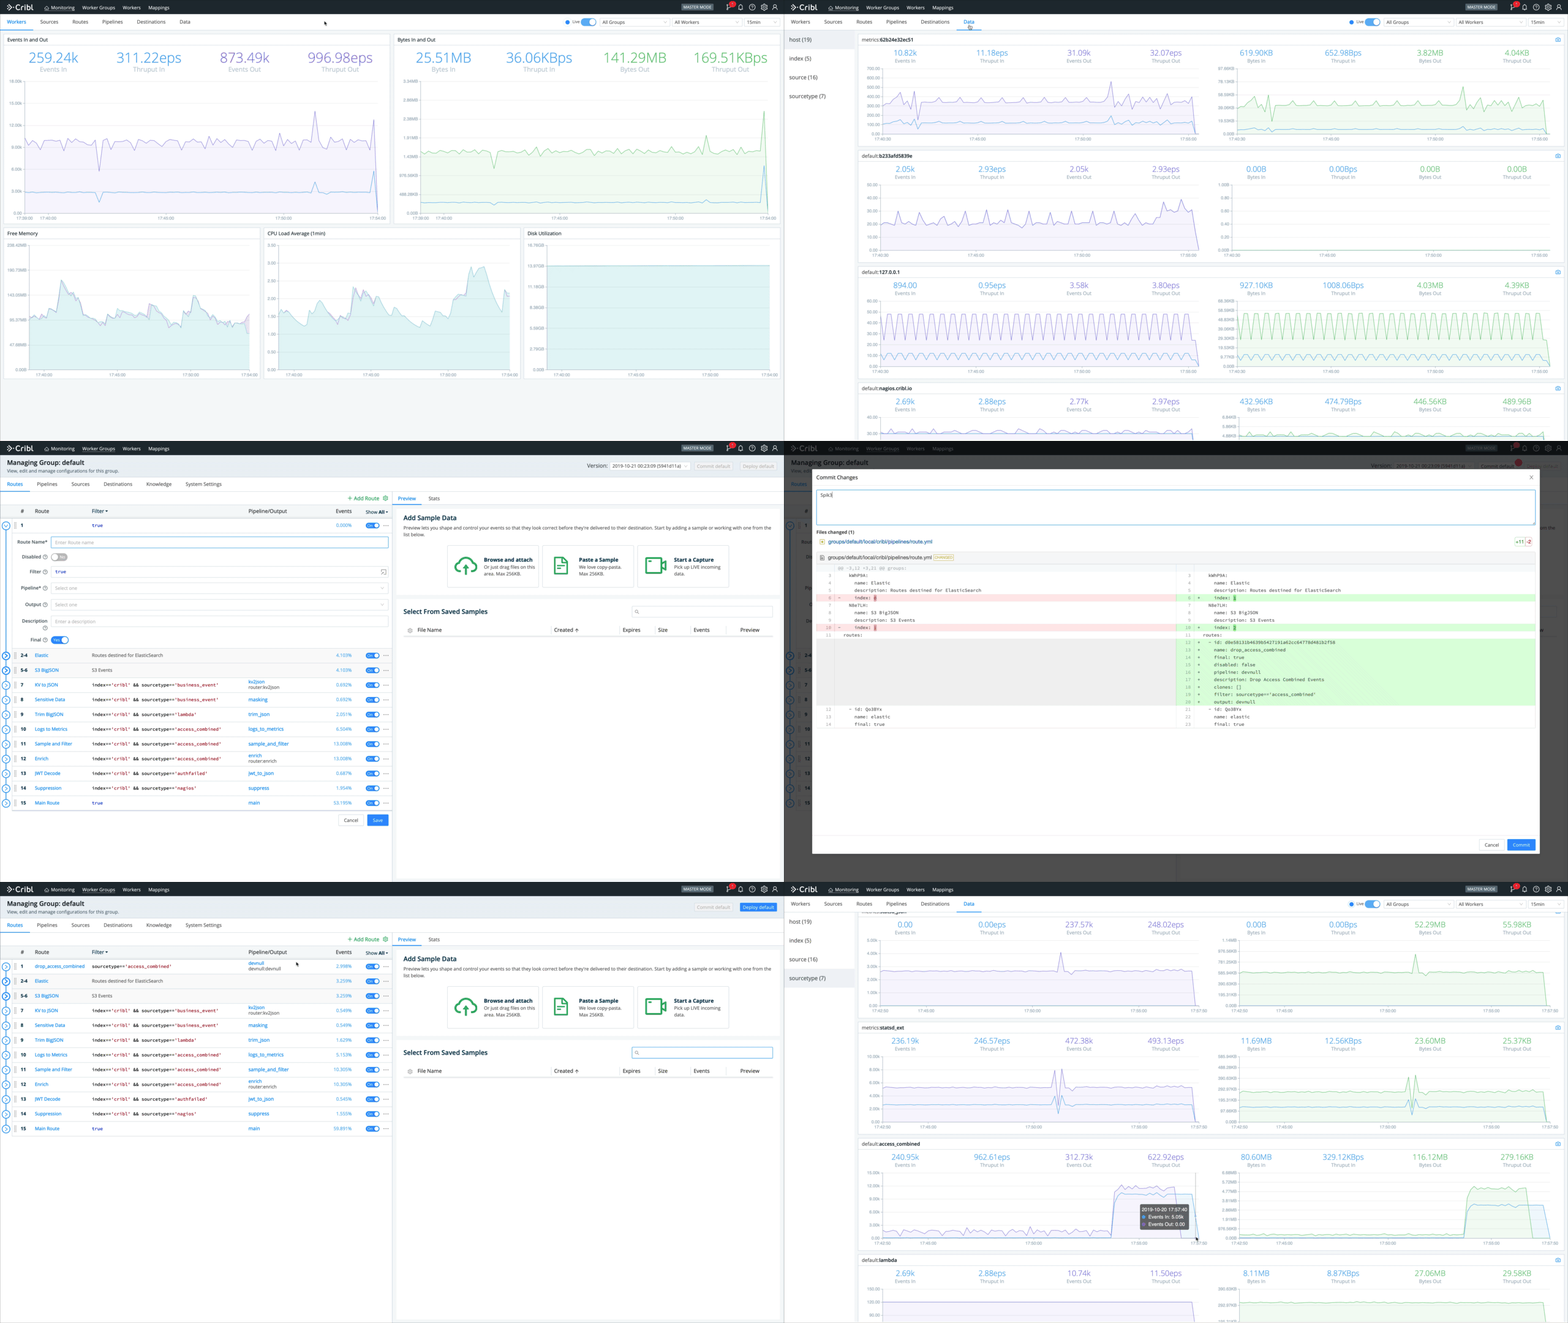
This shows off a number of key new features of LogStream. We have high fidelity information in our monitoring console so we can identify changes in behavior down to a sourcetype. We can create a push change easily, just like 1.0, but now to any number of different workers with included auditability via git. Deployment status updates in real time so we can make sure our workers are running the right configuration, and the responsiveness of our monitoring shows that changes we’re making are having an impact.
In addition to distributed management, 2.0 brings us support for authenticating against LDAP, Splunk Indexer discovery, S3 pull via SQS, and more! Many of these features are huge in their own right, but distributed management is so huge they end up below the fold. Check out the release notes for a full overview.
Looking Forward
Perhaps the most exciting aspect of 2.0 is the groundwork it lays for the future. The foundation we’ve laid with 2.0 sets us up for a very exciting year. Here’s a few things we expect to be coming over the next 12 months, in no particular order:
Replay: Data dumped in S3 or other destinations will be able to be replayed to front of the pipeline
Alerting: users will be able to articulate conditions and reactions and fire off events to systems like PagerDuty or VictorOps
Responsiveness: paired with alerting, users will be able to push to gatherers to gather more information based on observed conditions
Distributed Pull: similar to the S3 via SQS we released in 2.0, we will support scalable pull from APIs and other sources
If any of this seems exciting to you, please let us know what you’d like to see first!
Wrapping Up
The team here at Cribl is firing on all cylinders, delivering never before seen innovation to the observability pipeline. We’re very excited for our 2.0 release and the capabilities it’s bringing our customers now and into the near future. Please download it today! If you have any questions, hit us through the intercom widget here on the site or join our community Slack!
