
How does Cribl LogStream process data at scale? What does a distributed deployment look like?
In this post we’ll discuss deployment patterns that allow for implementing scale up and scale out architectures. We’ll also look at features that align with best-practices approaches and strategies. Let’s get to it!
The Need for Scale
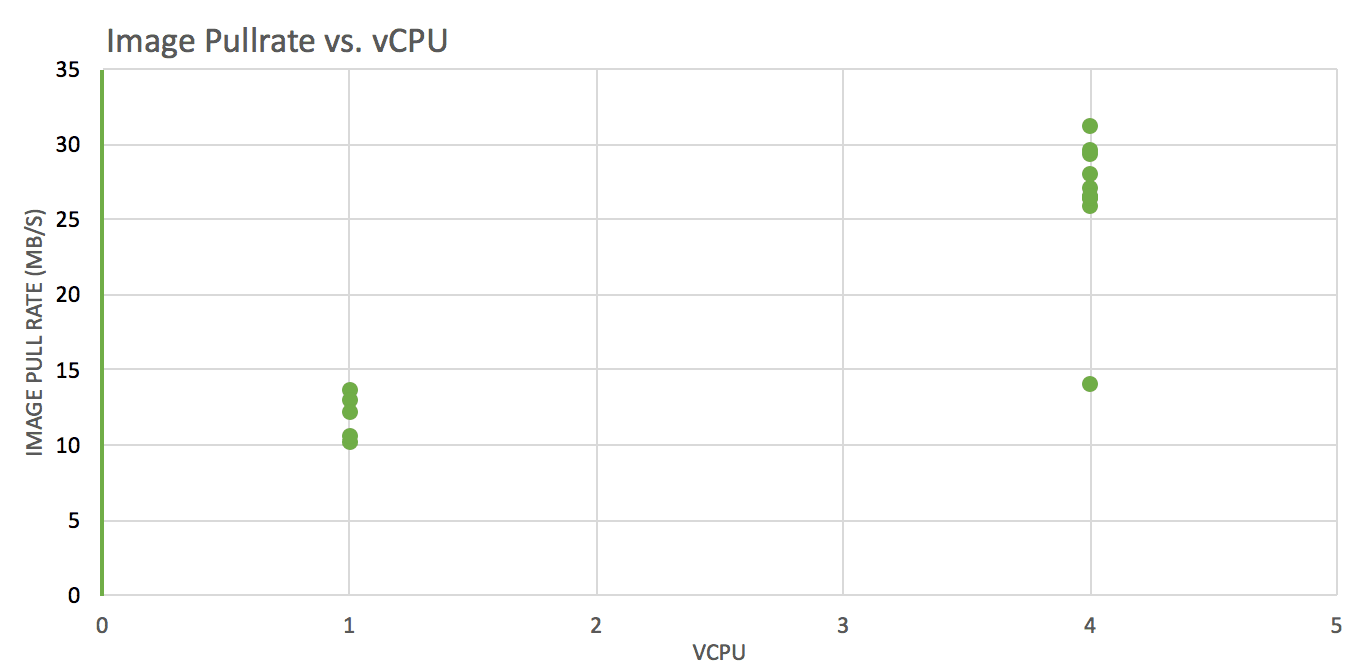
Most of Cribl LogStream workloads are compute-bound. This means that performance is principally determined by the time spent on CPU operations to be completed. Roughly speaking, the amount of CPU time needed is proportional to (at least) these two factors:
The volume of incoming data: This is defined as the amount of data to be processed per unit of time. This can be quantified directly as MB/s, TB/day, PB/day etc.
Amount and type of work done: This is defined as the amount of processing that will happen on incoming data. Are most events passing through and just being routed? Are there a lot of transformations, parsing functions, extractions, field encryptions? Is there a need for heavy re-serialization? Unlike (1), this is harder to quantify (and qualify) properly because actual work done will almost always be different and varied across deployments.
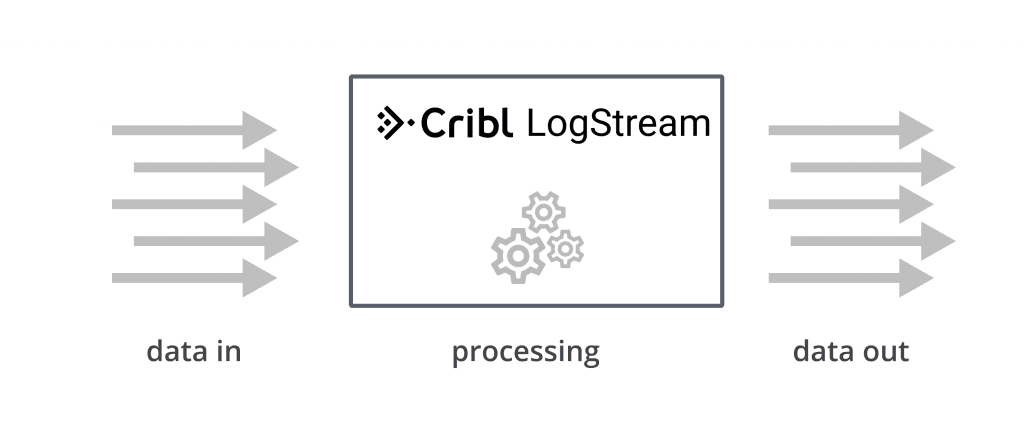
When volume is low and/or the amount of processing is light, a single instance can be sufficient. A faster CPU clock will offer better performance but to sustain even higher data volumes and increased processing you need to scale up or scale out to a distributed deployment.
Scaling Up
A single LogsStream instance installation can be configured to scale up and utilize host resources as needed. By default, a single instance starts with -2 worker processes (explained below) and can consume up to 2 CPU cores at full capacity. More worker processes can be configured via Settings > System > Worker Processes. Setting this less than 1 is interpreted as number of CPUs – setting. For example, in a system with 12 CPUs:
If Process Count is set to
4, then Cribl will spawn 4 Worker Processes using up to 4 CPU cores, leaving 8 free.If Process Count is set to
-2, then Cribl will spawn 10 Worker Processes (12-2), using up to 10 CPU cores, leaving 2 free.
This is a great way of setting the number of workers relativeto the CPUs in the system which tends to work very well for hosts with heterogenous resources.
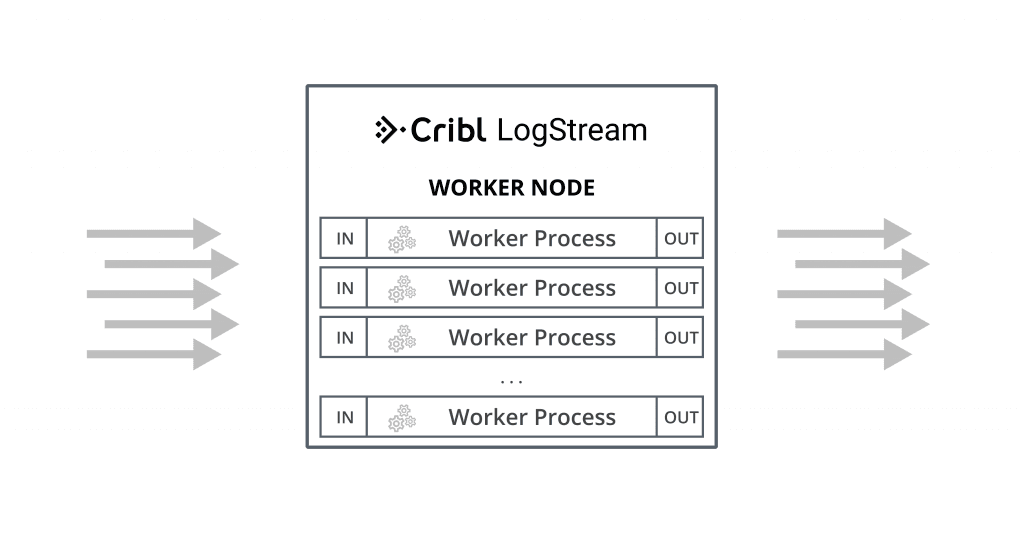
Worker Processes
In LogStream worker processes operate in parallel, independently of each other, from input to processing to output. This means that:
If data comes into a single socket, then it will be processed by a single worker process. To reap the full benefits of multiple worker processes it’s critical that data comes into from multiple sockets.E.g., it is much better to have 10 connections each bringing in 200GB/day than one doing 2TB/day.
Each worker process will maintain and manage its own outputs. E.g., if an instance with 2 worker processes is configured with a Splunk output, then the Splunk destination will see 2 inbound connections.
Scaling Out
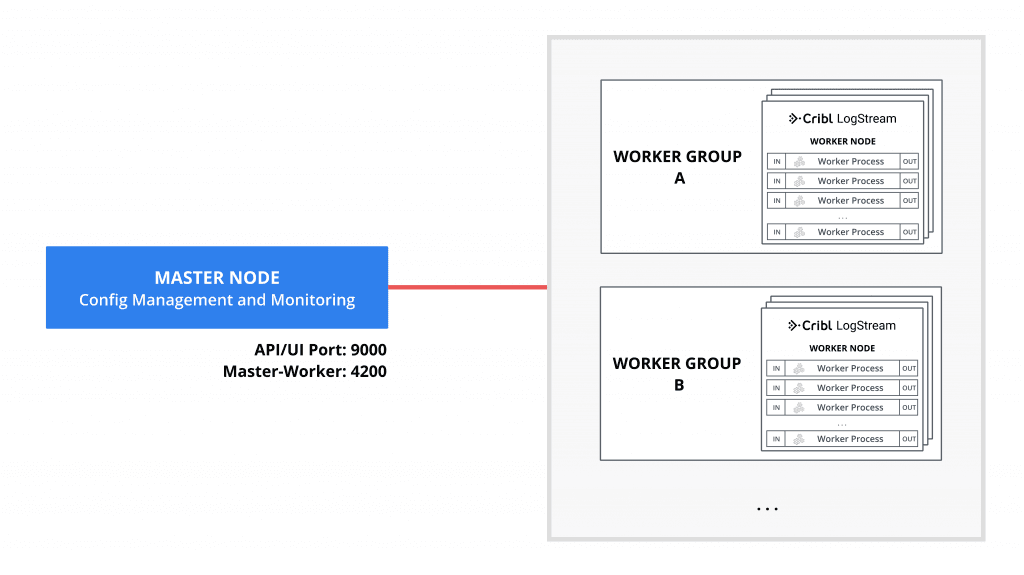
When data volume, processing needs or other requirements exceed those that a single instance can deliver, a Cribl LogStream deployment can span multiple hosts or Worker Nodes. This is known as a Distributed Deployment. Such a deployment follows a shared-nothing architecture pattern where instances behave stateless-ly and serve all inputs, outputs and processing of events independent of each other. They are managed by a single Master Node which serves as:
A central location for Workers’ operational metrics. The Master ships with a monitoring console that has a number of dashboards covering almost every operational aspect the deployment.
A central location for authoring, validating, deploying and synchronizing configurations across Workers.
Configuring Master and Worker Nodes
Master and Worker Nodes can be configured using configuration files, CLI or the UI. To configure using the UI follow these steps:
Master Mode: Settings > Distributed Management, select Mode Master, supply required Master settings: Address, Port (and optional settings if used), and restart.
Worker Mode: Settings > Distributed Management, select Mode Worker, supply required Master settings: Address, Port (and optional settings if used), and restart.
To help with automation – especially in containerized systems -environment variables can also be used. For instance, to configure a Cribl instance as a Worker Node and point it at a Master you can use the following:
CRIBL_DIST_MASTER_URL='tcp://criblmaster@masterHostname:4203 ./bin/cribl startA number of environment variables are supported. Documented here.
How do Workers and Master Work Together
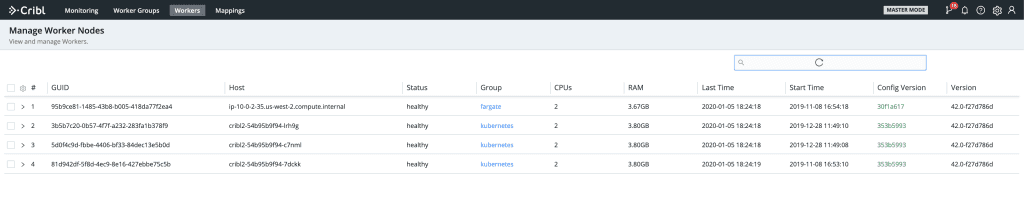
The foundation of Master-Worker communication is a heartbeat which Workers periodically send to the Master. The heartbeat not only tells the Master that a Worker is available but it also includes Worker metrics for the period and a set Worker facts such as hostname, IP address, GUID, current software version, current configuration version etc. that the Master tracks with the connection. On every heartbeat:
The Master uses the supplied metrics to populate the Monitoring console and the facts to map Workers to Worker Group using Mapping Rules. Worker Groups facilitate authoring and management of configurations for a particular set of Workers. I.e. Workers in Worker Group share the same configuration.
Each Worker will pull its Group’s configuration if it does not match the currently running one.
In addition to default facts, Worker can be configured to pass tags, environment variables and preferred group to the Master. This customization makes Mapping more flexible and predictable.
Mapping Workers to Worker Groups
Mapping Rulesets are used to map Workers to Worker Groups. A ruleset is a list of rules that evaluate Filter expressions on the facts that Workers heartbeat to the Master. The ruleset Filter supports full JS expressions (allowing for arbitrary expressability) and similar to Routes are evaluated in a first-match win order.
Example: All hosts that satisfy this condition: IP address starts with 10.10.42 with more than 6 CPUs OR CRIBL_HOME environment variable contains w0, belong to Group420.
Rule Name: myFirstRule
Filter: (conn_ip.startsWith(‘10.10.42.’) && cpus > 6) || env.CRIBL_HOME.match(‘w0’)
Group: Group420
To create a Mapping Ruleset, go to Mappings > Add New. Click on the newly created item and start adding rules by clicking on + Add Rule. While working with rules, the Preview on the right pane will show – in real-time – which currently reporting Workers map to which Worker Groups.
Deploying Configurations
For the Master Node to operate properly it requires git to be available locally. With git, the Master Node offers admins the following benefits:
Ability to manage configuration versions across Worker Groups.
Access to an audit trail of all configuration change.
Visibility to all diffs between current and previous config versions
Git remotes are also supported in case further integration with other systems is needed.
Typical workflow for deploying configurations is the following:
Author Worker Group Configurations
Commit Locally (optionally Push to remote repo)
Deploy to Workers
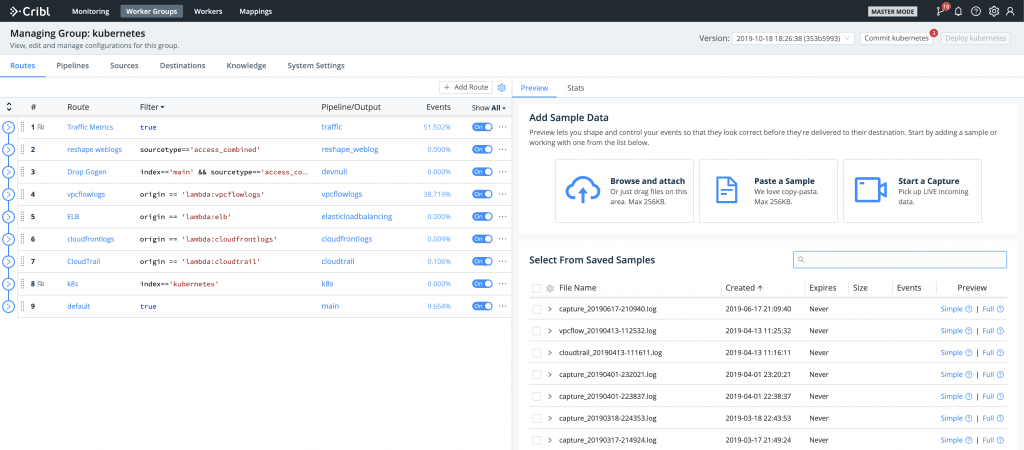
Authoring of configurations is done as if it were a single Cribl LogStream instance – using the same exact visual interface for Routes, Pipelines, Sources, Destinations and System Settings. This is incredibly easy and superior to a typical configuration-file based approach as the system also does real-time validation of configurations.
Monitoring a Distributed LogStream Deployment
In both single instance and Distributed Deployments, LogStream provides operational visibility out of the box. In the distributed case, all Workers forward their metrics to Master which then rolls them up, consolidates them and provides a deployment-wide view. The Monitoring section exposes a number of dashboards with information about traffic in and out of the system. It tracks events and bytes, split by routes, pipelines, inputs, outputs and certain data fields over time. In addition, a number of system metrics are also tracked. Here’s a sample Monitoring screen from one of our lab deployments:
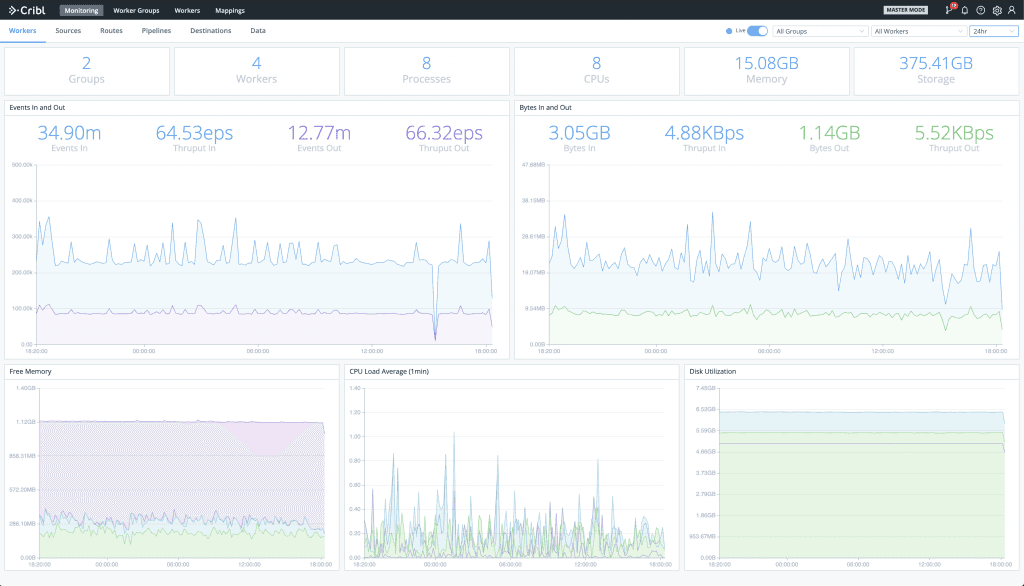
If you’re using another monitoring/observability solution, internal logs and metrics can be forwarded out via Sources > Cribl Internal. This will send cribl.log/metrics down the routes and pipelines just like another data source.
Conclusion
LogStream was built from the ground up to scale. With a shared-nothing architecture it allows for vertical and horizontal scaling – from a laptop to hundreds of Worker Nodes – all with a no-dependencies, single package. The Master node serves as a central management console that provides modern, admin-friendly capabilities such as visual authoring and validation of configurations, integration with git for version control & change auditing and baked-in monitoring of deployment-wide system metrics and health.
If you’re trying to deploy LogStream on your environment or have any questions please join our community Slack– we’d love to help you out.
If you’re looking to join a fast-paced, innovative team drop us a line at hello@cribl.io– we’re hiring!