Datadog is a monitoring and analytics tool for information technology (IT) and DevOps teams that can be used to determine performance metrics as well as event monitoring for infrastructure and cloud services. The software can monitor services such as servers, databases, tools, and applications. Cribl Stream makes it easy to move data from anywhere, to anywhere. We take the saying to heart, and we also allow you to send our Cribl application metrics anywhere. In this case, we are going to expose Cribl’s internal metrics and send them to Datadog.
Sending Cribl Metrics to Datadog
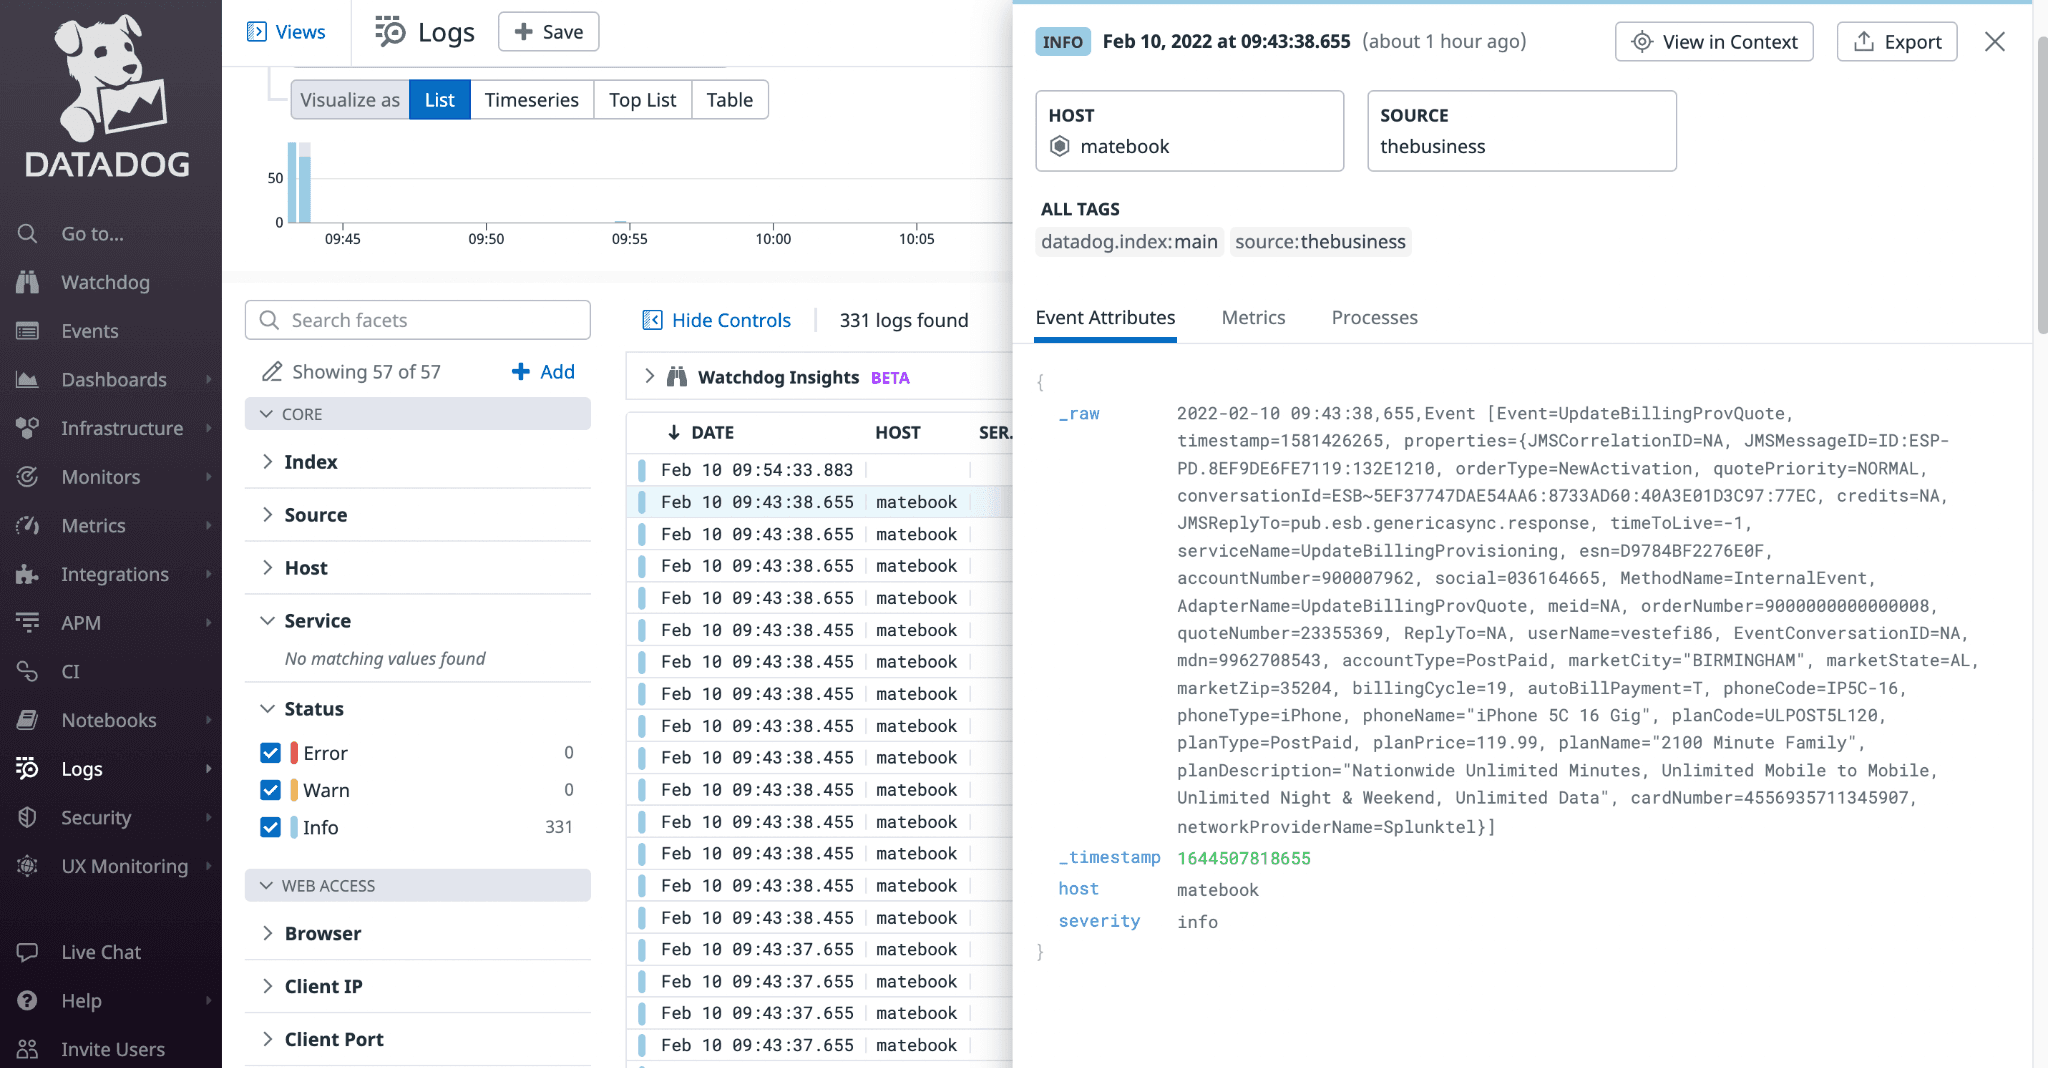
The biggest benefit of using Cribl Stream to collect and route data from any source and send it to Datadog is to cleanse the data by 30%-60% depending on the data source. This will allow you to reduce the amount of events and data being ingested and indexed by Datadog for analysis while maintaining full observability. In this scenario, we simply connect a datagen source to Datadog using QuickConnect.

You can immediately see the events flowing into the Datadog log viewer.
Now that Cribl Stream is a part of the standard Datadog integration any metric in the Cribl namespace will not count toward custom metric billing!
Using Datadog to Monitor Cribl Stream
To enable the Datadog Cribl integration simply navigate in Datadog to Integrations, find and select “Cribl Stream” and click the “Install Integration” button.
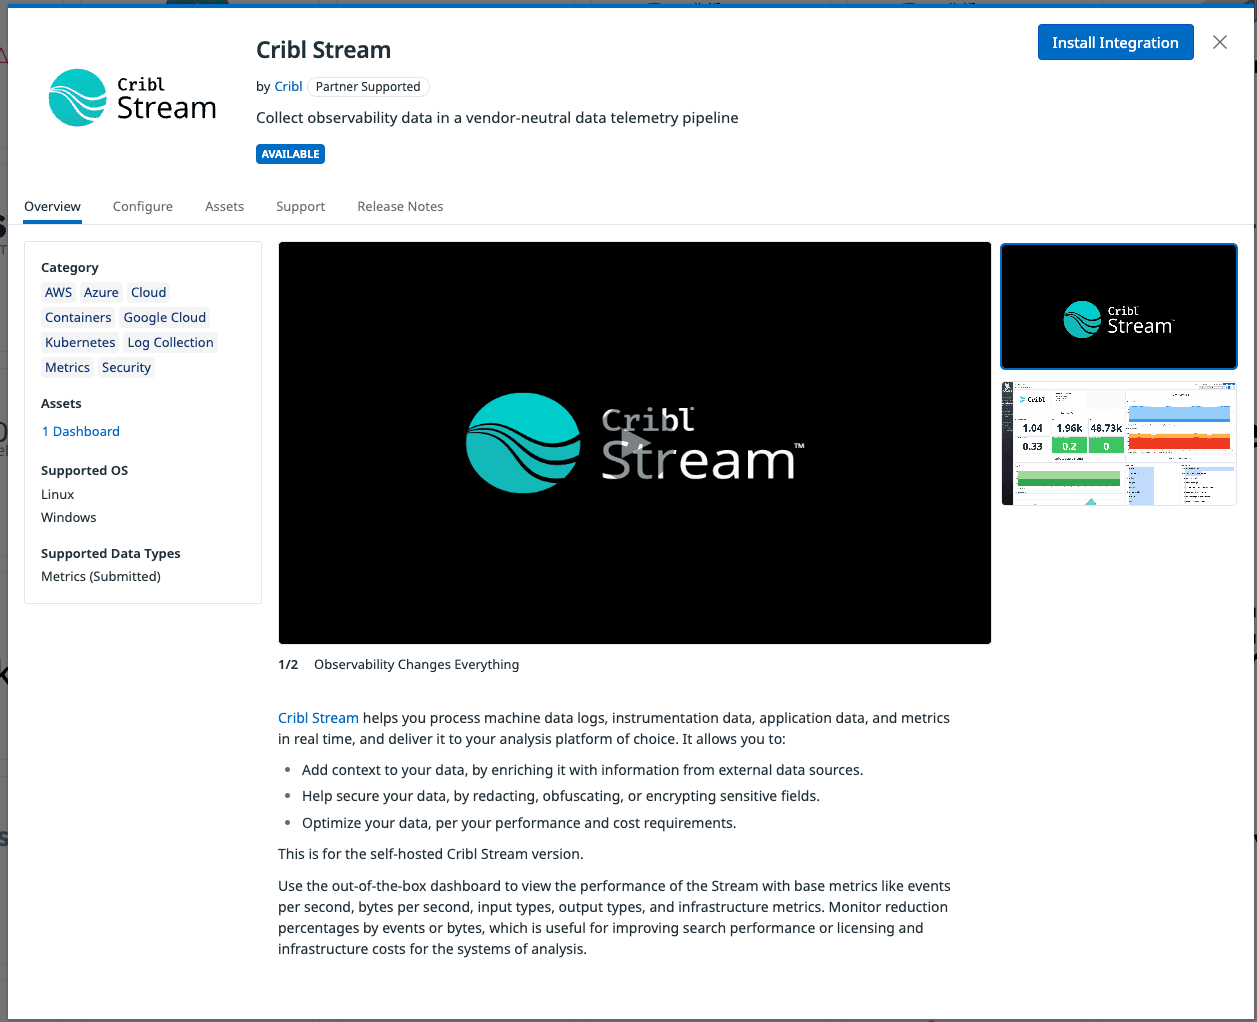
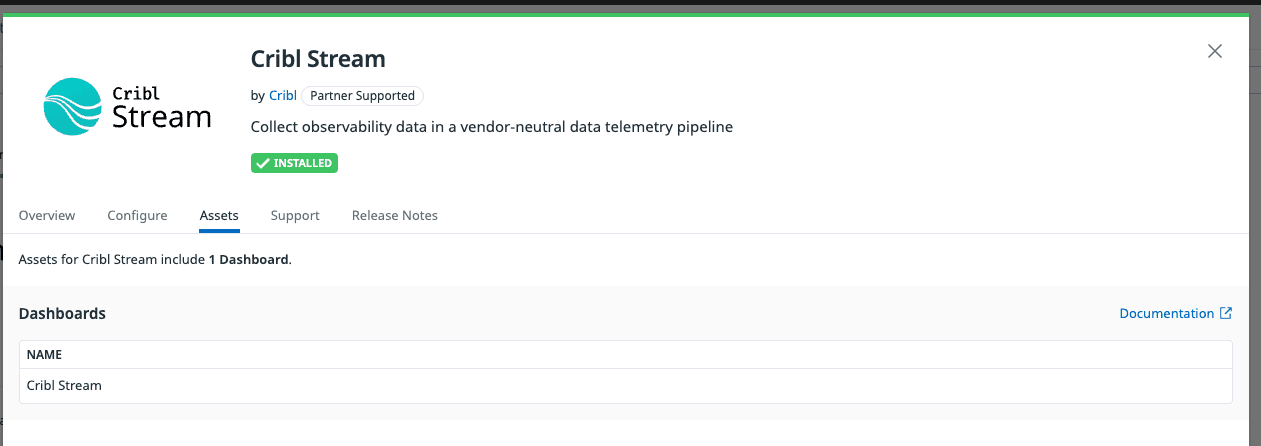
The integration has a pre-built dashboard to help monitor the Cribl Stream application which leverages the Cribl internal metrics source.https://docs.cribl.io/stream/sources-cribl-internal/. If you are using Datadog to monitor your applications and infrastructure this data source will send Cribl Stream internal metrics to the Datadog API. This will expose the following metrics:
cribl.logstream.host.(in_bytes,in_events,out_bytes,out_events)cribl.logstream.index.(in_bytes,in_events,out_bytes,out_events)cribl.logstream.source.(in_bytes,in_events,out_bytes,out_events)cribl.logstream.sourcetype.(in_bytes,in_events,out_bytes,out_events)
From within the Cribl application now enable the Cribl internal metrics as a Stream Data Source:


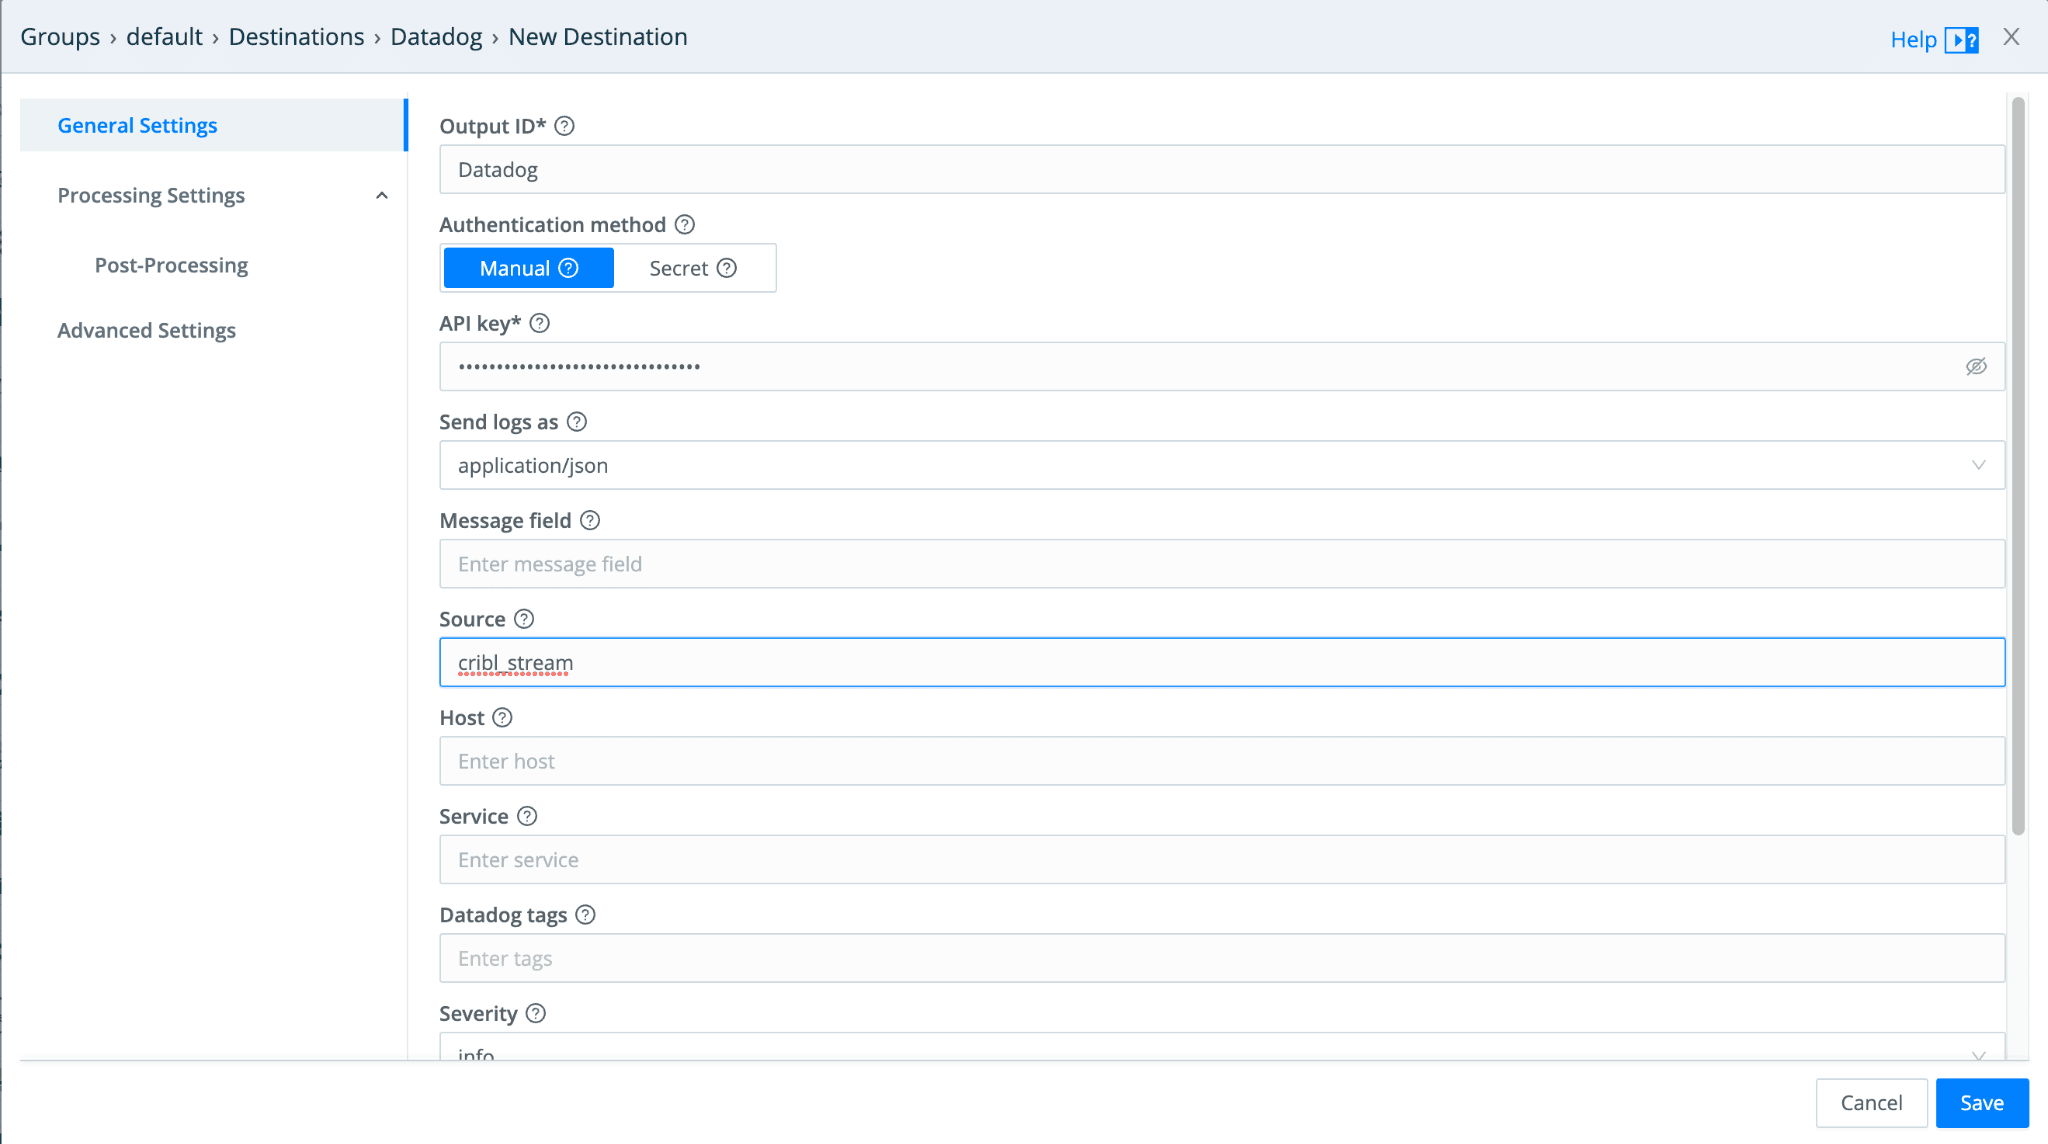
In Stream select Datadog as a destination. If you are already a Datadog user simply add your Datadog API key to the Datadog destination setup. Otherwise, head here to get started with your free Datadog trial.

Connect the Source to the Destination
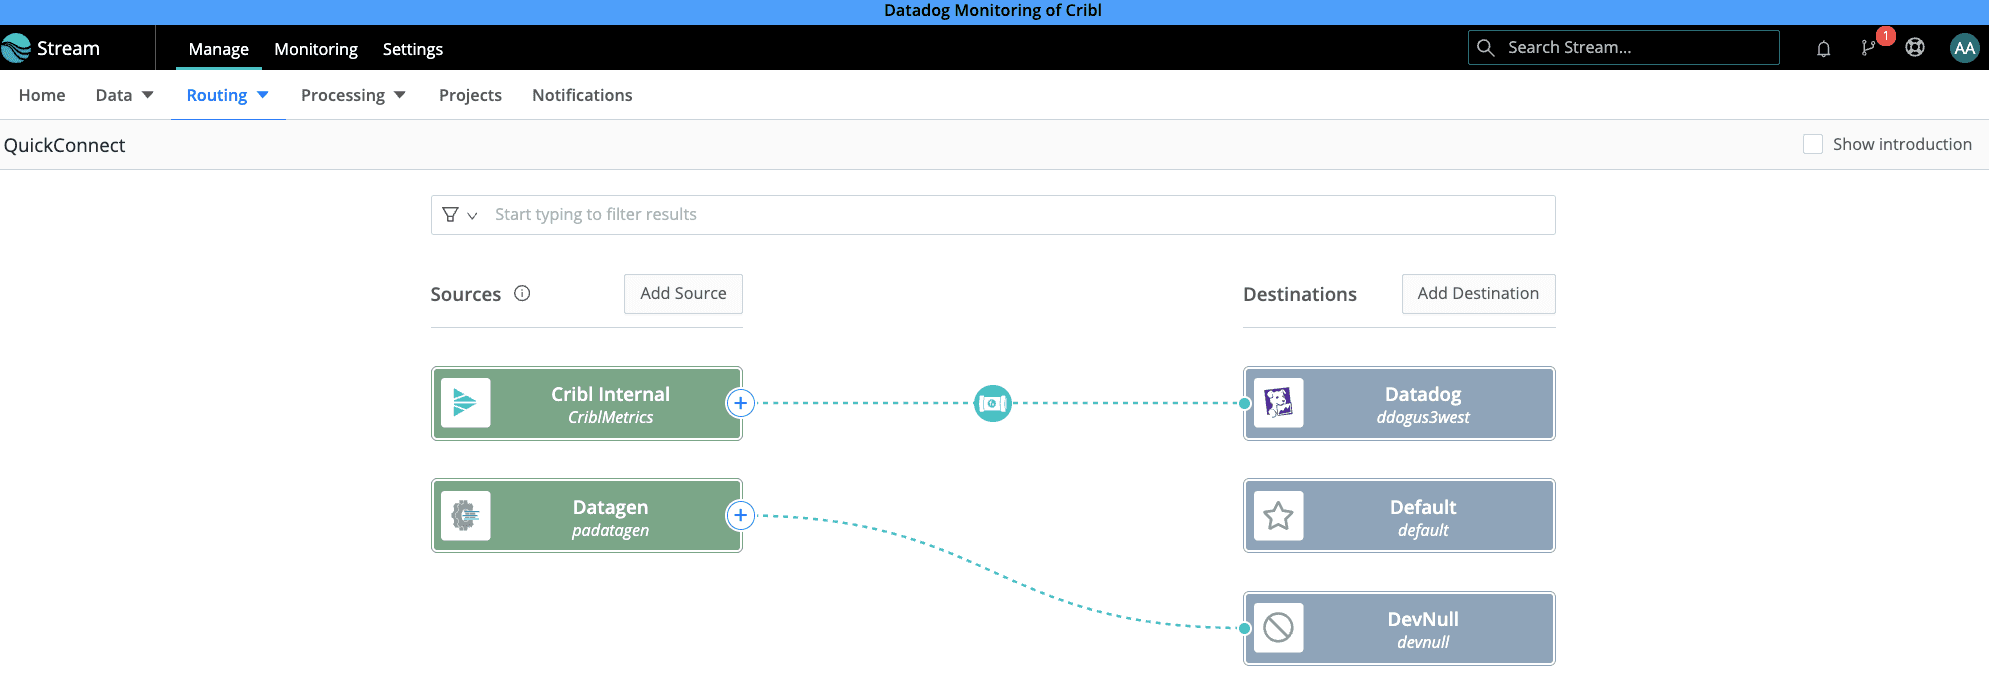
In Cribl – Using Quick Connect, a visual rapid-development UI, you can visually connect Stream inputs (Sources) to outputs (Destinations) through a simple drag-and-drop interface. Using Quick Connect you can select the plus sign and drag and drop Cribl Internal metrics to create a pass-thru connection to Datadog destination.
Dashboarding
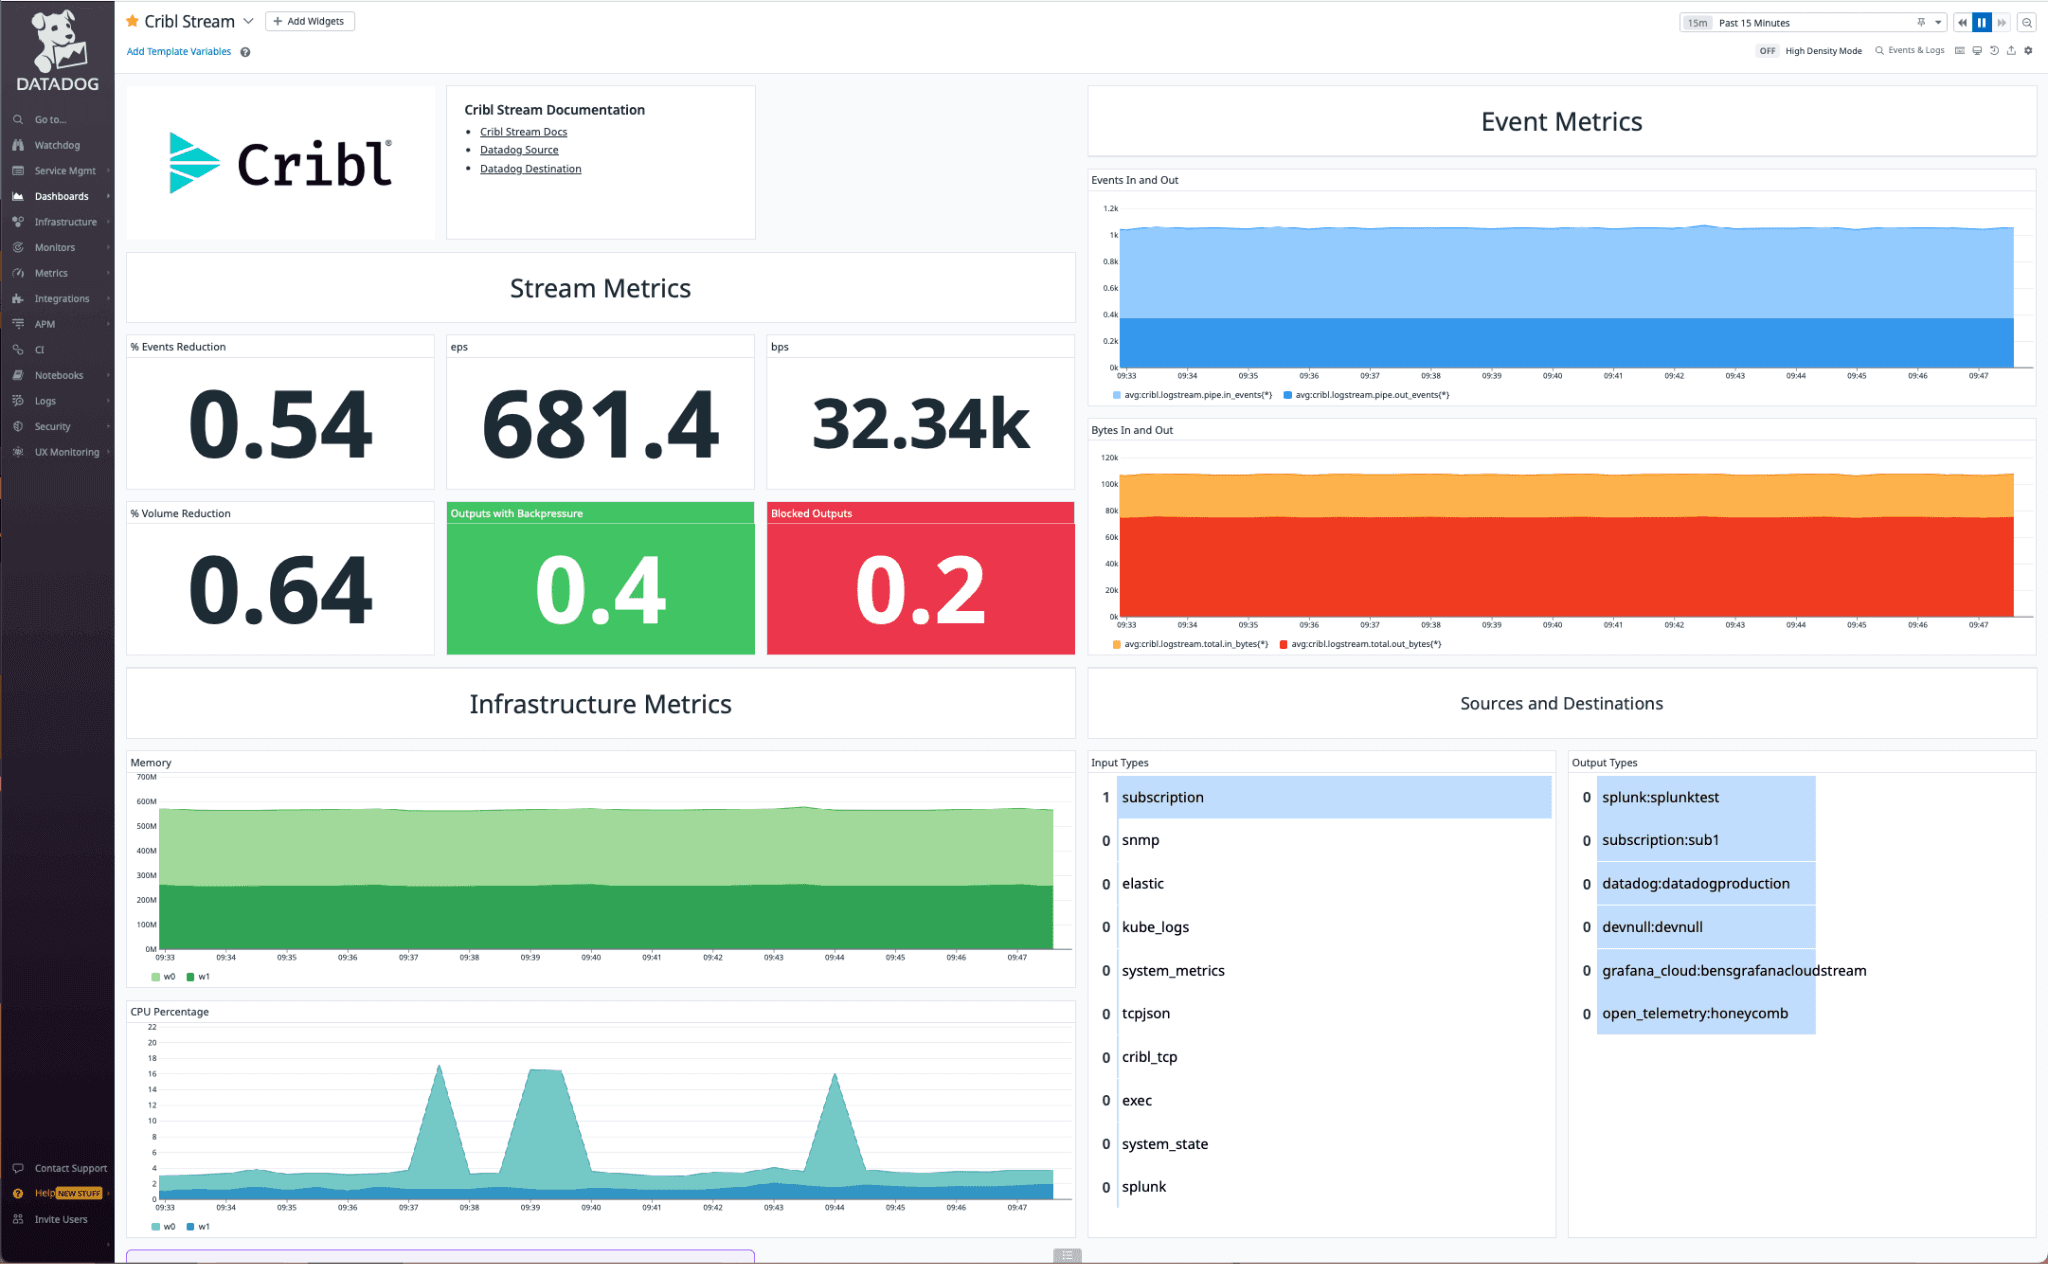
Here we’ve set up a Datadog dashboard that can be shared with your organization. You can see base metrics like events per second, bytes per second, input types, output types, and infrastructure metrics used to monitor the performance of Stream. We also can monitor the percentage of reduction by events or bytes. This is useful if you are trying to improve search performance or licensing and infrastructure costs for the systems of analysis. As previously mentioned you can reduce your Datadog ingest and indexing cost. In most cases, we see a 30% reduction as a rule of thumb and in other cases like DNS we see a much higher reduction.
Alerting within Datadog
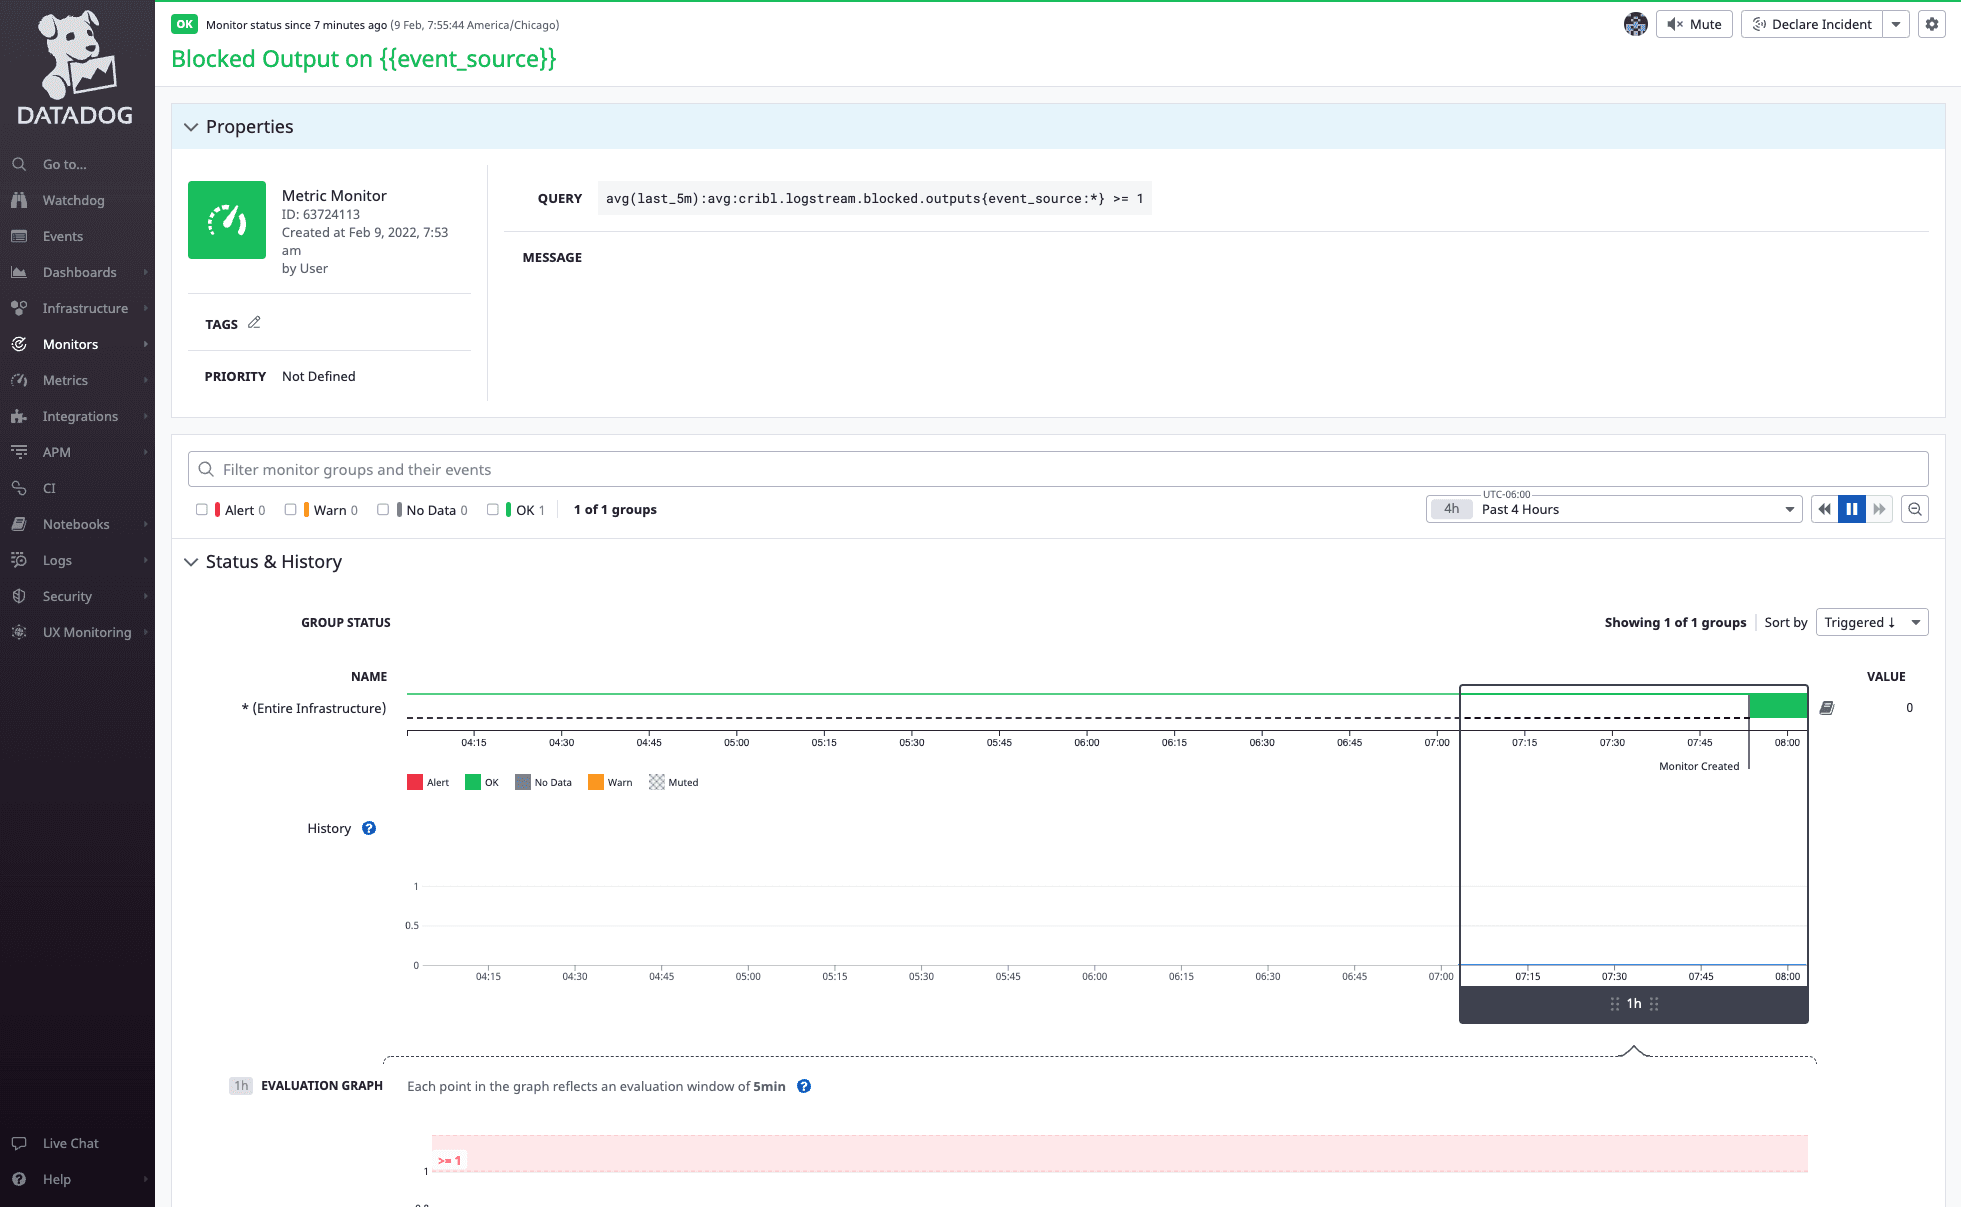
In addition to a Dashboard, we created alerts so you can notify your team in real-time on any blocked output or when the volume reduction percentage starts decreasing.The blocked output alert is configured to send out an alert as soon as you see a Stream destination is no longer available. This alert will trigger when there are 1 or more blocked outputs this way you can ensure to avoid any backpressure on the data source.
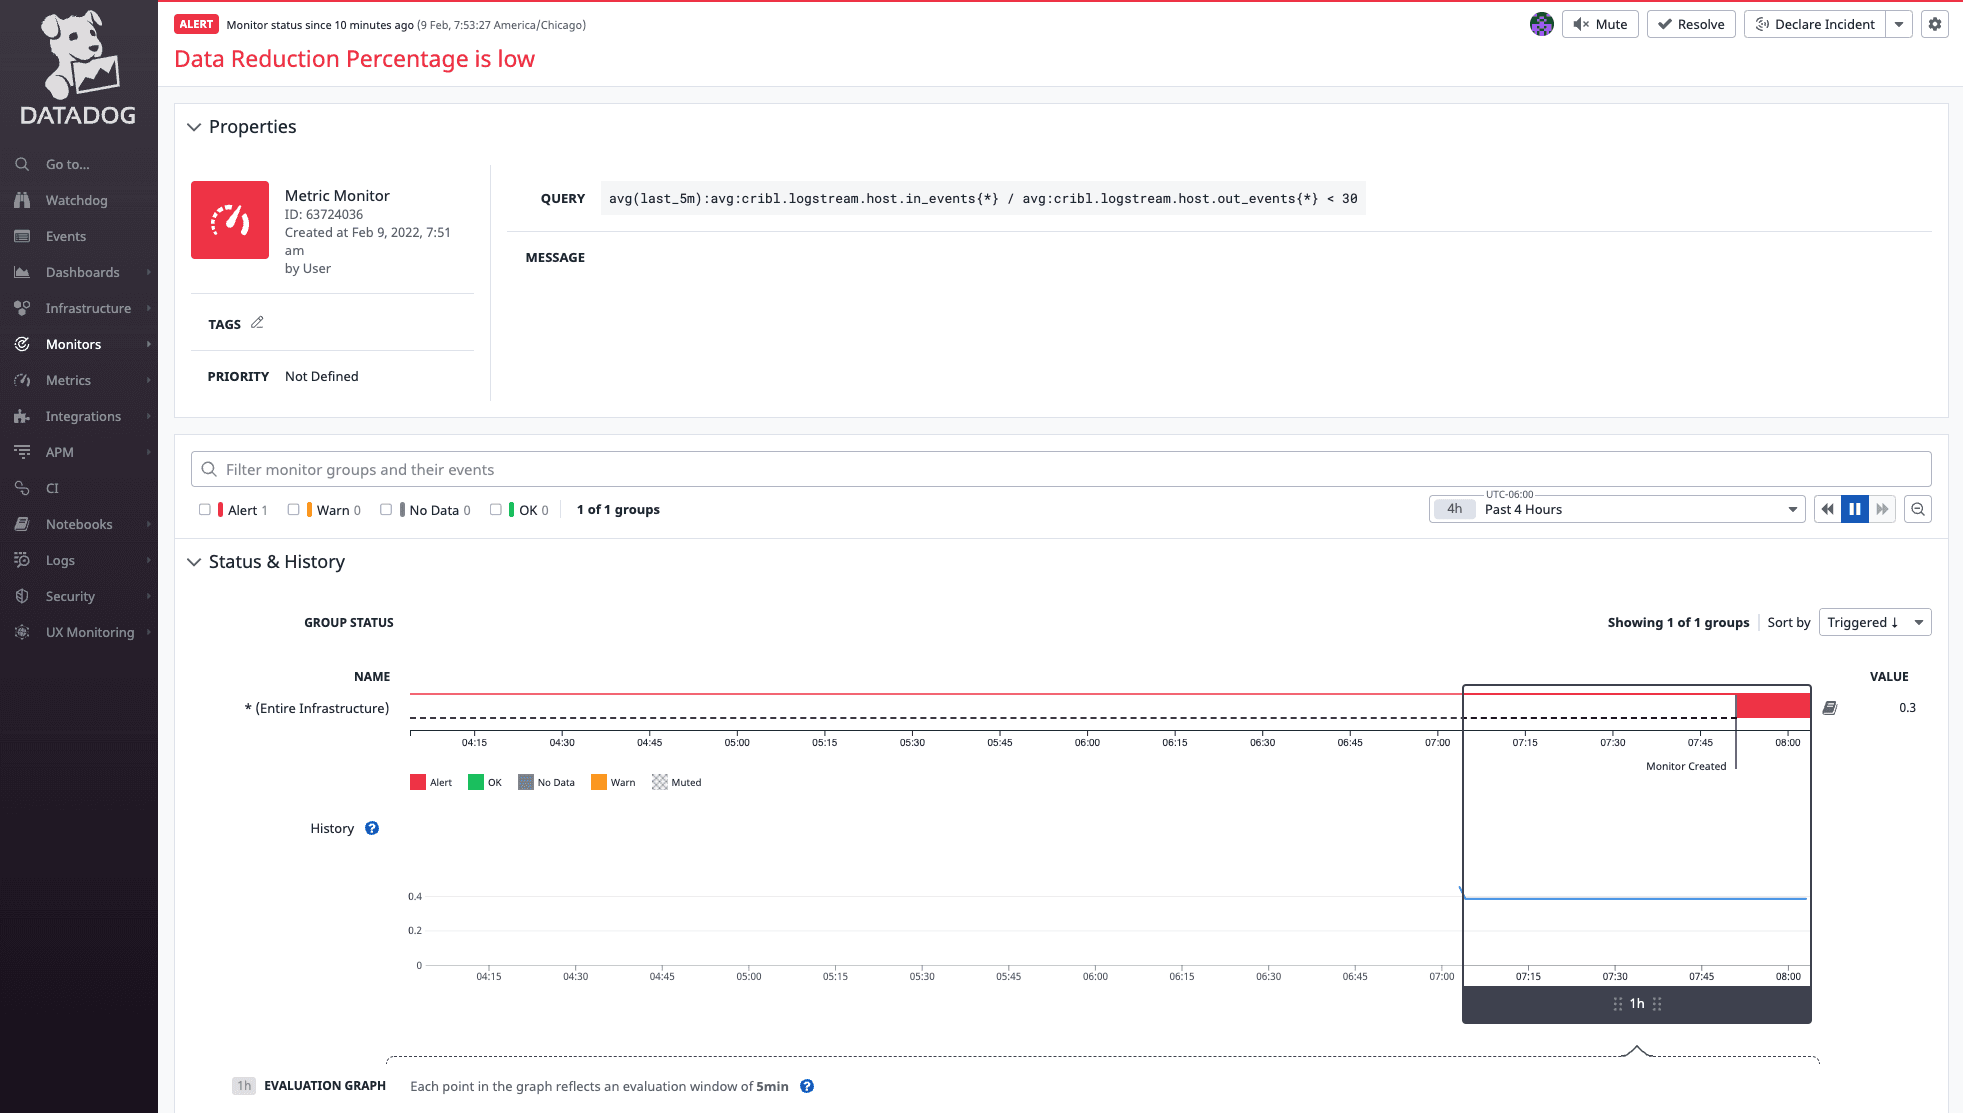
The second alert will fire when your volume reduction no longer meets your business goals. In this case, you are trying to achieve at least a 30% volume reduction. When this percentage drops below that threshold you can examine if a new source has been added to Cribl Stream or a developer has turned on DEBUG logging and is flooding the system with high volume low-value logs.
Wrap Up
You can see how easy it is to configure and set up Cribl Stream to both reduce data being sent to Datadog along with the ability to monitor the performance of your Cribl Steam infrastructure. Datadog Dashboards can be used to see the health of your throughput and infrastructure in real-time. While alerts will help you in real-time get notifications when your data reduction business objectives are no longer being achieved. Do you want to try it for yourself? Cribl Stream is available as a free download to run in your own environment or you can create a free account on Cribl.Cloud to get started immediately! If you’re logged into your Datadog account, click here to find the Cribl integrations.


