
When we discuss observability for applications running in Kubernetes, most people immediately default to Metrics, Logs, and Traces – commonly referred to as the “three pillars.” These pillars are just different types of telemetry – signals that can be fed into observability platforms to help understand how an application behaves. But did you know that Kubernetes offers another valuable signal? When combined with the other signals, you get MELT. No, it’s not a fantastic hot sandwich, but the E in MELT stands for Events, which can tell you much about the state of your Kubernetes clusters and deployments.
What are Kubernetes events?
Kubernetes events are a gold mine of information for monitoring and troubleshooting issues in Kubernetes. Anytime anything happens within a cluster, an event is recorded. All the lifecycle stages of various Kubernetes objects, such as pods, nodes, services, and deployments, are emitted as events and are not recorded in any log file.
So, if the events don’t persist anywhere outside your cluster, how can you leverage them to understand what’s happening in your cluster over time? Kubernetes Events are available via the Kubernetes API and are returned as JSON objects. With Cribl Edge, you can retrieve and enrich these events with additional metadata about your environment to allow your teams to correlate events with the logs and metrics emitted for your deployments.
Types of Kubernetes events
While we won’t get into all the possible events emitted from a cluster, you can start by paying attention to failed or evicted events and volume or node events.
Failed events can signal issues pulling down container images, like an ImagePullBackOff error or FailedCreate when a pod can’t be created. Evicted events will alert you to issues with possible resource contention when pods are evicted from a node without sufficient resources.
Node events like NodeNotReady or NodeNotSchedulable will inform you that a cluster node isn’t yet ready to schedule any workloads.
FailedAttachVolume or VolumeResizeFailed can warn you about issues with attached storage on your cluster.
Now that we understand Kubernetes events, how do we add them to our observability toolkit? Do not fear! The rest of this post will walk you through making the most of this telemetry signal with Cribl Edge.
You can use kubectl to fetch the latest events in your cluster in a terminal:
$ kubectl get events -n demo
76s Normal Scheduled pod/my-otel-demo-cartservice Successfully assigned demo/my-otel-demo-cartservice to ip-xxx-xxx-xxx-xxx.us-west-1.compute.internal
73s Normal Pulling pod/my-otel-demo-cartservice Pulling image "busybox:latest"
73s Normal Pulled pod/my-otel-demo-cartservice Successfully pulled image "busybox:latest" in 620ms (620ms including waiting)
72s Normal Created pod/my-otel-demo-cartservice Created container wait-for-redis
72s Normal Started pod/my-otel-demo-cartservice Started container wait-for-redis
71s Normal Pulled pod/my-otel-demo-cartservice Container image "ghcr.io/open-telemetry/demo:1.6.0-cartservice" already present on machine
71s Normal Created pod/my-otel-demo-cartservice Created container cartservice
71s Normal Started pod/my-otel-demo-cartservice Started container cartservice
98s Normal Killing pod/my-otel-demo-cartservice Stopping container cartservice
76s Normal SuccessfulCreate replicaset/my-otel-demo-cartservice Created pod: my-otel-demo-cartservice
76s Normal ScalingReplicaSet deployment/my-otel-demo-cartservice Scaled up replica set my-otel-demo-cartservice to 1
…
In the above example, we can see details about the deployment of our shopping cart service, like the pod being scheduled to a node, the container image being pulled and the successful creation of the pod.
The ‘kubectl describe‘ command will also list the latest events for a Kubernetes object at the end of its output:
$ kubectl -n demo describe pod/my-otel-demo-cartservice
Events:
  Type Reason Age From Message
  ---- ------ ---- ---- -------
  Normal Scheduled 6m11s default-scheduler Successfully assigned demo/my-otel-demo-cartservice to ip-192-168-5-175.us-west-1.compute.internal
  Normal Pulling 6m8s kubelet Pulling image "busybox:latest"
  Normal Pulled 6m8s kubelet Successfully pulled image "busybox:latest" in 620ms (620ms including waiting)
  Normal Created 6m7s kubelet Created container wait-for-redis
  Normal Started 6m7s kubelet Started container wait-for-redis
  Normal Pulled 6m6s kubelet Container image "ghcr.io/open-telemetry/demo:1.6.0-cartservice" already present on machine
  Normal Created 6m6s kubelet Created container cartservice
  Normal Started 6m6s kubelet Started container cartservice
Most of the information in the output of our example is informational, as this deployment deployed without issues. Which events should we be looking out for? Let’s get into that next.
Capturing Events with Cribl Edge
Edge has a Kubernetes Events Source that communicates with the Kubernetes API to collect events. You can enable the source from either the Collect or Sources screens:

Once you enable the source, Edge will elect one of the pods in its deployed Daemonset to place a ‘watch’ on the API Server and start collecting events as they are generated in the cluster. For now, the default configuration is fine. We’ll worry about Filters later.
Events are emitted as a JSON object, which will be formatted by the built-in k8s events breaker used by the Kubernetes Event source.

The default breaker makes the syntax to filter and make decisions about events easier. As you see in the example above, the fields we are interested in are object.kind, object.type, object.reason. Within the object.metadata field, you’ll find the name of the affected Kubernetes object and its namespace.
Routing Kubernetes events
Once you have events coming in, the next step is determining something useful to do with them. Kubernetes events are similar to a structured log. There is a group of fields in a fixed structure, which are perfect for sending to your logging or observablity platform. To do that, create a data route with a filter to capture this data.
From the Data Routes UI, select ‘Add Route,’ select an ‘Output’ from one of your configured destinations, use a ‘passthru’ pipeline and enter the following for your ‘Filter’ expression:
__inputId=='kube_events:in_kube_events'
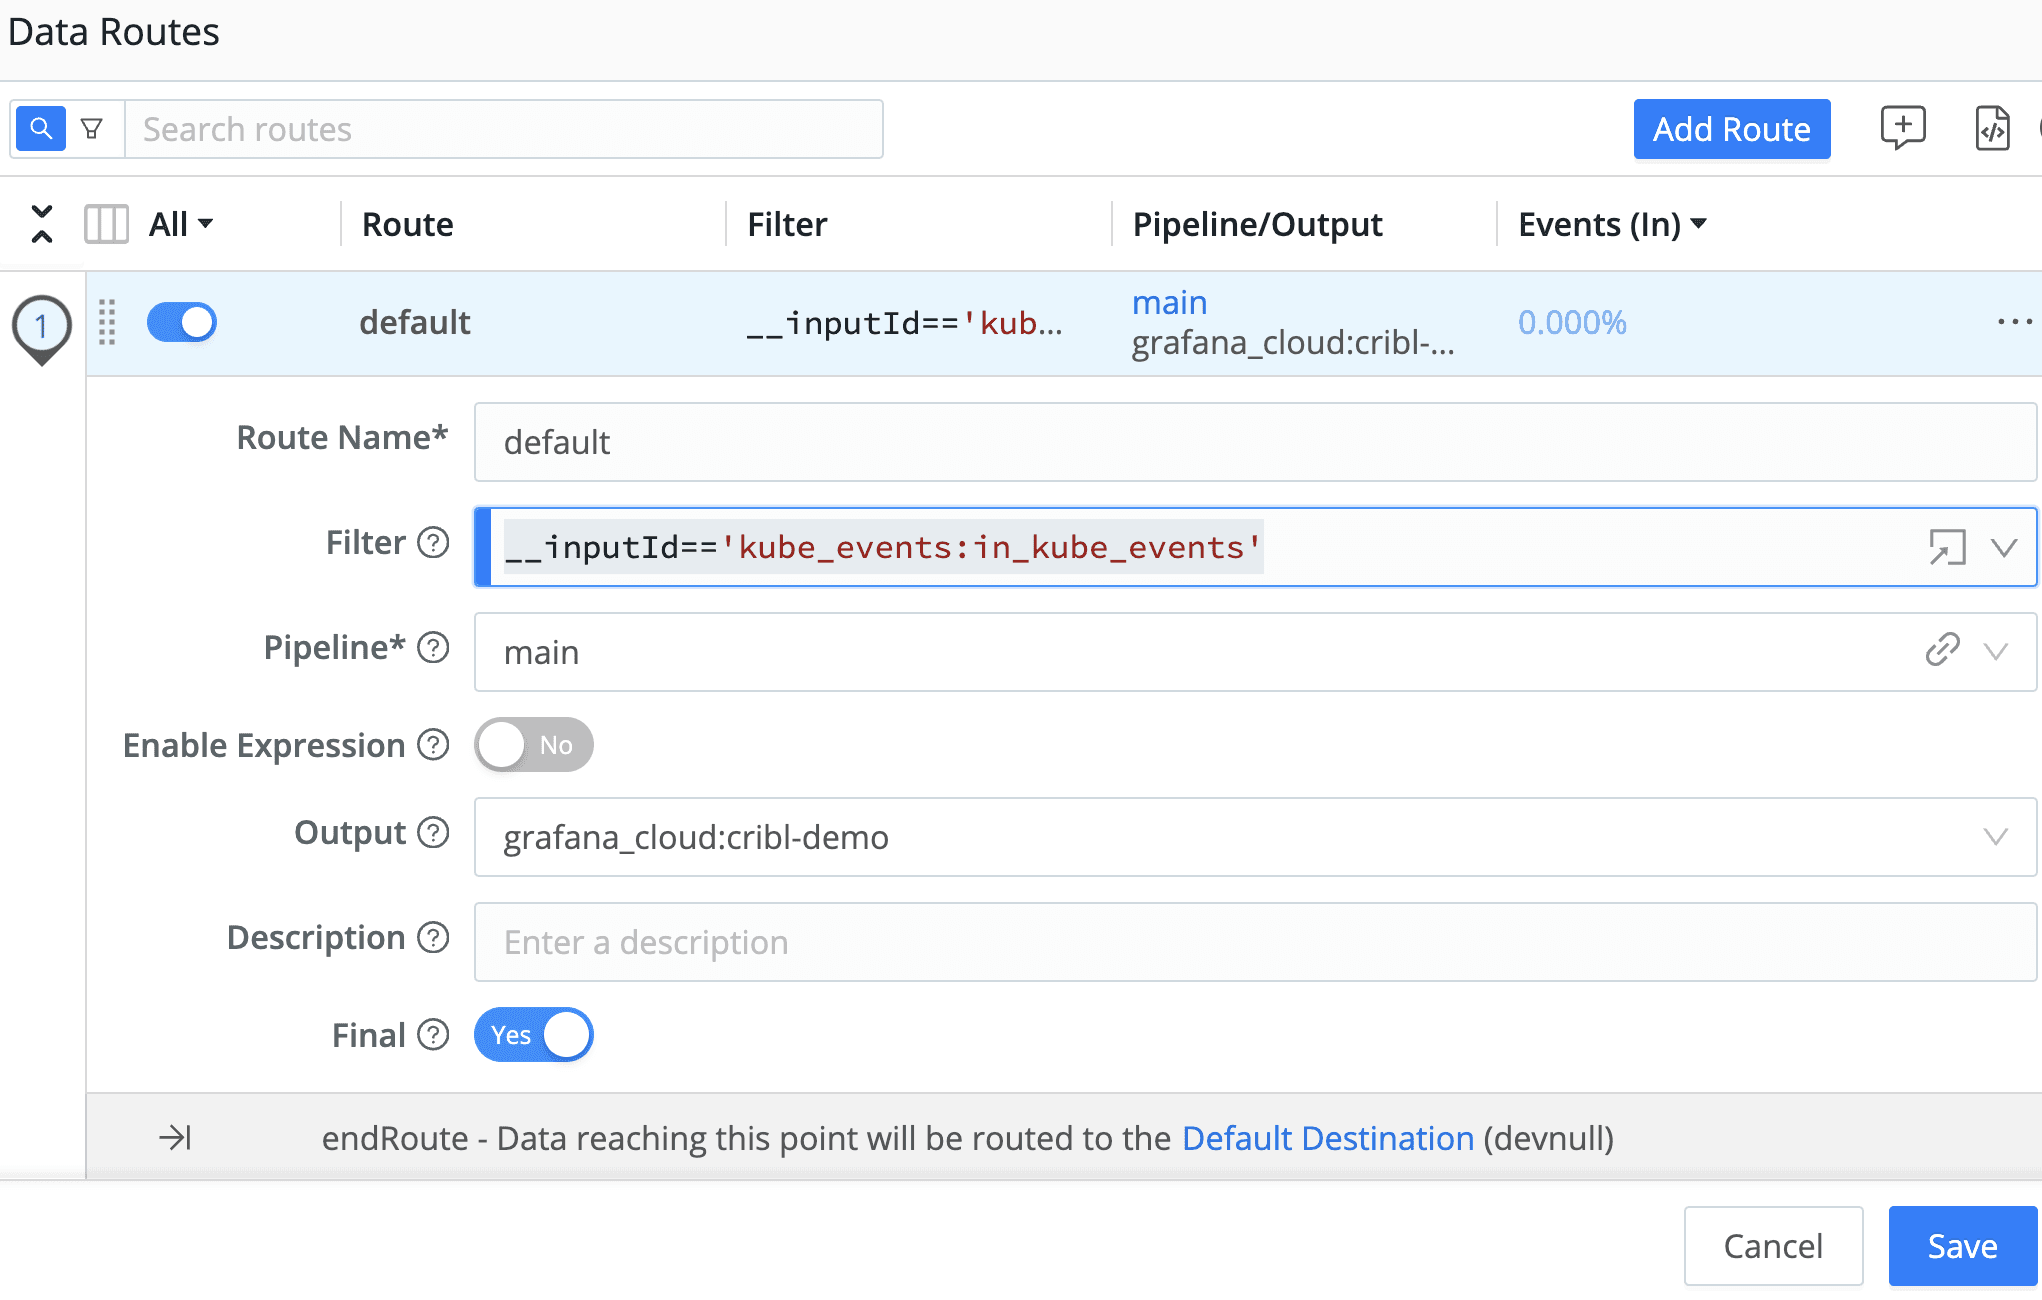
In the example above, we’re filtering for Edge’s Kubernetes Event source as our input and sending the data to a Loki instance running in Grafana Cloud. Depending on your destination, you may need to transform the data to the correct format. In the case of Loki, the destination in this blog is sending the _raw field along with a job label.
Depending on the size of your cluster and how often new workloads or jobs are deployed, the Kubernetes event source can send a large amount of data. For example, installing the OpenTelemetry Demo in my cluster generated 140 unique events for 12 services deployed. Let’s dig into how we can tame the volume on this telemetry source.
Filtering Kubernetes events
The Kubernetes Events Source provides filter rules to filter for specific Kubernetes events, reducing volume to help with cost savings allowing you to send only the critical events that truly matter – ensuring that only the most pertinent signals are amplified. When troubleshooting, examining events can reveal the sequence of changes that may have led to issues, such as pod failures or scheduling problems.
To make sure the right signals are making it through to your downstream systems, we want to filter for events where the type is equal to Warning or the event reason matches the following list:
AlreadyMountedVolume, BackOff, BackoffLimitExceeded, ContainerGCFailed, DeadlineExceeded, ErrImageNeverPull, Evicted, Failed, FailedAttachVolume, FailedCreate, FailedDaemonPod, FailedDelete, FailedMapVolume, FailedMount, FailedPlacement, FailedPostStartHook, FailedPreStopHook, FailedScheduling, FileSystemResizeFailed, FreeDiskSpaceFailed, HostNetworkNotSupported, HostPortConflict, ImageGCFailed, IngressIPRangeFull, InsufficientFreeCPU, InsufficientFreeMemory, Killing, KubeletSetupFailed, NetworkNotReady, NodeNotReady, NodeNotSchedulable, NodeSelectorMismatching, OutOfDisk, PodFailurePolicy, Preempted, Preempting, Rebooted, Starting, SystemOOM, Unhealthy, VolumeResizeFailed
To start, create a new pipeline with two functions to filter any events that don’t match our criteria above:
Add a Filter Rule with the following ‘Filter’ expression to the Kubernetes Event Source:
object.type.equals('Warning') || object.reason.search(/(AlreadyMountedVolume|BackOff|BackoffLimitExceeded|ContainerGCFailed|DeadlineExceeded|ErrImageNeverPull|Evicted|Failed|FailedAttachVolume|FailedCreate|FailedDaemonPod|FailedDelete|FailedMapVolume|FailedMount|FailedPlacement|FailedPostStartHook|FailedPreStopHook|FailedScheduling|FileSystemResizeFailed|FreeDiskSpaceFailed|HostNetworkNotSupported|HostPortConflict|ImageGCFailed|IngressIPRangeFull|InsufficientFreeCPU|InsufficientFreeMemory|Killing|KubeletSetupFailed|NetworkNotReady|NodeNotReady|NodeNotSchedulable|NodeSelectorMismatching|OutOfDisk|PodFailurePolicy|Preempted|Preempting|Rebooted|Starting|SystemOOM|Unhealthy|VolumeResizeFailed)/i)==-1
Our new filter rule will match all events with a type of Warning, or the event reason is not in our predefined list due to the search() method returning -1 if no match is found.
In our demo environment, after ingesting 100 events, our rule reduced that event stream to 22 – a 78.00% reduction!
You can create multiple Kubernetes Events sources if you’d like to customize your filter rules per namespace for more flexibility.
Adding Events to Metrics
While dropping events can eliminate unnecessary noise, you might not want to lose some of that information about changes and occurrences within the cluster, such as pods being scheduled and other state changes, which can help your Platform or Observability Engineers get a complete picture of what is happening in your clusters.
This is where metrics come into play. At Cribl, we talk a lot about converting logs to metrics and extracting metrics, and now we’ll do the same for events. By converting Kubernetes events to metrics, we can provide quantitative data about the events in your cluster, which your teams can leverage alongside application metrics, distributed traces, and logs for effective troubleshooting.
Next, we’ll create a new pipeline for aggregating the events into metrics and send them to a time-series database.
In our pipeline, we will use the Aggregation function to create a Counter metric named ‘kube_event_reason_total’, creating a new metric based on each event type using the ‘object.reason‘ expression in the functions Group by fields setting. We’ll set the Time Window to 60 seconds, but you can downsample further to 120 or 300 seconds to reduce the total number of event metrics stored.
You can also add additional dimensions from the event object.metadata.namespace or object.metadata.name to get the name of the pod. For each dimension you add, you’ll increase the cardinality of the metric. Remember, we are already sending the events to a downstream logging system. These metrics can trigger alerts for an increase in evicted Pods, for example.
We’ll also add a Rename function to the pipeline to drop the object from the dimension name and leave us with just reason and namespace.
To create your pipeline:
Add an ‘Aggregations’ function with the following with the following values:
Time window: 60s
Aggregates:
count(object.reason).as('kube_event_reason_total')Group by fields:
object.reason, object.metadata.namespaceTime Windows Settings > Cumulative aggregations: Yes
Add a ‘Rename’ function with the following Rename fields:
'object.metadata.namespace' = namespace'object. reason' = reason
Add a Publish Metrics function
Your functions should look similar to the following:


Your new pipeline will then produce metrics similar to the following:
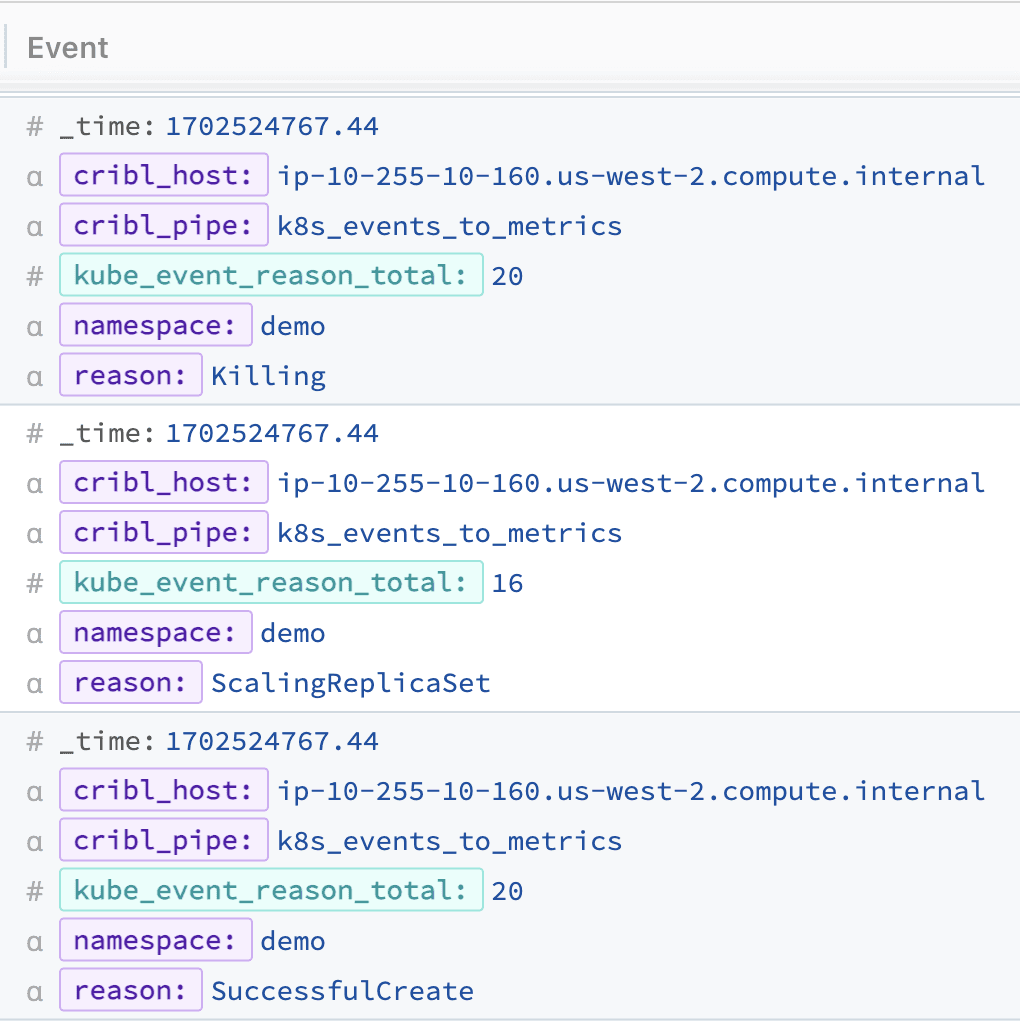
Note that when you view this in the Pipeline preview window, you’ll see these metrics at the bottom of the OUT tab below the dropped events.
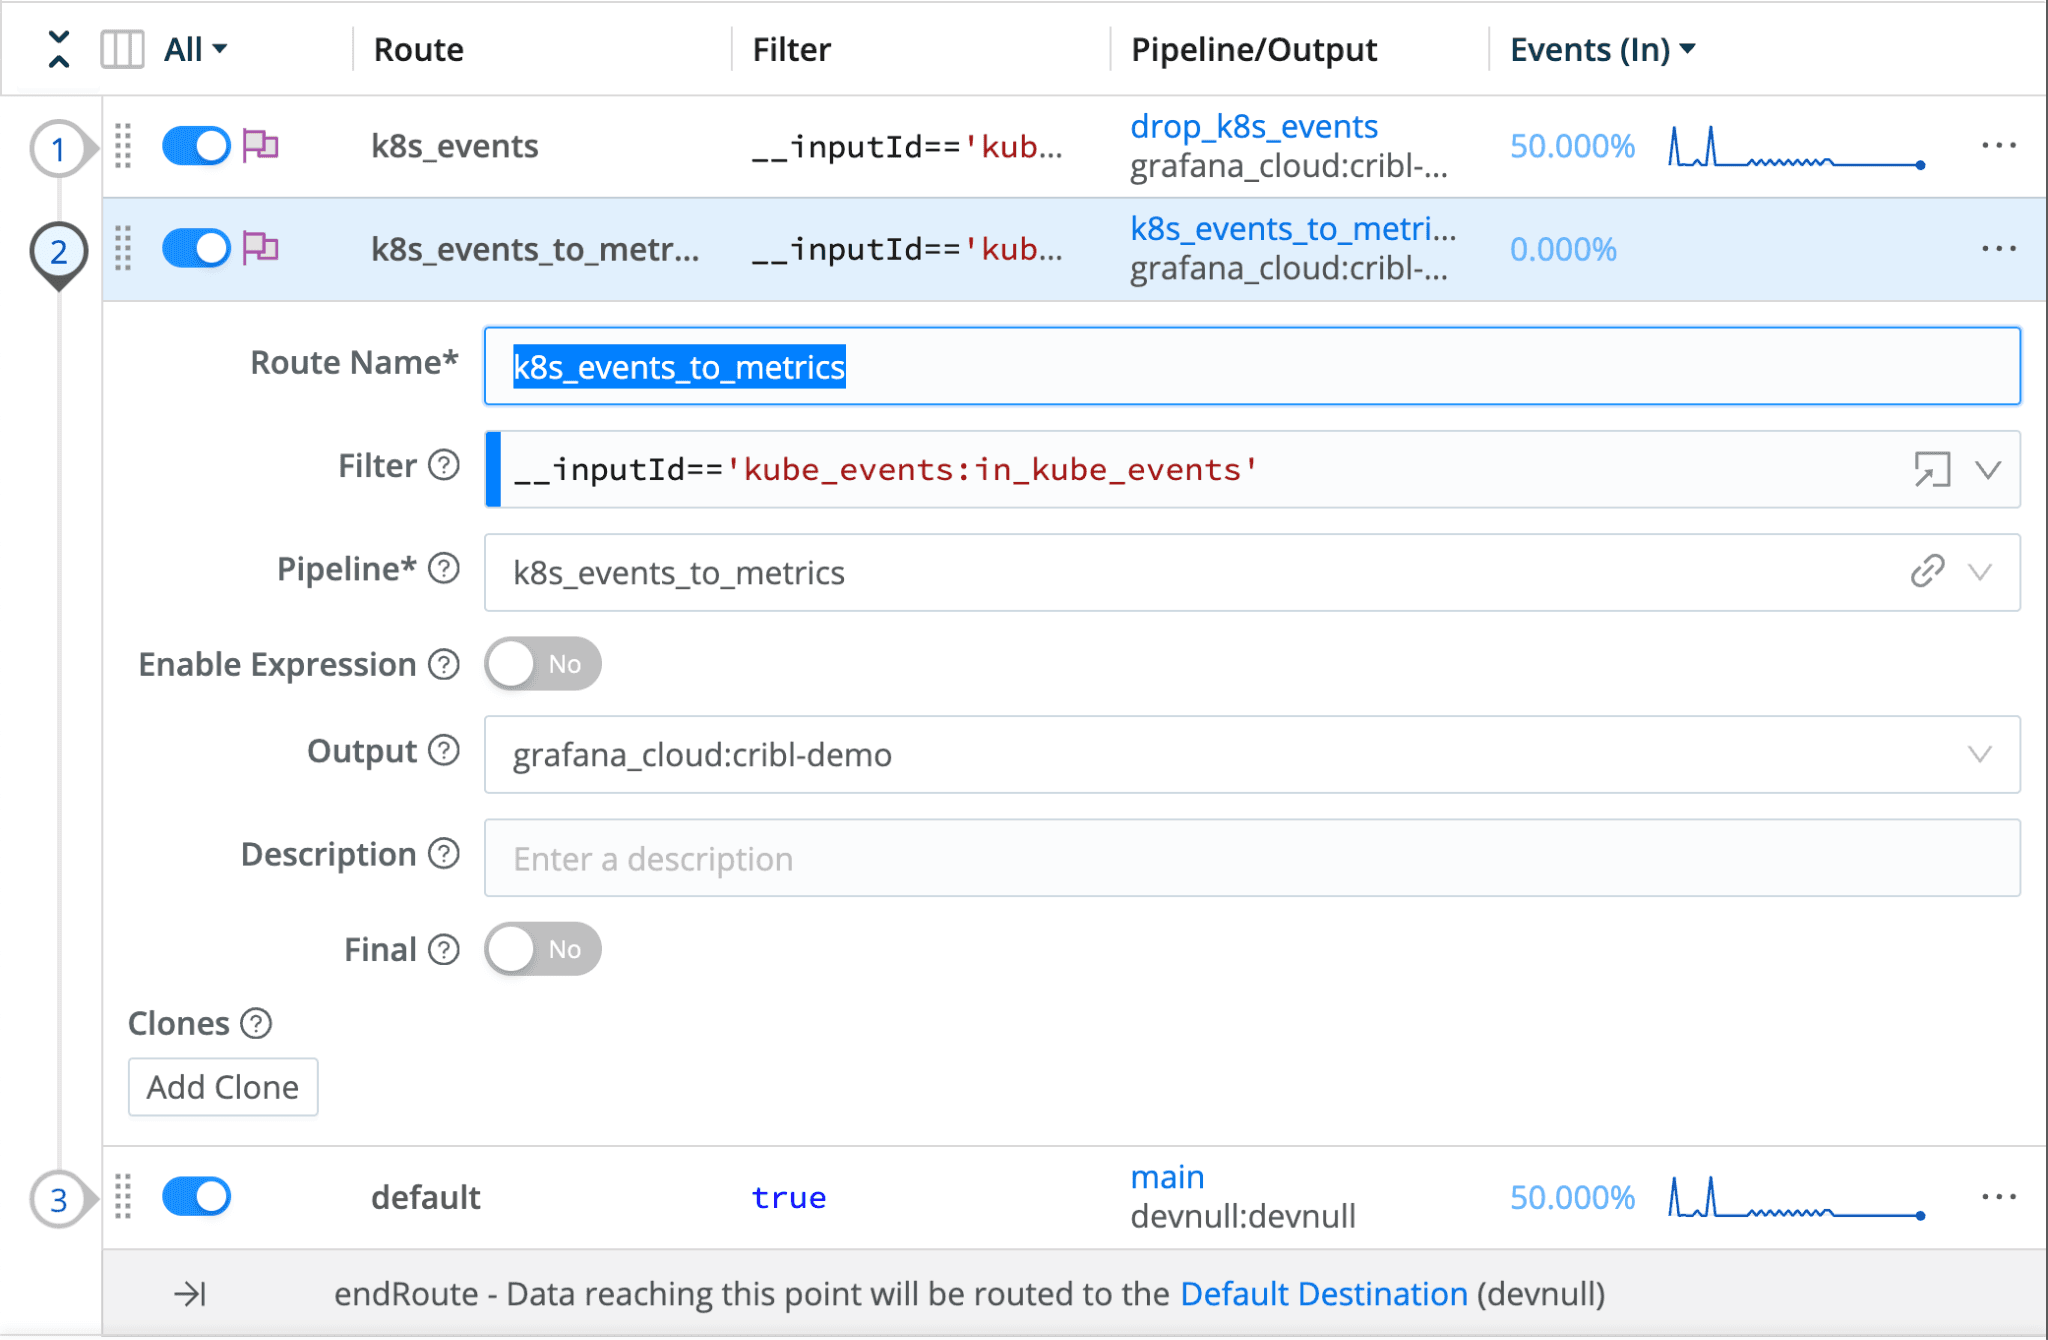
Finally, you’ll add a new data route to send the events to your time-series destination using the pipeline we just created:
Adding Kubernetes events to your workflow
You can create a cohesive narrative of your application’s lifecycle and performance by correlating Kubernetes Events with metrics, distributed traces, and logs. By leveraging the power of your observability pipeline with Cribl Edge, filtering events and aggregating metrics allows your teams to easily add event-driven alerting on critical events to proactively identify and address potential issues before they impact your services and use dashboards to visualize and analyze the combined data from events, metrics, traces, and logs in a unified manner.
You can use the counter metric we created earlier and create a dashboard panel in a tool like Grafana to see events over time. The following PromQL query will aggregate the rate of each event within your namespace:
sum by (reason) (rate(kube_event_reason_total{namespace="demo"}[5m]))
Which will produce a graph that looks like the following:

Within the same dashboard, you can create alert rules for events like Evicted, FailedCreate, or FailedScheduling to inform your SRE or AppDev teams of deployment issues.
Wrap up
If you’re interested in Cribl Edge for Kubernetes monitoring, it’s time to try it out for yourself. We offer a Kubernetes Observability with Cribl Edge Sandbox, which guides you through installing Cribl Edge on a Kubernetes cluster using our Helm Charts. You’ll also learn how to configure sources for capturing logs and metrics generated by Kubernetes and your applications running in the cluster. Additionally, we’ve included pre-built dashboards in Grafana to help you visualize the data. Don’t hesitate to try it and see how it works for you.