
When monitoring your infrastructure, applications, users, devices, sensors etc. you’re likely to be using a variety of data sources and a number of monitoring tools to get the full picture. Oftentimes data is messy and chances are that you have instrumentation measurements embedded into log lines. That’s not necessarily a bad thing, but if you care principally about metrics those values can be extracted and send to a metrics store instead of a logging system. Metrics stores tend to be way leaner in terms of storage requirements and offer better analysis experience and vastly faster performance.
This is a no-frills, no-BS post on how you can use Cribl Logstream to visually author conversion of logs into metrics.

Let’s define a metric
A metric at its core is a record/event that contains a name, a value, a timestamp and one or more dimensions. The name is the name of the metric of interest, the value is its value at the given timestamp and dimensions represent metadata about the metric (i.e. groups that will be used to aggregate the values by). Here’s a meta-example:
timestamp:1565558300 | name:net.bytes | value:1024 | dimensions:OU=BigCo,Location=US,Region:us-east-1,AZ=us-east-1dSteps to convert logs to metrics
Extract fields of interest using Regex Extract or Parser functions.
Select fields that will become metrics and dimensions using the Publish Metrics function
Example with VPC Flow Logs
VPC Flow Logs capture information about the IP traffic going to and from network interfaces in your AWS VPC. Flow log data looks like this:
2 496698333333 eni-0538333333deafbeef 10.0.2.112 10.255.81.70 8000 41056 6 10 4133 1565552093 1565552110 ACCEPT OK…and it has this format:
version account_id interface_id srcaddr dstaddr srcport dstport protocol packets bytes start end action log_statusLet’s assume that we have a requirement to extract bytes and packets as metrics at the time as indicated by value of start field (this is the field that Cribl LogStream uses to assign _time to these events) and across all other fields as dimensions, except for start and end. Let’s also assume that these metrics are then output to a Splunk metrics index.
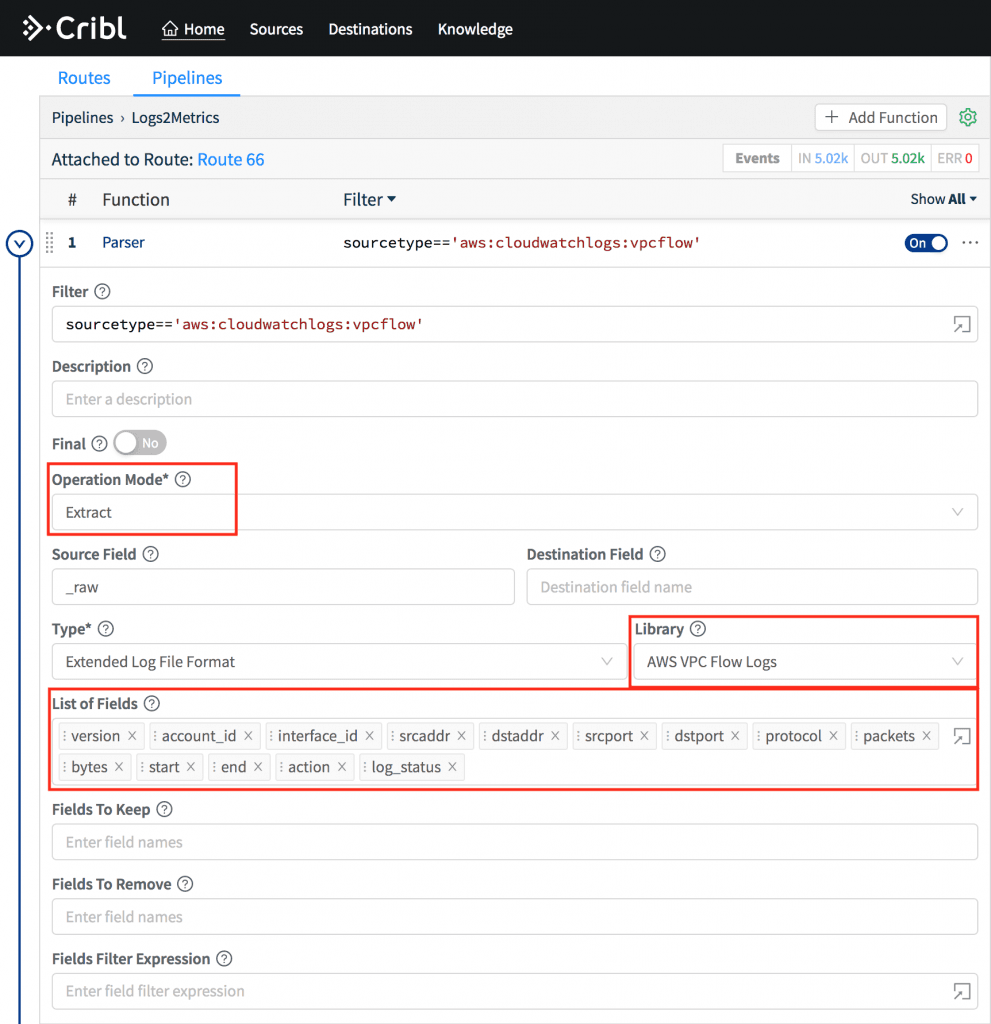
Use the Parser function in Extract mode and select AWS VPC Flow Logs from the Library dropdown. This will automatically extract all fields above.
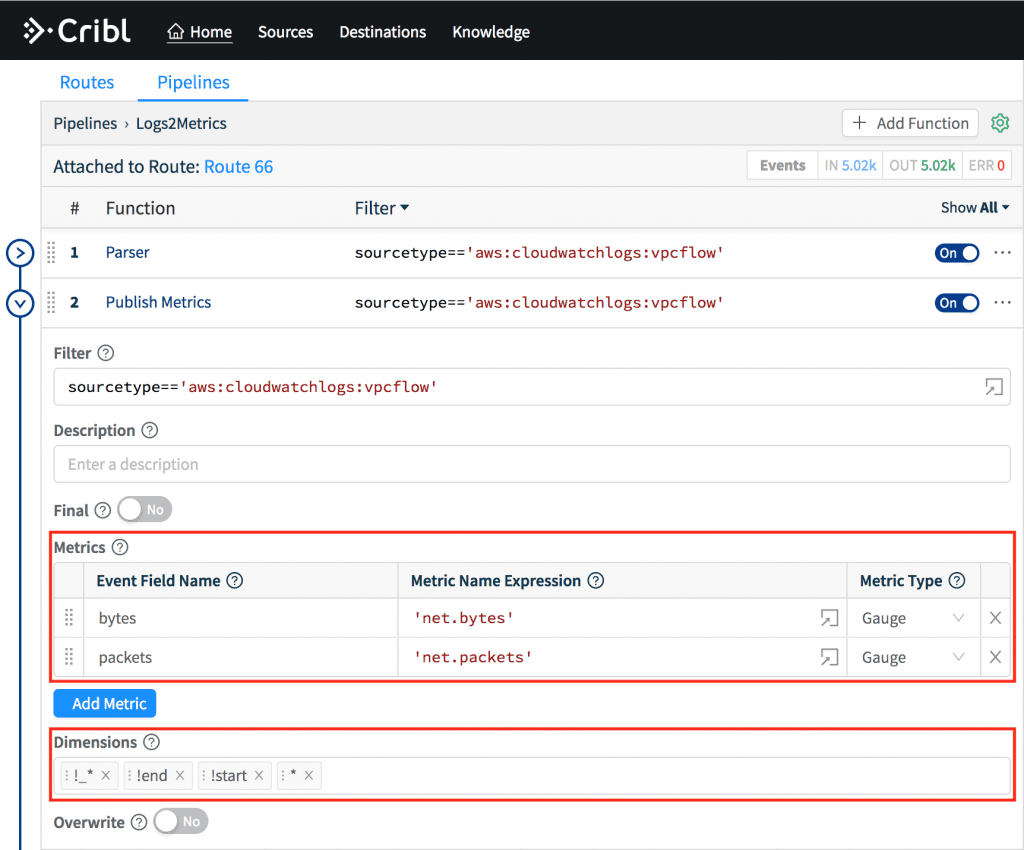
Next, use the Publish Metrics function to select metrics and dimensions. Under Metrics map event name called bytes to
'net.bytes'and packets to'net.packets'. Under Dimensions ensure you have the following Wildcarded List:!_* !end !start *– which basically means create dimensions out of all fields except for those start with _ (underscore), end and start.
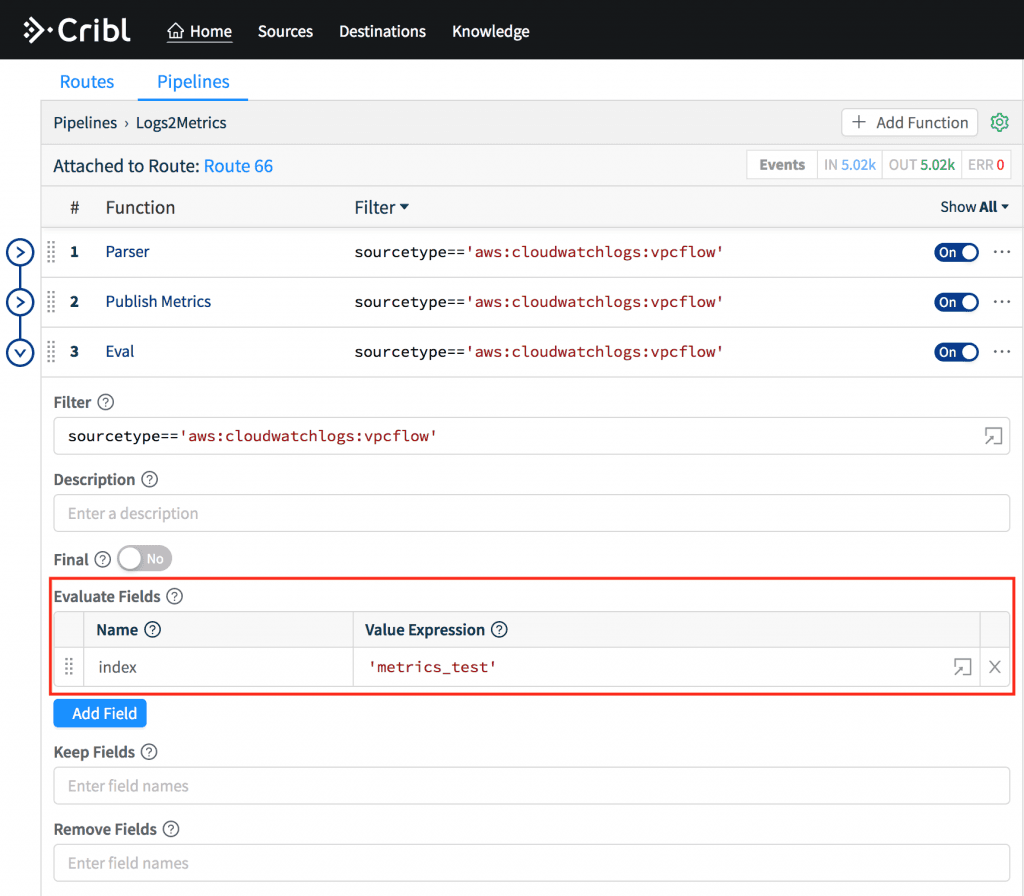
Lastly, use the Eval function to set a field called index to
'metrics_test'. This is a metrics index in Splunk and may not be necessary for other destinations.
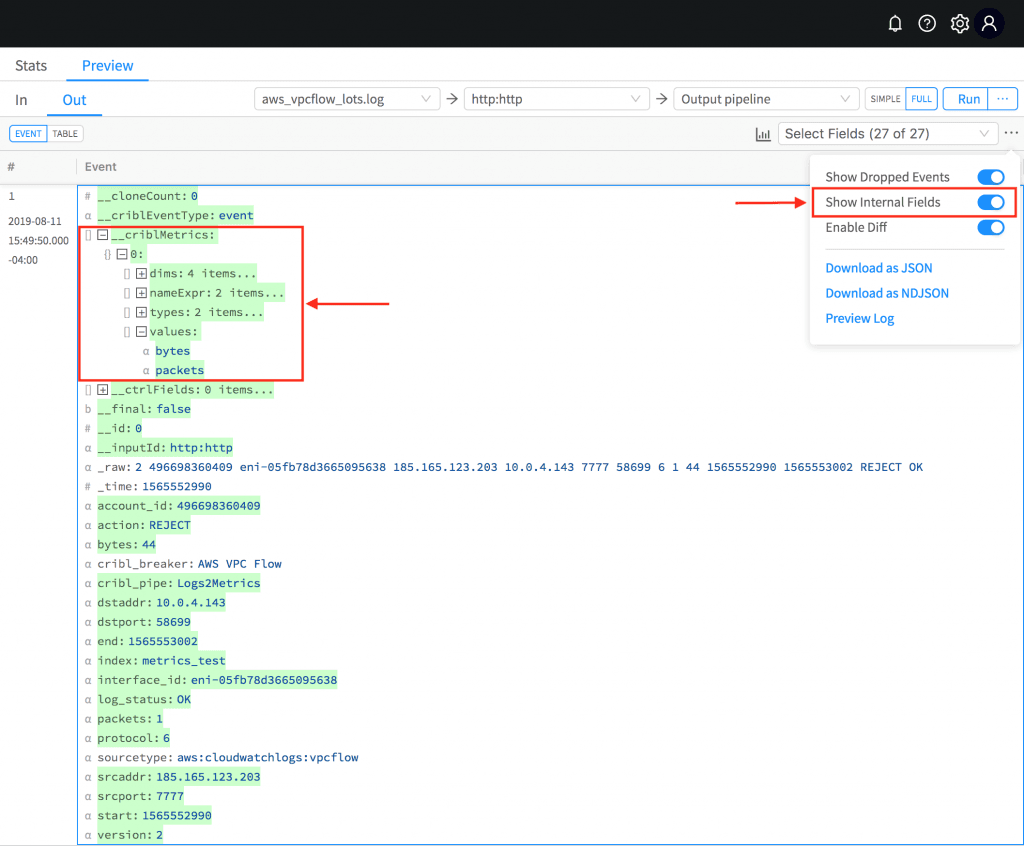
To confirm in Preview toggle Show Internal Fields and navigate the __criblMetrics field hierarchy. Note that this field represents the necessary and sufficient information that the output uses to format the metric event depending on the type of destination. For example – a metric sent directly to Splunk has a different wire protocol representation than one sent via statsd or graphite.
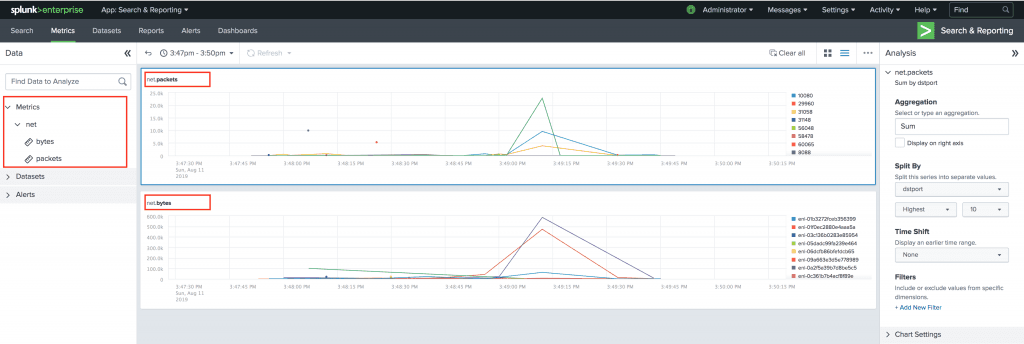
To confirm in Splunk, go to the Metrics Workspace and navigate on the left-hand side – you should see net > bytes and net > packets as available fields under Metrics.
That’s it!!
If you’d like more details on how to get started, head over to our documentation or join us in Slack #cribl, tweet at us @cribl_io, or contact us via hello@cribl.io. We’d love to help you!
Enjoy it! — The Cribl Team