As a big proponent of open source and all things open, I jumped at the opportunity to expand on Cribl Stream’s OpenTelemetry implementation. I’m happy to report that as of Cribl Stream 4.1, both our OpenTelemetry source and destination now support OTLP over HTTP!
Being the leader in the observability pipeline space means that we are constantly keeping an ear to the ground of what’s happening in the space. And when we hear of an open protocol that promises to be the ubiquitous language for observability data, you know we’re going to listen. The OpenTelemetry Source and Destination have been available in Cribl Stream since version 3.2, but that doesn’t mean we’re going to stop iterating on the implementation, especially as the protocol itself continues to evolve and materialize.
Let me demonstrate how we can leverage Stream’s OpenTelemetry destination to monitor your applications in New Relic.
Cribl Stream Setup
Source
We first want to make sure we get our OpenTelemetry data into Stream. Leveraging the OTel Java Instrumentation within a sample application can get us up and running pretty quickly! (See more OTel SDK options here).
In Stream, the configuration to bring in this data will look like so:
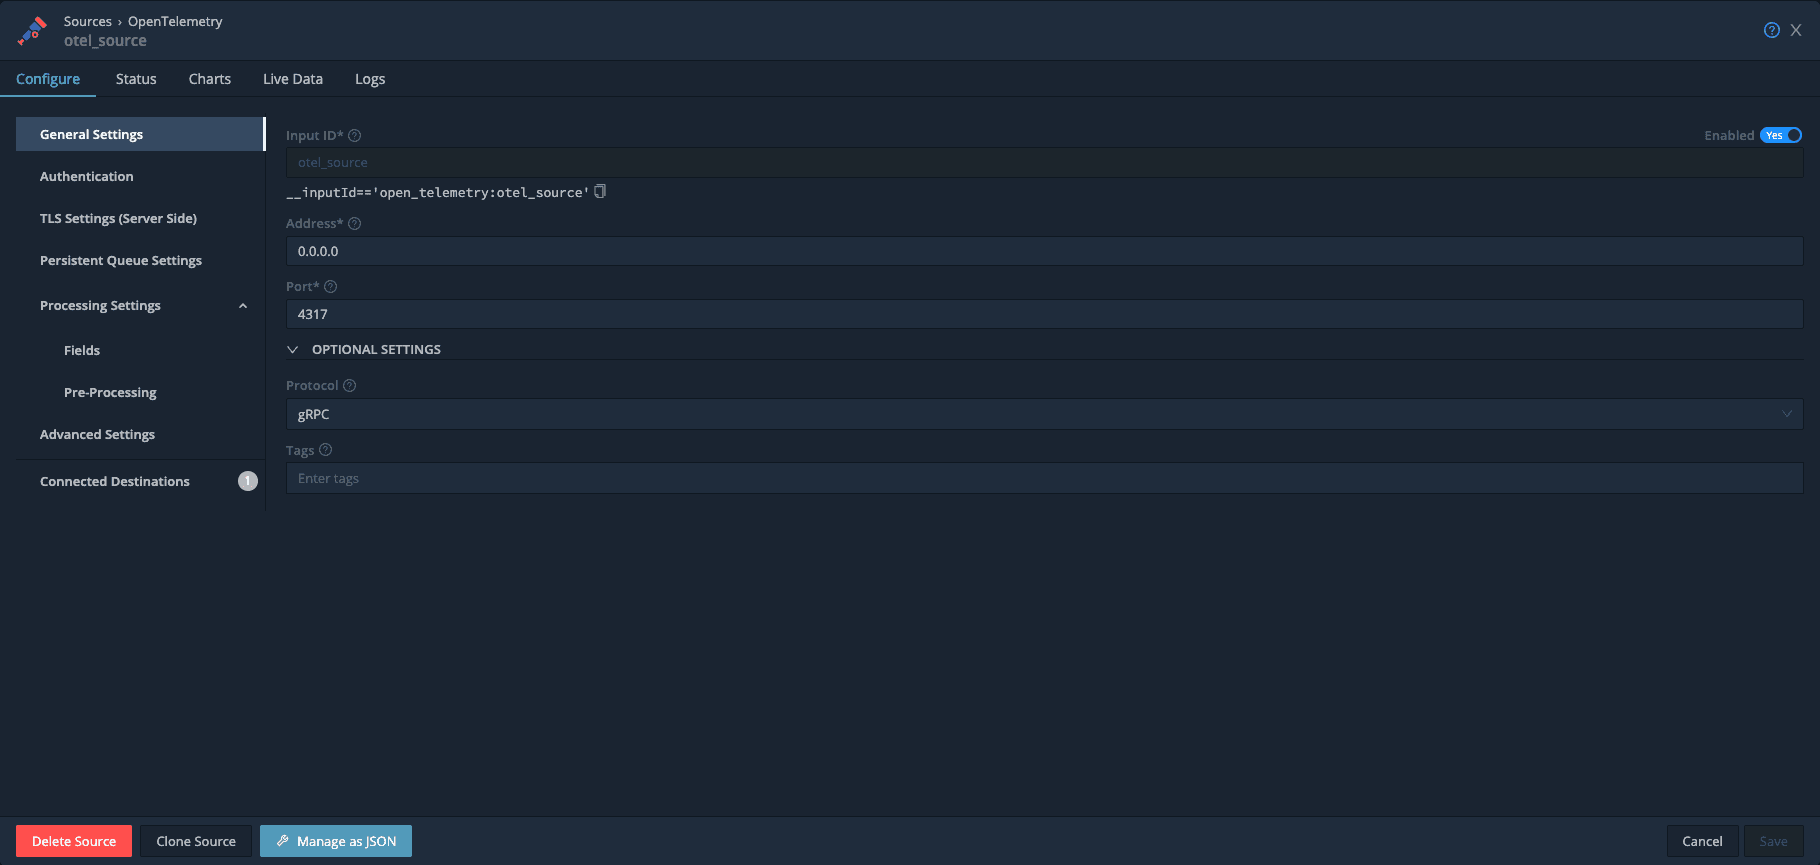
Note that while we want to export our OTel data over HTTP, we can bring the data in over gRPC, just to demonstrate that Stream can seamlessly translate between the 2 protocols!
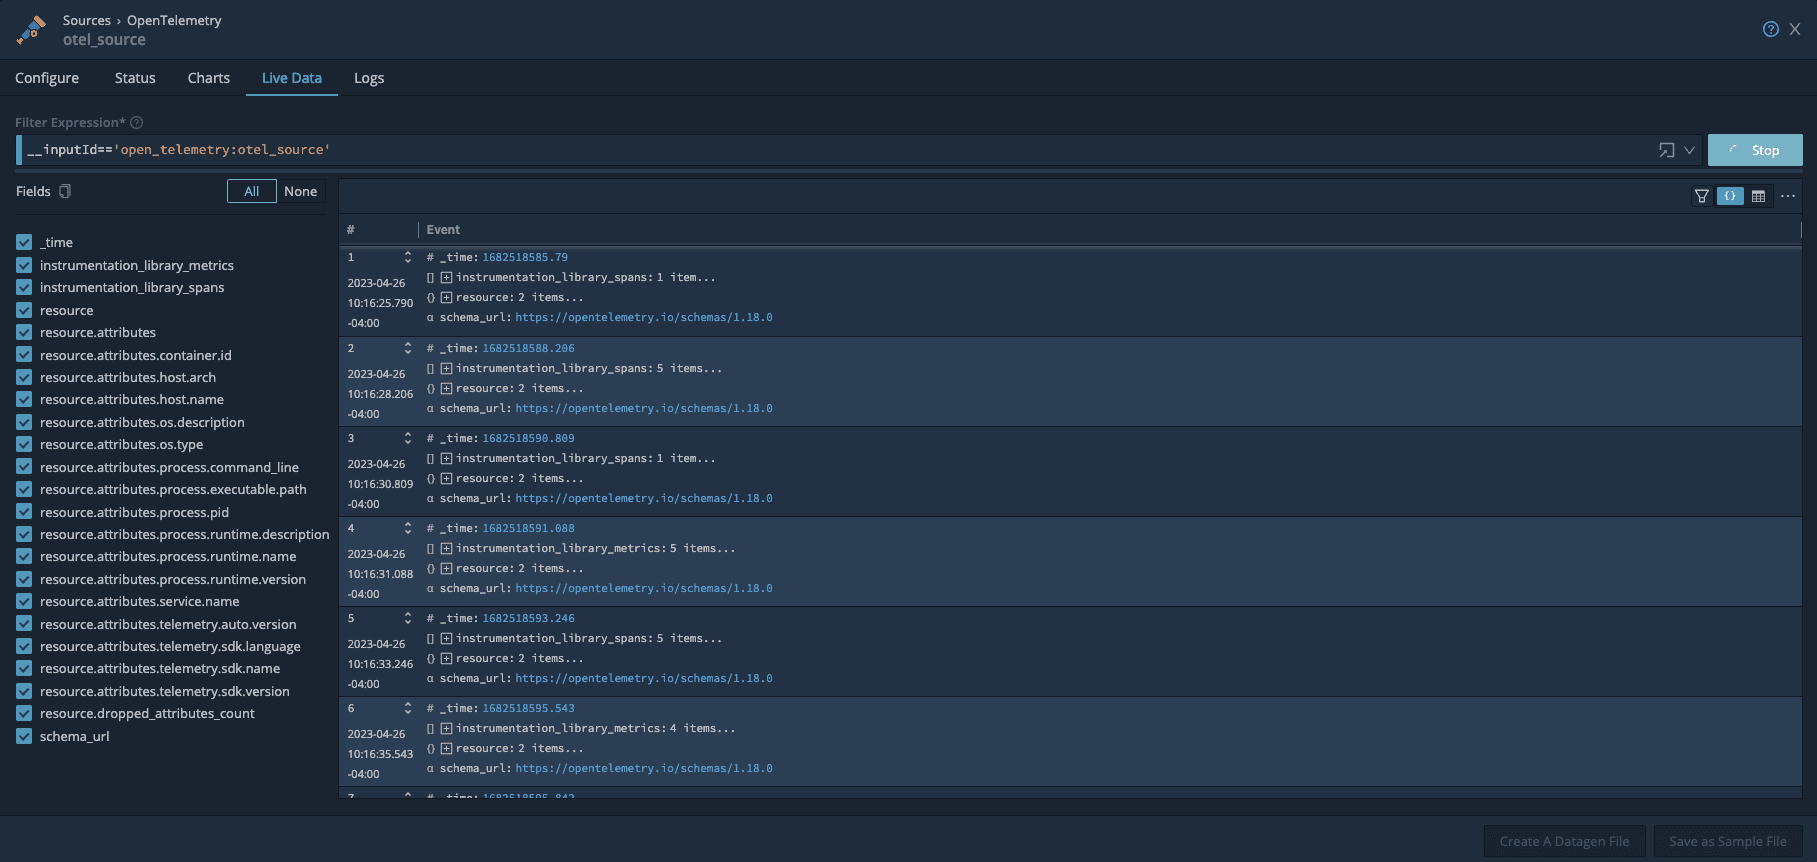
To make sure that our data is coming into Stream properly, we can view the Live Data tab and watch as the metrics and traces flow in!
Destination
Endpoint: `https://otlp.nr-data.net`
Protocol: HTTP
To send your OTel data to New Relic, configure a Destination to look like the following:
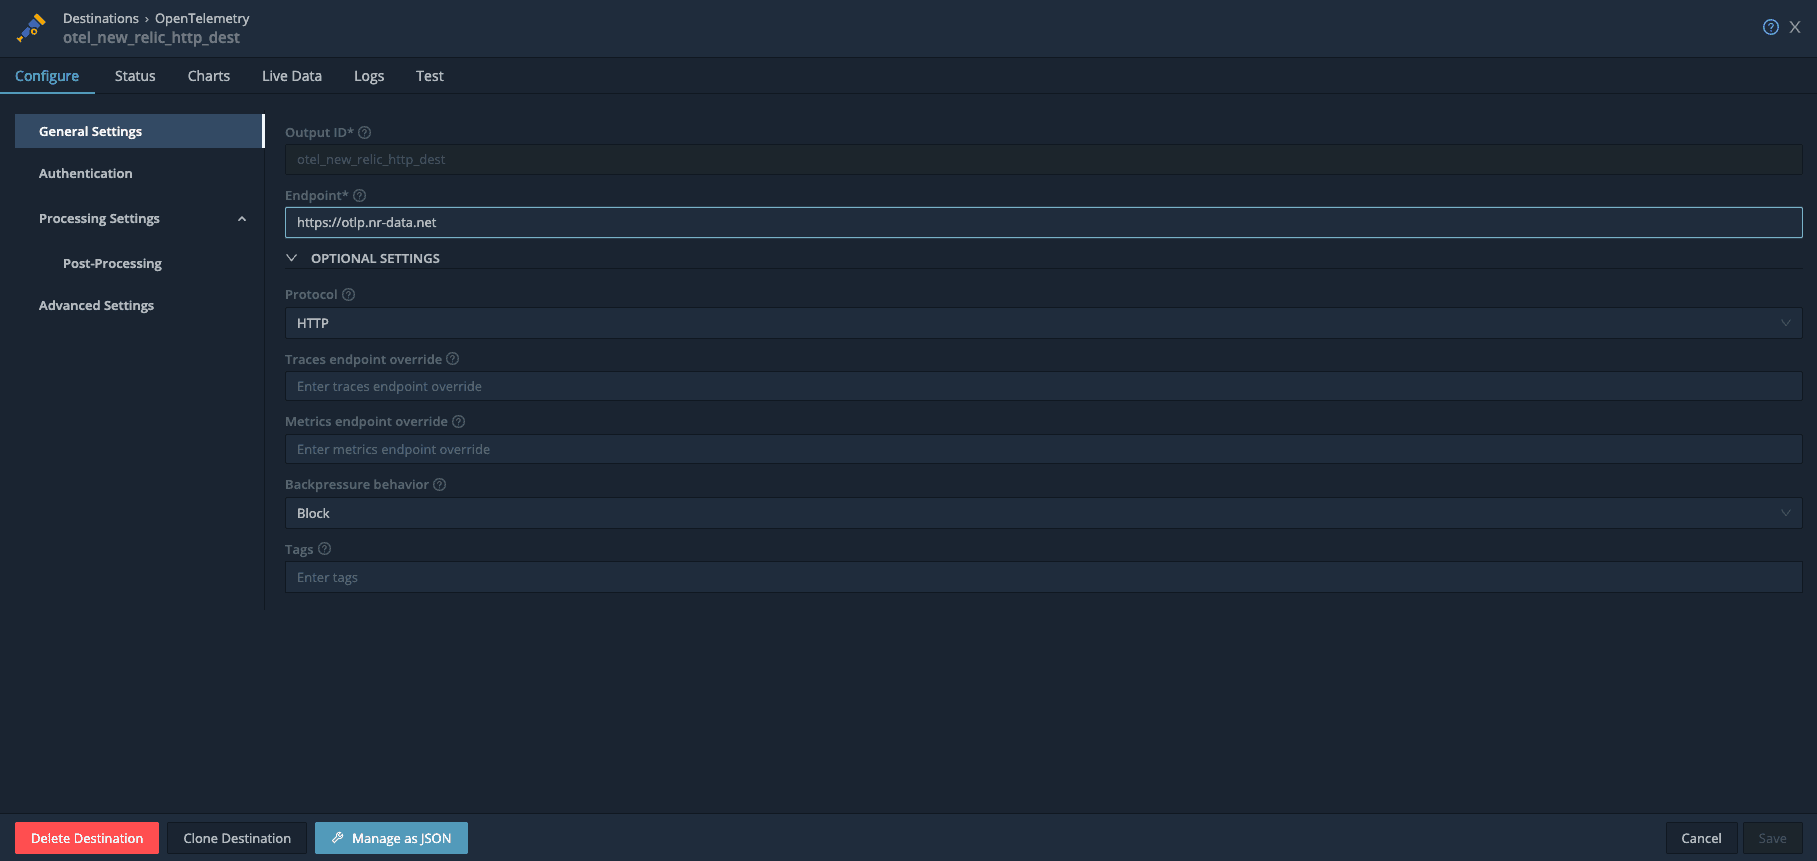
Note that as per the New Relic documentation, they require HTTP Headers for authentication. Those can be found under Advanced Settings:
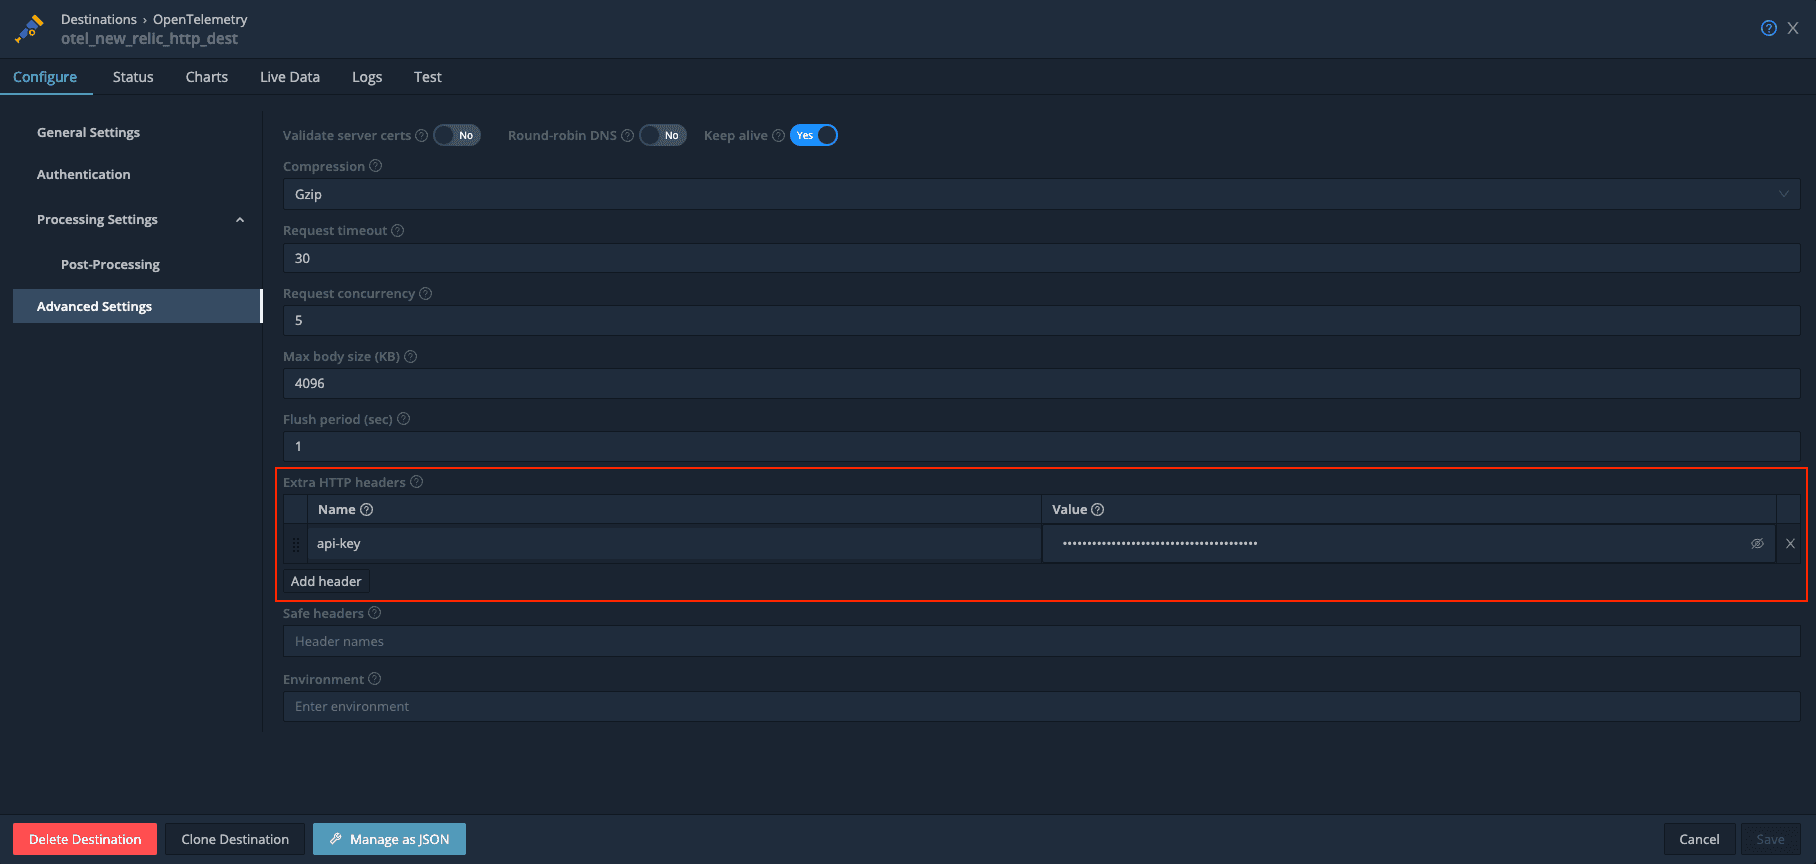
Be sure to input your New Relic API key, found here.
Connection
Once you have your Source and Destination setup, be sure to connect the 2 using either Routes, or the nifty QuickConnect tool.
After a minute or so, you should be able to check the Logs of the OpenTelemetry destination and confirm that you see no errors.
Optional Configurations
The OpenTelemetry source in Stream gives users the additional option to extract spans and/or metrics out into individual events. This will allow you to have more granular control over each individual span and metric flowing through the system. You can find this option under the Advanced Settings tab.
Additionally, leveraging Stream’s infamous pipeline functionality enables you to adjust traces or metrics as you see fit. This can include the ability to drop certain events that you don’t care about, adjust some numbers along the way, or even enhance the events with more data!
End-to-End
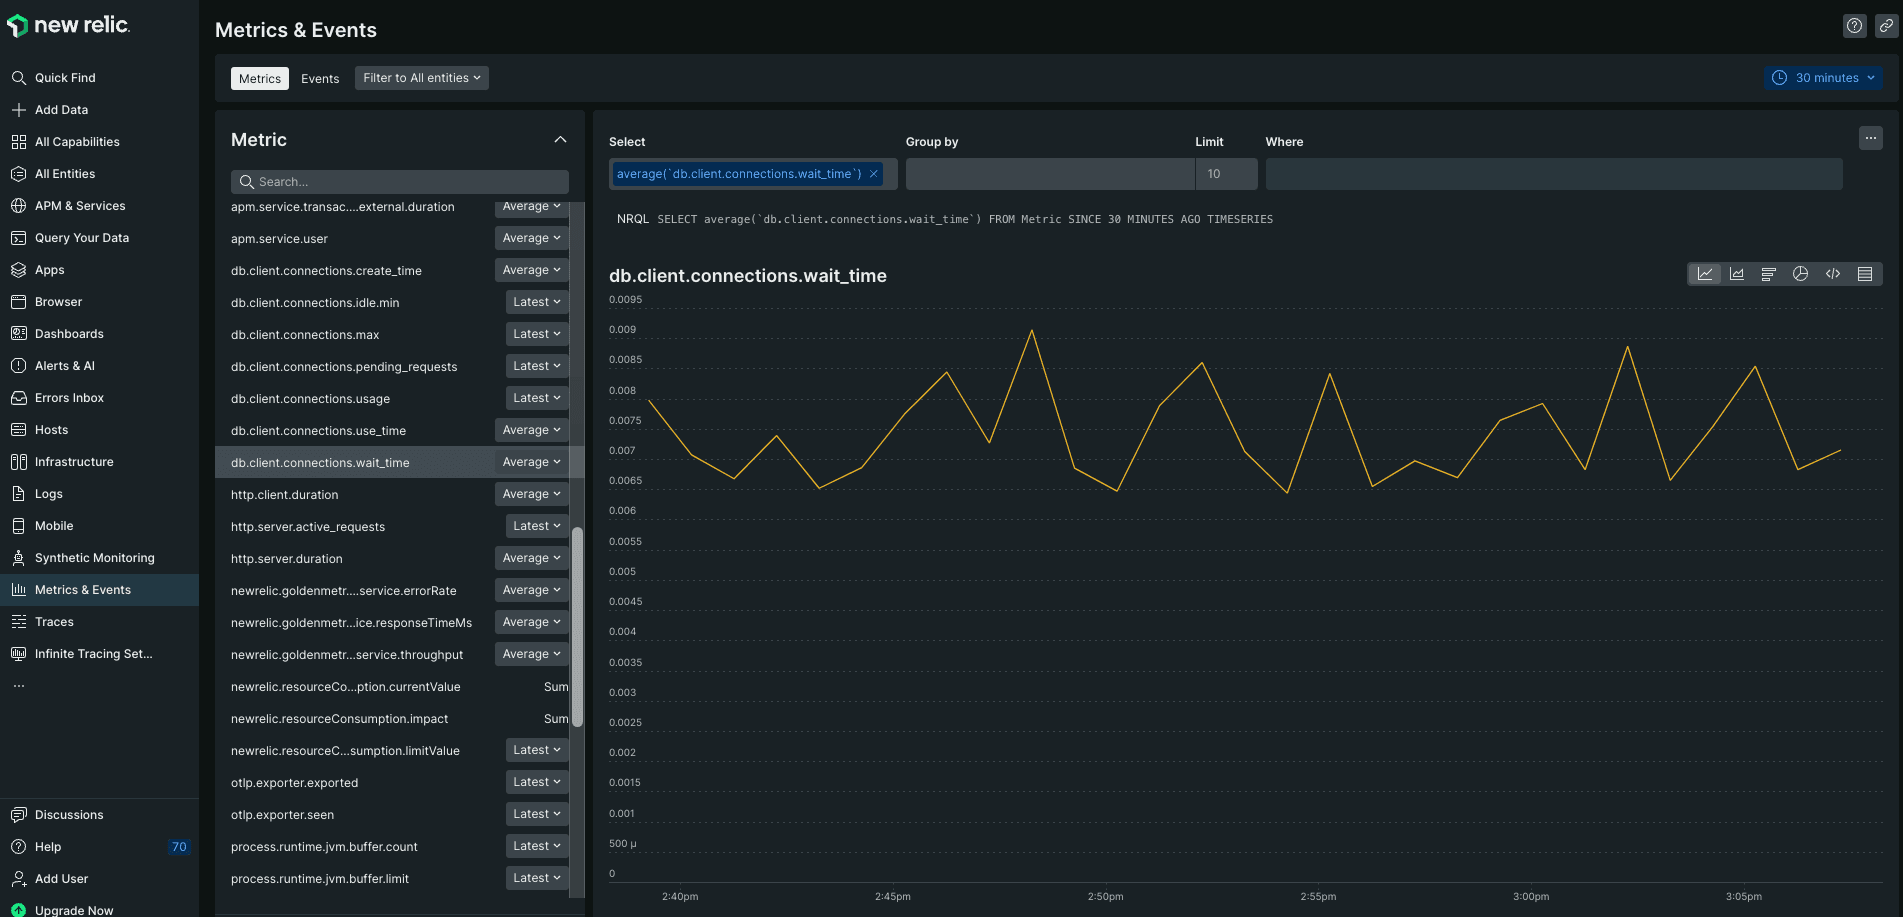
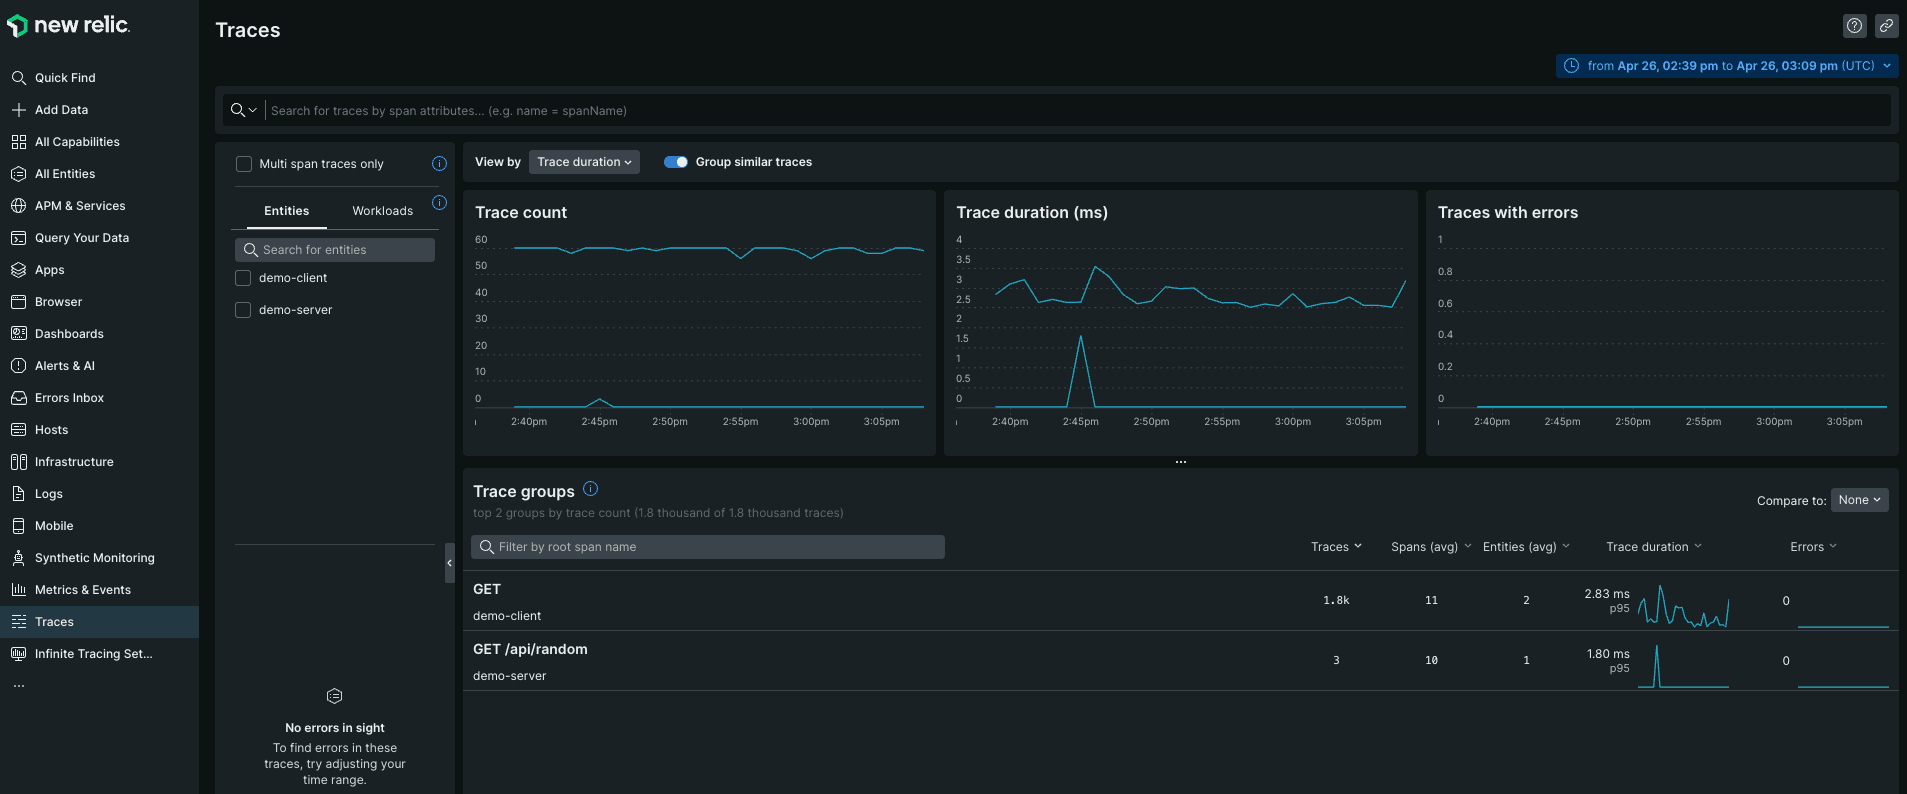
Once your application has been streaming OpenTelemetry data for a few minutes, we can log in to our New Relic dashboard and view our metrics and traces!
Wrapping Up
Today, we learned how to monitor your applications using OpenTelemetry over HTTP and New Relic. As with any Stream setup, we were able to set up the entire configuration in mere minutes! With the increasing adoption of OpenTelemetry by more and more services, imagine how quickly you’ll be able to send your telemetry data anywhere you’d like, with minimal overhead


