The Batch Processor in the OpenTelemetry project is used in both the SDKs and the OpenTelemetry Collector. What exactly is this processor, and what does it do? And, how can you use the OTLP Logs, OTLP Metrics, and OTLP Traces Functions in Cribl Stream and Cribl Edge to build batches like a boss?
What is the OpenTelemetry batch processor?
The README for the batch processor says:
The batch processor accepts spans, metrics, or logs and places them into batches. Batching helps better compress the data and reduce the number of outgoing connections required to transmit the data.
That sounds pretty straightforward, right? Compressed data and fewer connections means less data being sent across the network, especially useful if you pay for every byte of egress traffic. However, it does not mean less data on disk when a batch of OpenTelemetry Signals land at their destination, and the size difference of data on disk vs. on the wire does not depend only on compression!

Building a Better Batch
When Cribl decided to include the ability to extract batched OpenTelemetry Signals in the OpenTelemetry Source, we did so to make it easy to get the right data to the right place at the right time. While batches may be efficient at the network level, nested JSON objects are a nightmare to manipulate, sample, enrich, redact, etc. There is a reason that the OpenTelemetry project recommends placing their batch processor after any sampling takes place!
With a stream of individual Logs, Metrics, and Span/Trace pairs extracted from a batch, processing individual events within a Pipeline using a variety of Functions is easier to build. To reassemble batches or, more correctly, to assemble new batches required that we add new capabilities to the OTLP Logs, OTLP Metrics, and [OTLP Traces] Functions. The OTLP Logs and Traces Functions support OTLP in and OTLP out (as of v4.7.2), whereas the OTLP Metrics Function supports both OTLP in and OTLP out while also supporting the conversion of dimensional metrics (like Prometheus metrics) to the OTLP Metrics format.
This is where building a better batch comes into play! Every OTLP Signal includes a set of attributes called Resource attributes that describe the source of the telemetry. The OpenTelemetry SDK spec says:
A Resource is an immutable representation of the entity producing telemetry as Attributes.
The sending entity can be an application sending Traces via an SDK, or it can be Metrics from a Kubernetes cluster or host OS, both will include unique attributes as defined by Resource Semantic Conventions.

How Does Cribl Help Me Batch Like a Boss?
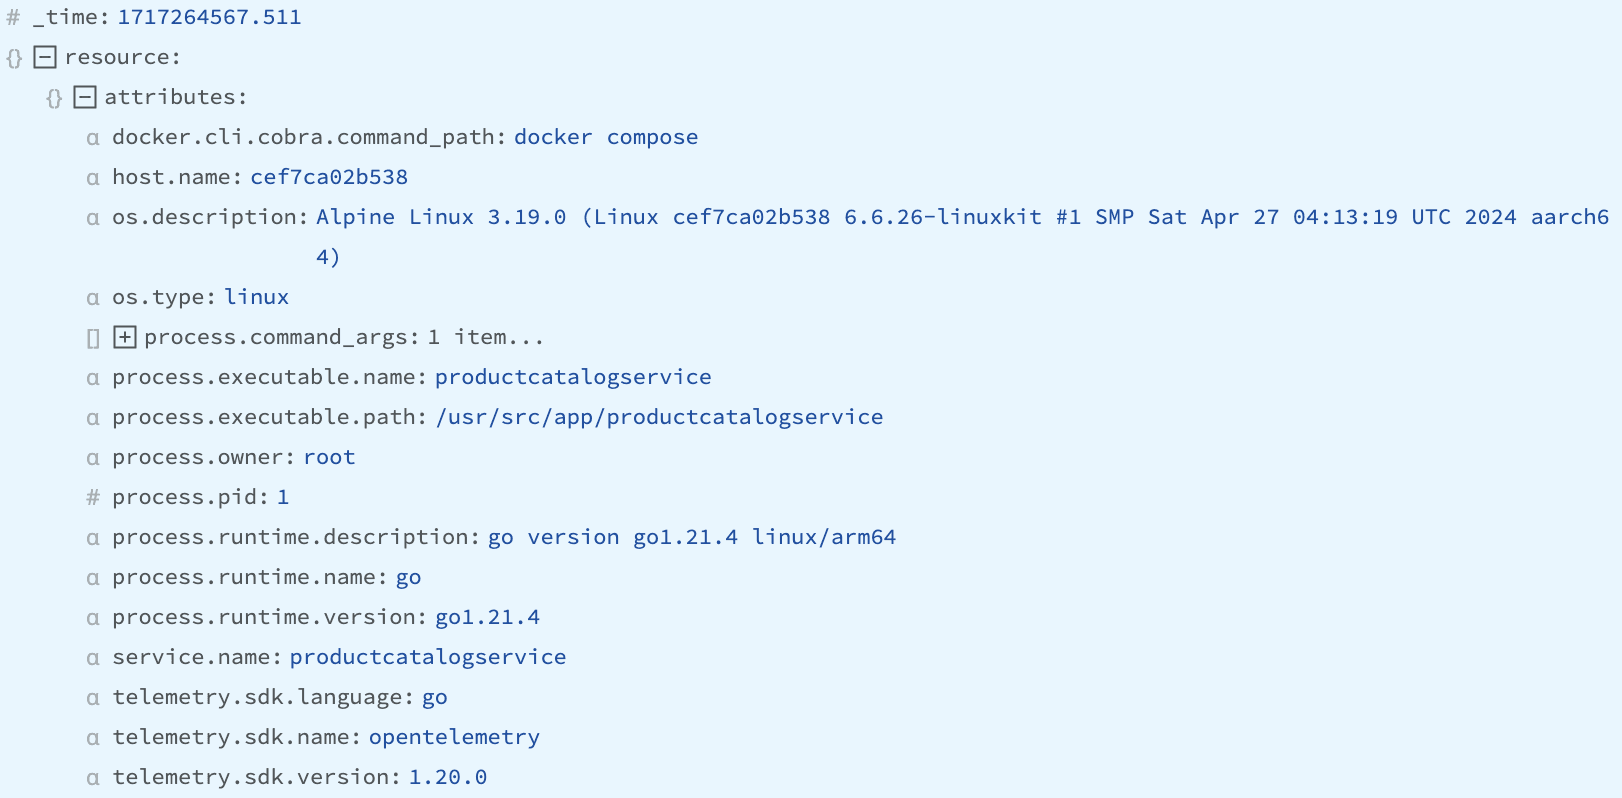
A batch of OTLP Spans might have a set of Resource attributes that looks like the telemetry below. The view comes from Cribl’s Data Preview capability, which is available when working to build a Pipeline. Think “test as you build, not as you deploy” for telemetry pipelines.

While the OpenTelemetry SDK specification does say that Resource attributes are immutable, there is leeway in the specification for host, docker, os, and process attributes. This is very important when you consider the value of the os.description, which clocks in at 118 bytes and, when repeatedly ingested across thousands or millions of spans, results in a lot of duplicate data with very little value. Do you need the kernel build date and time written across thousands of attributes?
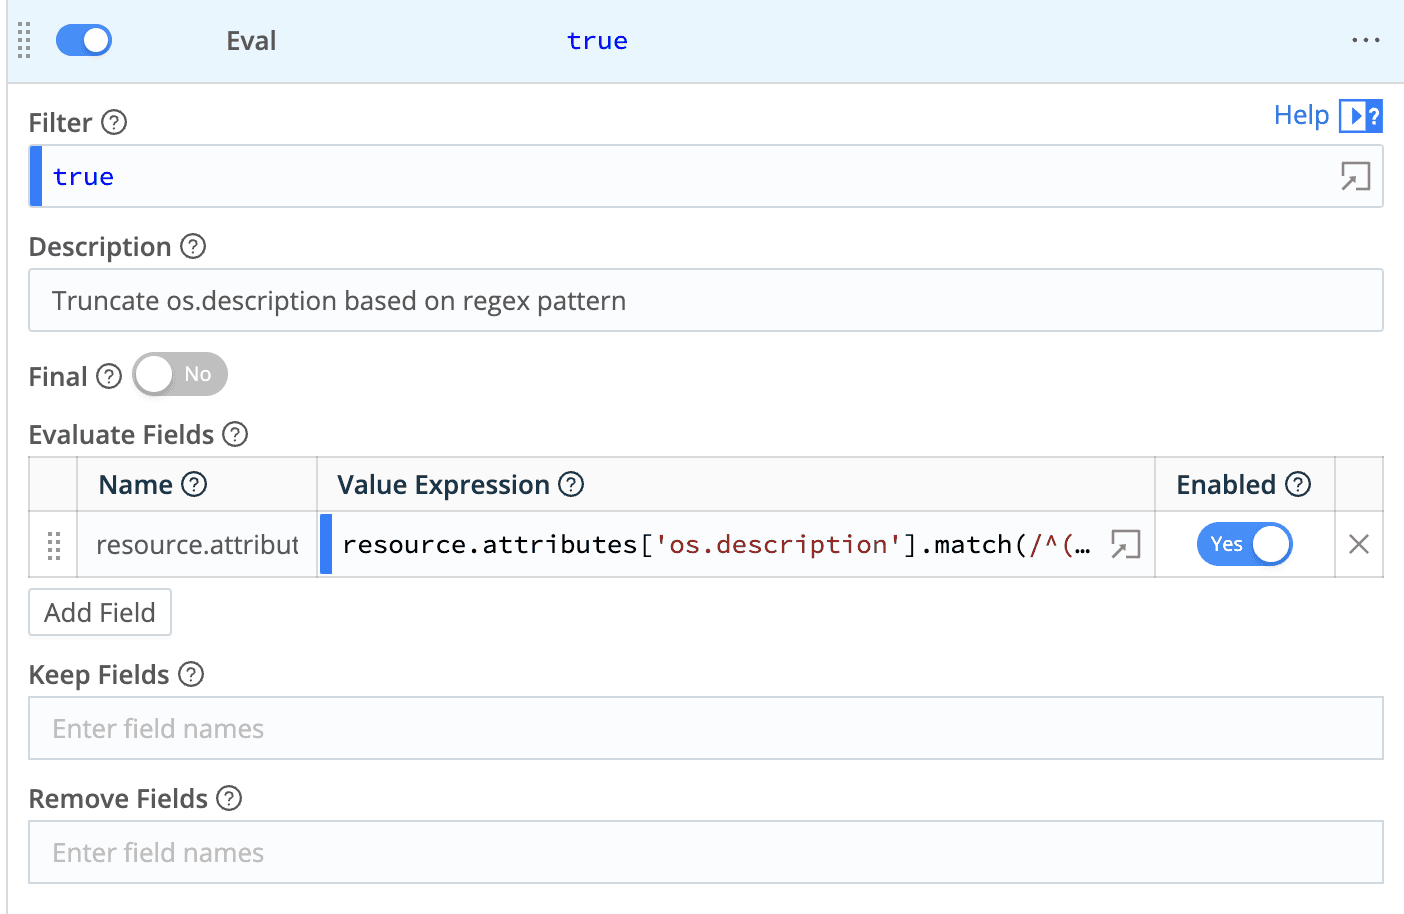
Remember that batch only changes the size of the telemetry on the wire by deduplicating common Resource attributes across a group of OpenTelemetry Signals. To batch like a boss, you must do more than simply batching. Using Cribl’s Eval Function, we can truncate the description to Alpine Linux 3.19.0 and cut the size to 37 bytes. With the updated value, when you batch events using Resource attributes, you get the advantage of the batch for data on the wire and the savings of an optimized Resource attribute value when the batch is written to disk (and likely expanded into individual events, too!).

JSON snippet of the Eval Function
{

"filter": "true",

"conf": {

"add": [

{

"name": "resource.attributes['os.description']",

"value": "resource.attributes['os.description'].match(/^(.*?Linux\\s\\d+\\.\\d+\\.\\d+)/) ? resource.attributes['os.description'].match(/^(.*?Linux\\s\\d+\\.\\d+\\.\\d+)/)[0] : resource.attributes['os.description']"

}

],

"remove": []

},

"id": "eval",

"description": "Truncate os.description based on regex pattern"

}
Be an OpenTelemetry Batch Boss

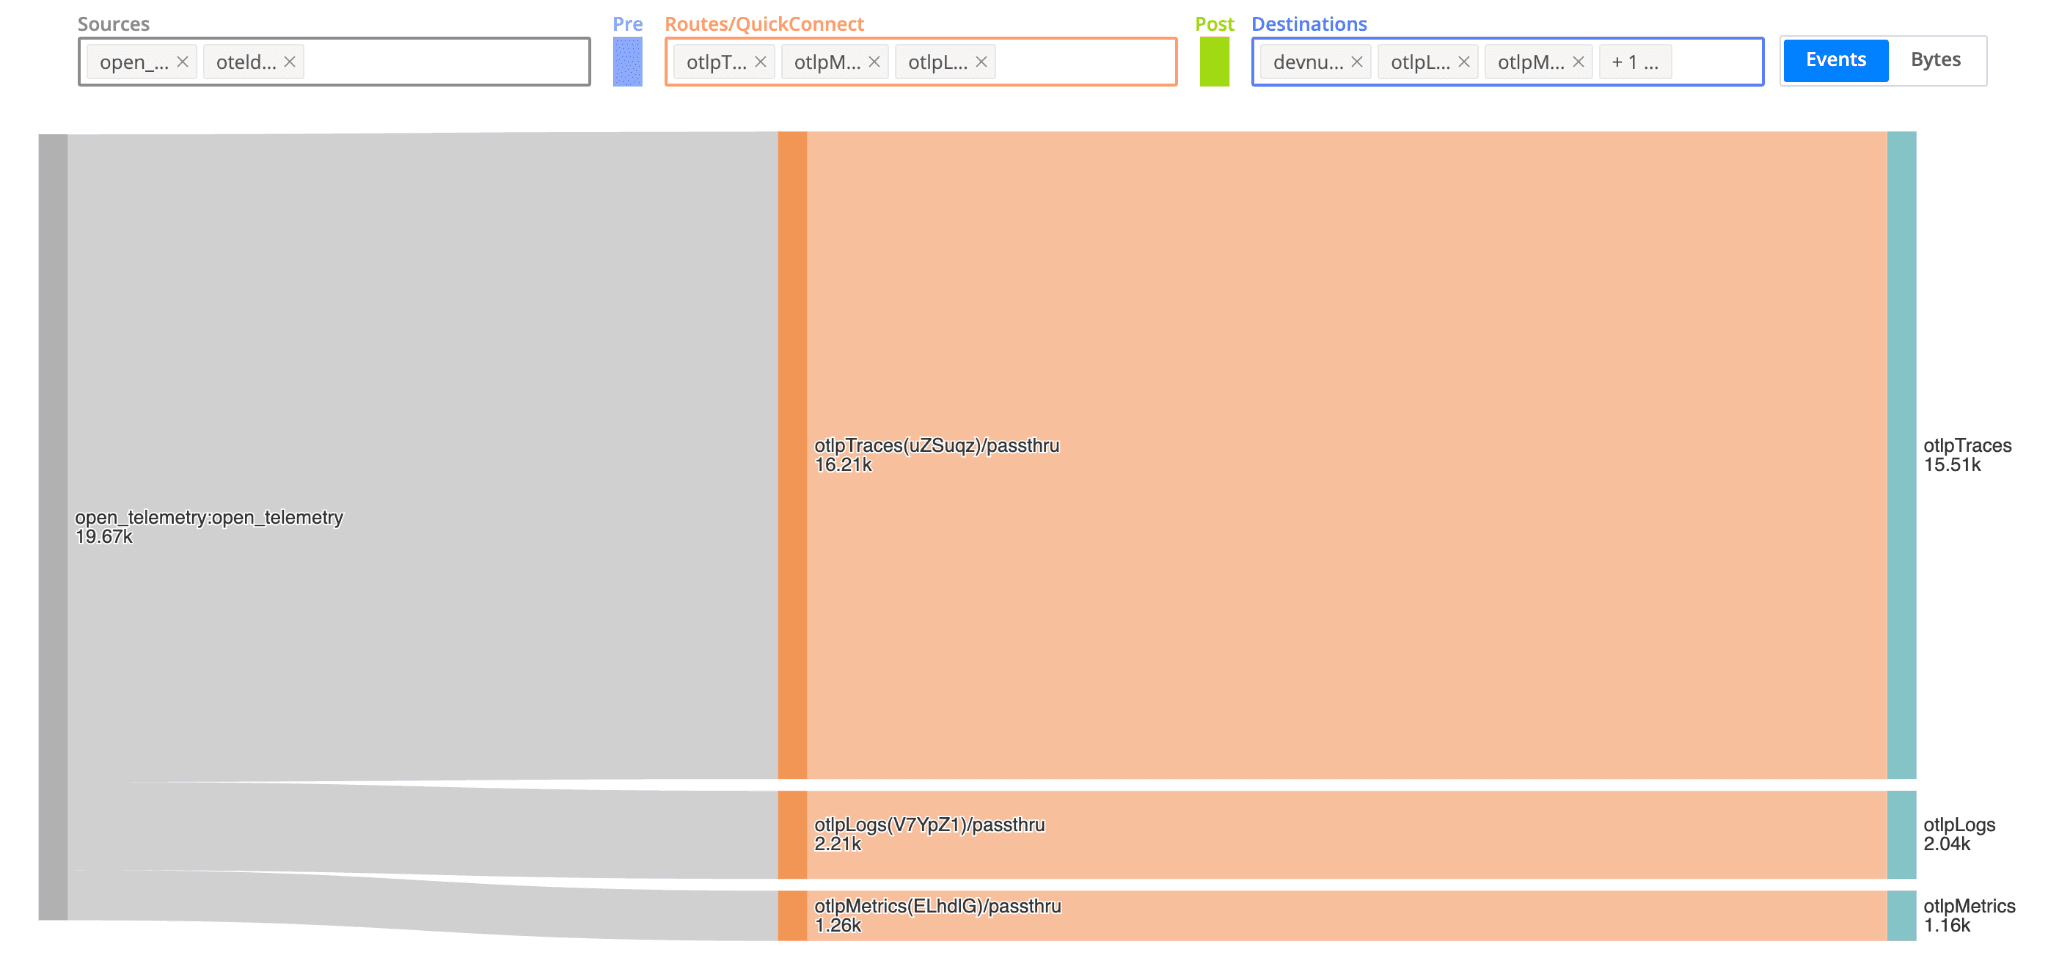
In my simple OpenTelemetry Demo environment running 10 users via Locust loadgen, I saw 87.48MB in 15.51K events sent to Cribl Lake in 1 hour. Trimming just 37 bytes is a 0.65% reduction in volume, but using the same logic on process.runtime.description and other fields, you can easily push that savings to 2.5% for strings that offer little to no value to your observability journey.
Now the question is, “What would you do with 2.5% savings in your telemetry budget?”

Ready to Get Started?
Cribl, the Data Engine for IT and Security, empowers organizations to transform their data strategy. Customers use Cribl’s suite of products to collect, process, route, and analyze all IT and security data, delivering the flexibility, choice, and control required to adapt to their ever-changing needs.
We offer free training, certifications, and a free tier across our products. Our community Slack features Cribl engineers, partners, and customers who can answer your questions as you get started and continue to build and evolve. We also offer a variety of hands-on Sandboxes for those interested in how companies globally leverage our products for their data challenges.


