
You’re responsible for administering hundreds to thousands of server endpoints deployed at your company. You receive daily requests from the application teams requiring agents be installed on new servers, from the compliance team tracking agent upgrades and from the operations team concerned logs and metrics are missing from the dashboards they’re monitoring. You review your workload and realize you must log into each individual server for every request you’ve received. Sound familiar? You likely know it’s time to learn how to streamline endpoint data collection.
Cribl Edge simplifies agent administration and data collection for endpoints. While we’ll touch on agent installation in this blog, we’ll primarily focus on configuring the agents to collect and send data to the required destination(s). From within the Cribl Leader UI, we’ll collect System Metrics from our servers, and route the data to Grafana Cloud’s managed Prometheus for monitoring.
Configuring Data Collection on Cribl Edge
If you’re familiar with installing Cribl Stream Workers, connecting Edge nodes is just as easy! Generating a bootstrap script from the Leader UI allows you to quickly install the Edge agent on an endpoint and map it to the appropriate Fleet. Once the agent is installed, Cribl gives end users the ability to manage source and destination configurations for all Edge Nodes in a fleet from a single location.
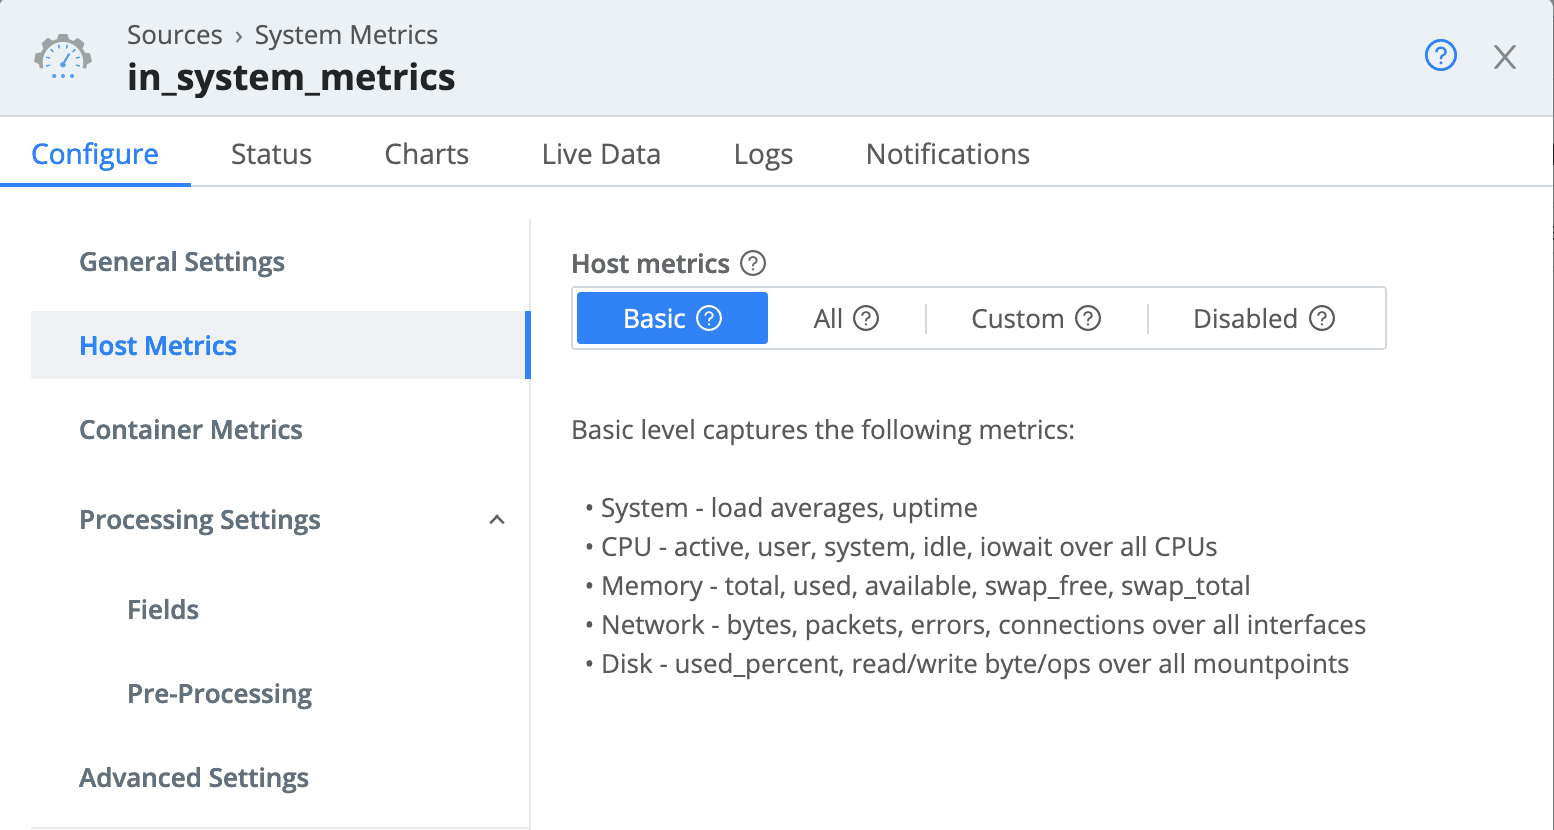
Once you have Edge nodes up and running, navigate into your fleet and select More → Sources → System Metrics. The General Settings will be configured in the default input, however, you can define the level of granularity for the metrics that are collected for both host and container infrastructure. Any changes to the configurations will require a Commit and Deploy for the Edge agents to receive the latest config bundle.
Once enabled, logs and metrics generated at the endpoint can be sent directly to a destination or to your existing Cribl Stream Worker groups to process more complex transformations. Because we are sending metrics that require minimal processing, we’ve chosen to route them directly to Grafana Cloud. If you’re interested in a use case to send data from Cribl Edge to Cribl Stream additional information is available within our docs.
Configuring Grafana Cloud to Streamline Endpoint Data Collection
After confirming metrics data is being collected on the servers, you’ll need to configure a Grafana Cloud environment to be used as the Destination. If you don’t have an existing API Key for publishing metrics, you’ll need to create one within your Grafana Cloud Portal.
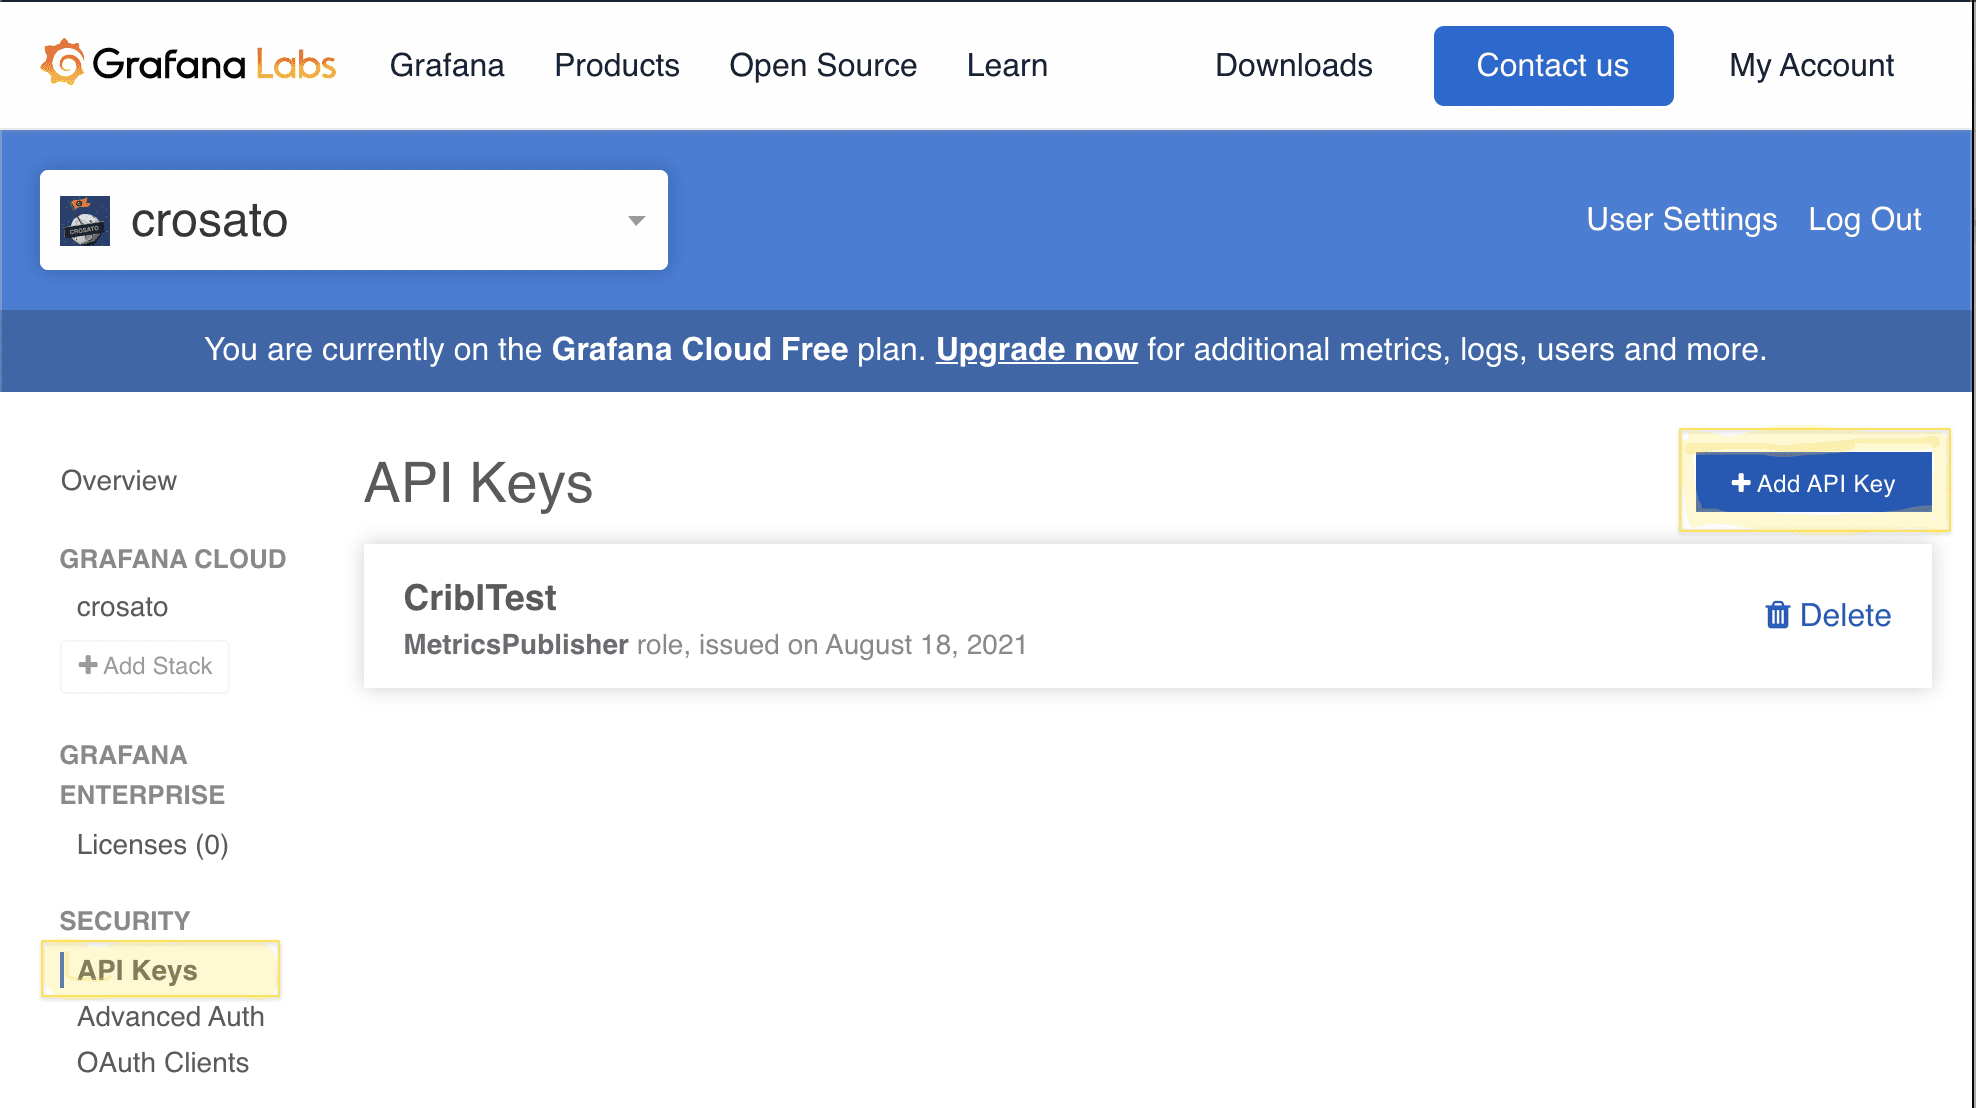
On the left navigation pane, select API Keys and then +Add API Key in the upper right corner. Give your API Key a name and select the MetricsPublisher Role. Clicking Create API Key will generate your key. Be sure to write it down, as this will be the only time you can access it.
After the API Key is created, you’ll need to determine the credentials (Username and target URL) to send metrics to the Prometheus service. You can follow similar steps to configure the Loki endpoint to receive logs as well.
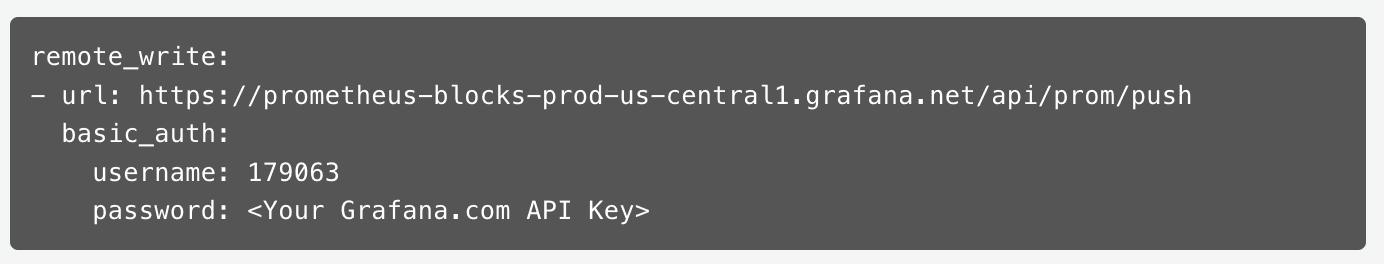
First Navigate back to the home page by clicking Overview in the left navigation pane. Then select Send Metrics on the Prometheus service panel. From the Prometheus configuration page, take note of the following attributes, as we will use them to define the Grafana Cloud destination within Stream: URL, User, Password.
Configure the Route
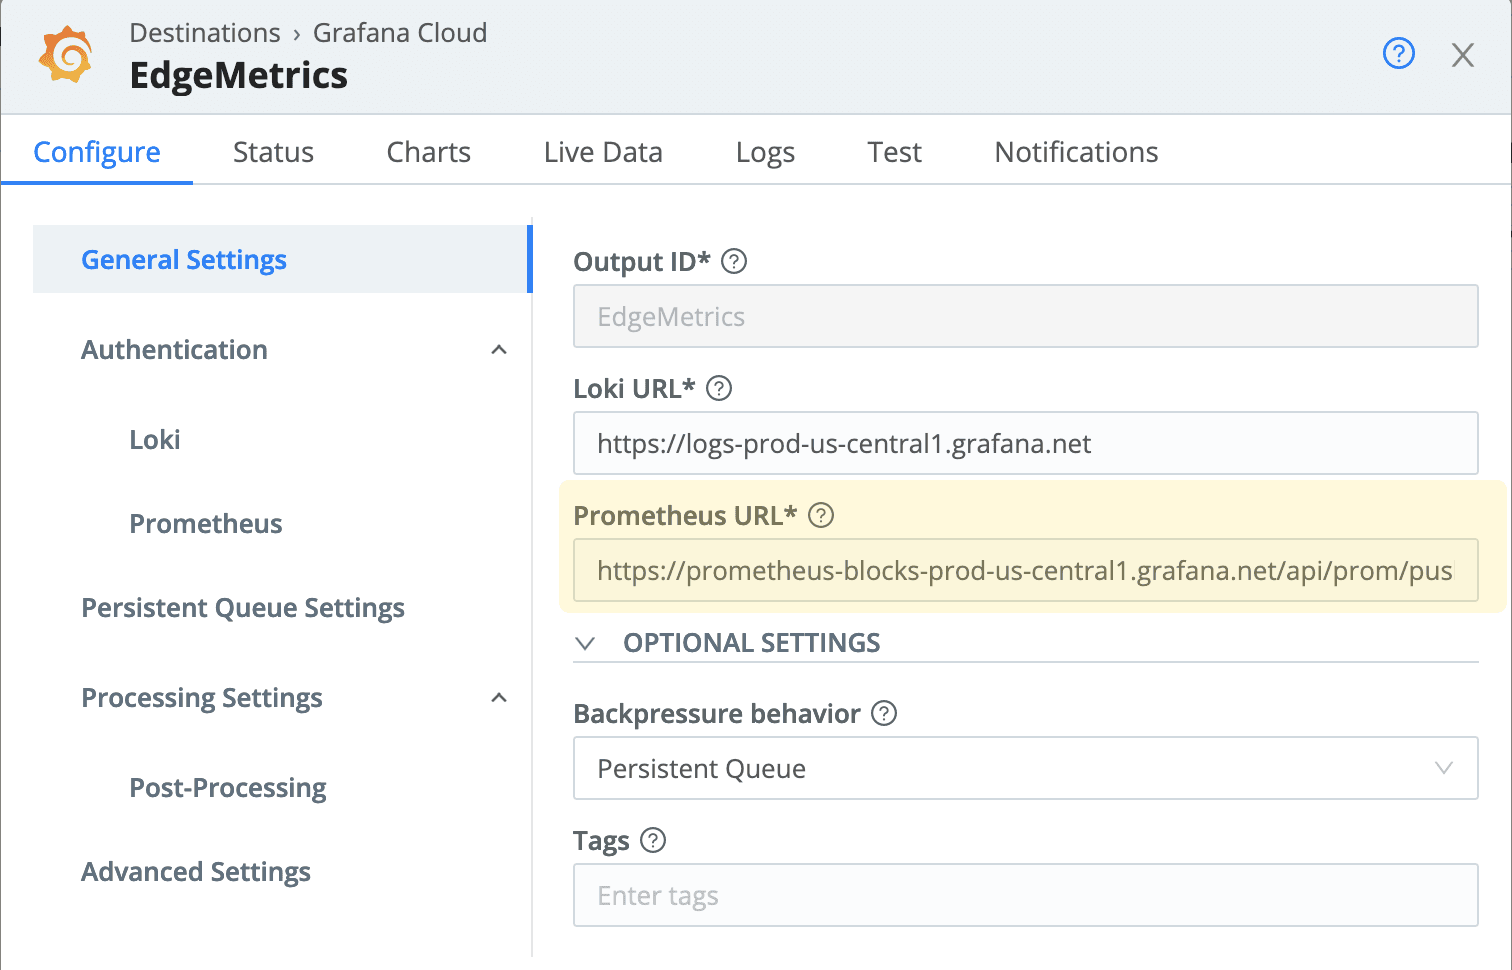
We now have all the information we need to configure the Grafana Cloud destination. Switching back over to Edge, navigate to More → Destinations and search for Grafana Cloud.
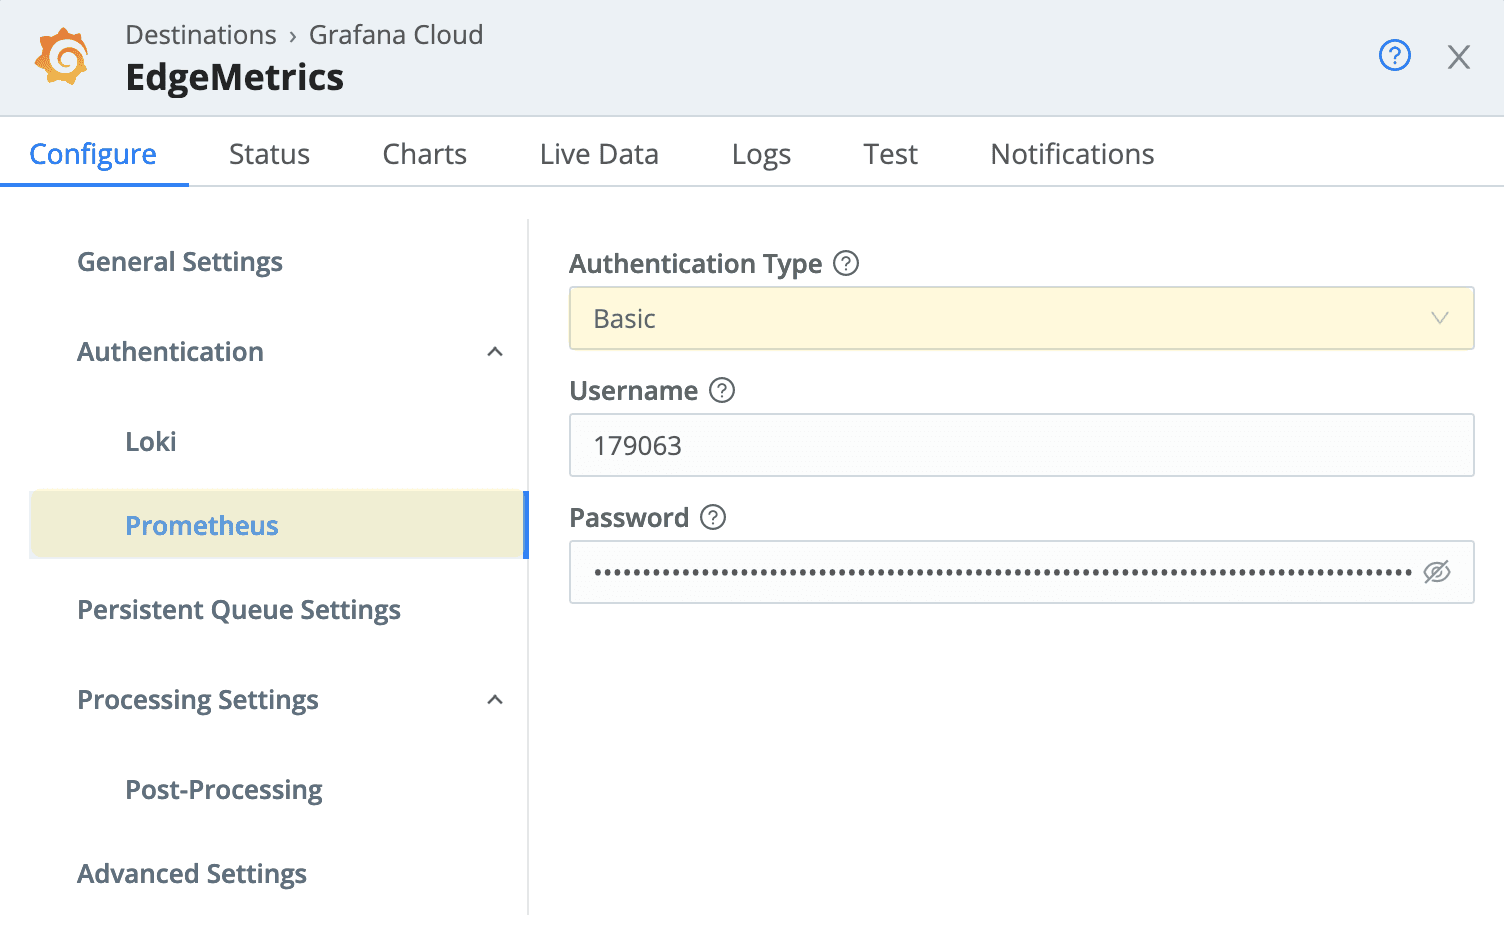
On the General Settings tab of your new source, insert the Prometheus URL you collected and then switch to the Authentication → Prometheus tab, select the Basic Authentication Type and insert both the User information and the API Key you previously generated and noted down. Your input should look similar to the following. Note that both the Loki and Prometheus URLs are required before you can save the input.
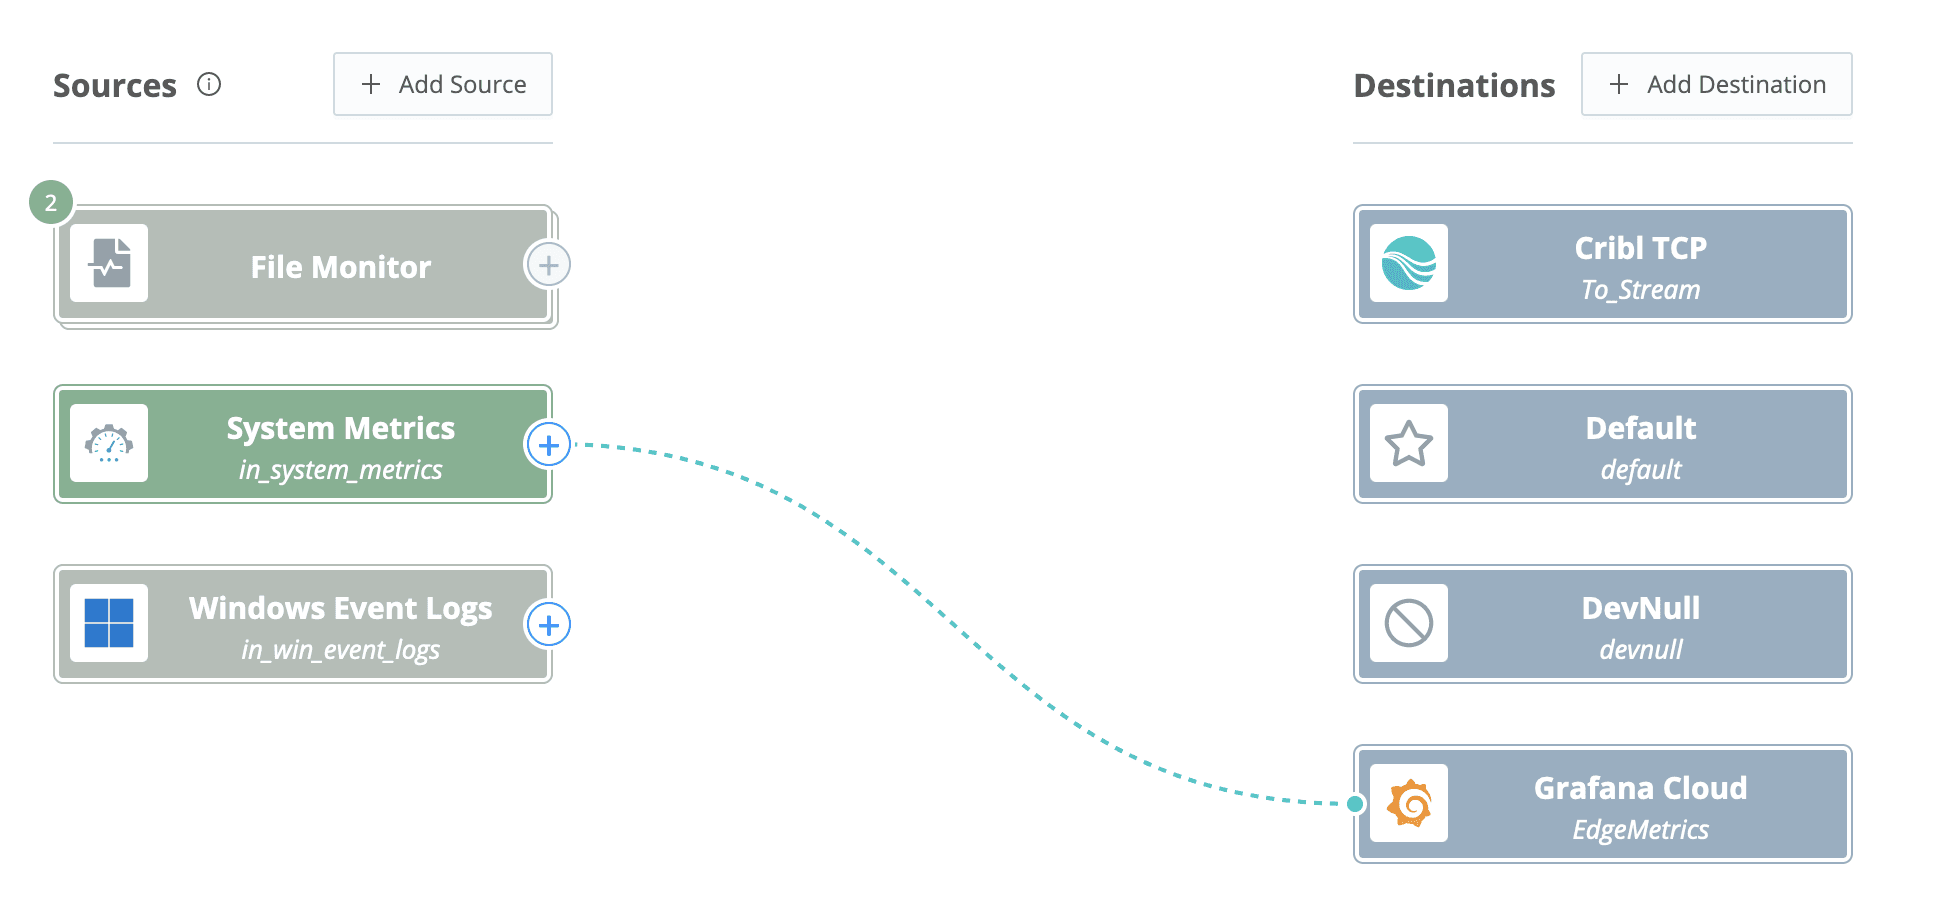
Once the Destination is configured, the final step within the Cribl UI is to create a Route to send the metrics from the Edge Nodes to Prometheus. Since we don’t need to apply a filter to the source, we can utilize the Quick Connect feature. Quick Connect can be configured by selecting the Collect tab from within the Edge fleet interface. As seen below, dragging a connector between the System Metrics and Grafana Cloud destination and selecting the passthru option will enable the data flow, once the change has been committed and deployed.
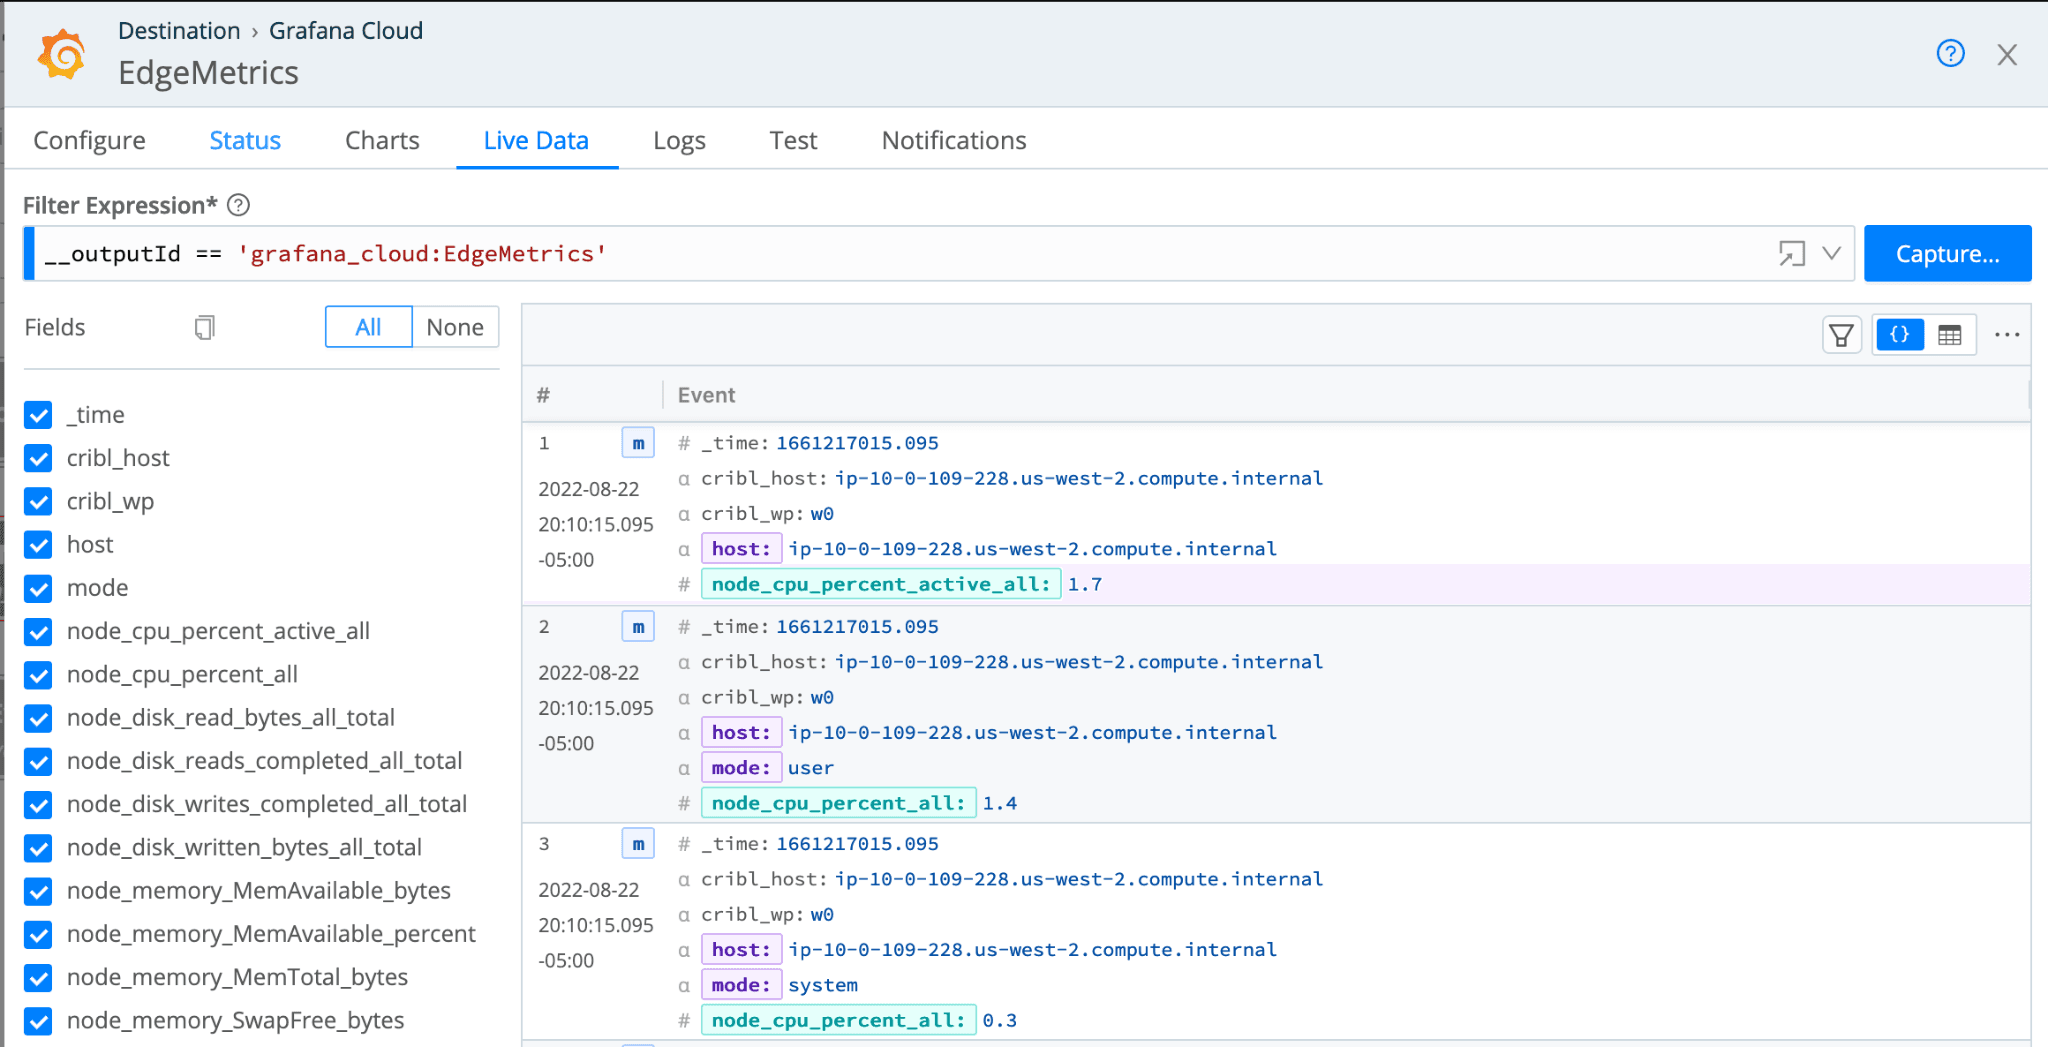
After you commit and deploy, you can run a live capture on the destination to confirm data is being sent to Prometheus.
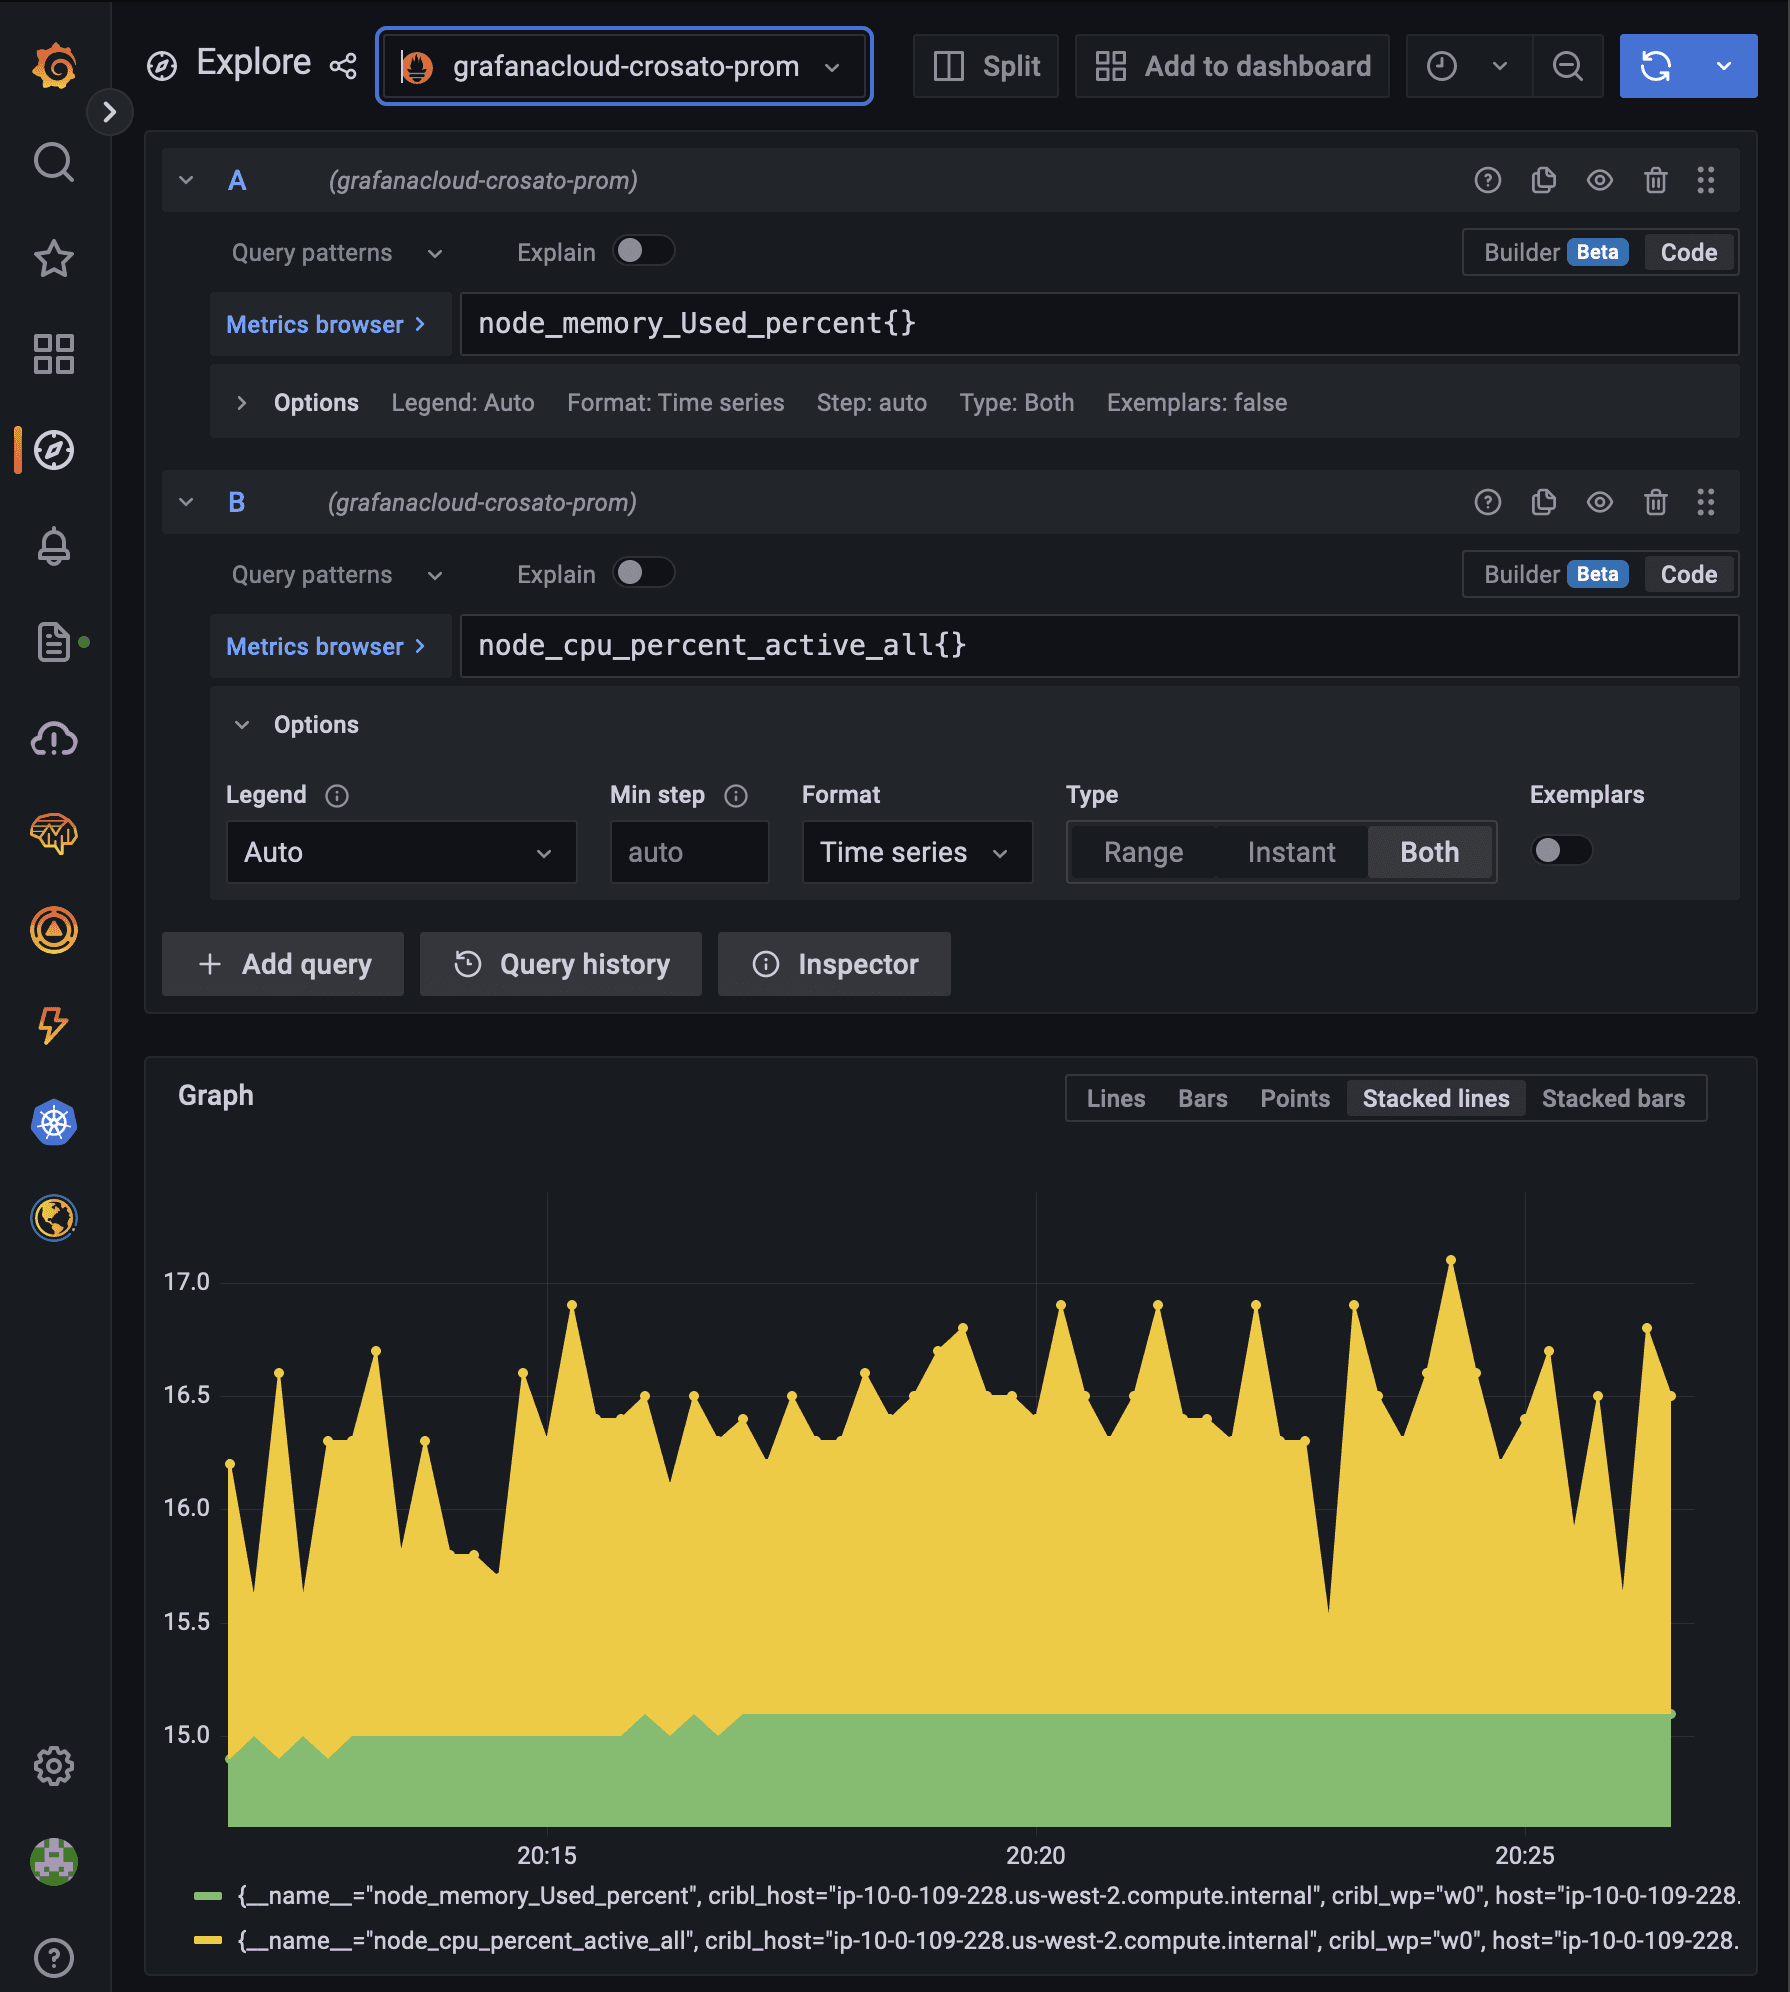
With all the configurations complete, you can navigate to your Grafana Cloud instance, select Explore on the left panel and review the node metrics. Selecting metrics and running the query will produce a chart and table of metric events that can be added to new or existing dashboards for analysis.
Wrap Up on How to Streamline Endpoint Data Collection
While our use case was to send metrics to Grafana Cloud, you could easily replicate this workflow to send metrics or logs to your existing system of analysis. By spinning up a Cribl.Cloud instance you automatically have access to the Cribl Edge interface on the Leader and can install the agent and test the workflow with data sources and destinations relevant to your environment!
The fastest way to get started with Cribl Stream, Edge, and Search is to try the Free Cloud Sandboxes.